M
ASTER OF
S
CIENCE IN
FINANCE
M
ASTERS
F
INAL
W
ORK
PROJECT
EQUITY RESEARCH REN - REDES ENERGÉTICAS
NACIONAIS, SGPS, S.A:
A REGULATION APPROACH BASED ON TOTEX
JOANA SILVA MENDES
M
ASTER OF
S
CIENCE IN
FINANCE
M
ASTERS
F
INAL
W
ORK
PROJECT
EQUITY
RESEARCH
REN
-
REDES
ENERGÉTICAS
NACIONAIS,
SGPS,
S.A:
A
REGULATION
APPROACH
BASED
ON
TOTEX
JOANA SILVA MENDES
S
UPERVISOR
:
VICTOR
MAURÍLIO
SILVA
BARROS
i
Abstract
This project contains an extensive valuation of REN – Redes Energéticas Nacionais S.G.P.S, S.A., a
company listed in the Portuguese Stock Exchange (PSI20) and operating in the Electric Utilities
Industry, specifically in the Transmission sector.
This equity research report follows the guidelines and recommendations of the CFA Institute and only
considers the public information available as at February 9
th, 2018.
The price target was achieved through an absolute valuation method in a form of a Discounted Cash
Flow (DCF) Approach to derive the Enterprise Value of each REN’s operational segments (Electricity,
NG Transmission, NG Distribution, and Others) and used the Dividend Discount Model (DDM) to
value Chilean operations, and then the Sum of the Parts Approach to determine the value of the entire
company.
A 2018YE price target of €2.76 per common share was reached, implying a 15% upside potential
from the February 9
thclosing price of €2.43, supporting our BUY recommendation for REN, with low
risk. To further support our final recommendation, complementary valuation methods such as Free
Cash Flow to Equity (FCFE), the DDM and a Multiples Valuation were applied.
Additional analysis takes into consideration the possibility of a liquidation approach and a switch to a
TOTEX regulatory framework. Both analysis account for a lower price target for REN: €2.49 for a
liquidation approach and €2.55 as for a move to a TOTEX Framework, though still modestly above
the €2.43 closing price.
JEL classification: G10; G30; G32; G34.
ii
Resumo
Este projeto contém uma avaliação extensa da REN - Redes Energéticas Nacionais S.G.P.S, S.A.,
empresa cotada no PSI20 e que opera no Setor Elétrico, especificamente no sector do Transporte.
Este relatório segue as recomendações do Instituto CFA e considera apenas a informação pública
disponível até 9 de fevereiro de 2018.
O preço alvo foi obtido através de um método de avaliação absoluto, mais concretamente o método
dos Fluxos de Caixa Descontados (DCF) para determinar o valor intrínseco de cada segmento
operacional da REN (Transmissão de Eletricidade, Transmissão de Gás Natural, Distribuição de Gás
Natural e Outros) e foi usado o Método dos Dividendos Descontados (DDM) para avaliar as
operações chilenas e a soma das partes para determinar o valor total da empresa.
Foi obtido um preço alvo de €2.76 por cada ação em 2018FA, representando um potencial de
crescimento de 15% em relação ao preço
de €2.43 a 9 de fevereiro de 2018, suportando a nossa
recomendação de COMPRA para a REN, com baixo risco. Para suportar a nossa recomendação
final, foram também usados métodos complementares de avaliação, como o Fluxo de Caixa Livre
para os Acionistas (FCFE), o Modelo dos Dividendos Descontados (DDM) e uma Avaliação de
Múltiplos.
Foi feita uma análise extra que considera a possibilidade de liquidação do negócio da REN e uma
mudança para uma estrutura de regulamentação baseada nos custos totais (TOTEX). Ambas as
análises representam um preço alvo mais baixo para a REN: €2.49 para o cenário de liquidação e €
2.55 para uma mudança para uma estrutura de regulação baseada no TOTEX, embora ainda
modestamente acima do preço atual.
Classificação JEL: G10; G30; G32; G34.
Palavras-Chave: Equity Research; Avaliação de Empresas; Fusões e Aquisições; Fluxo de Caixa
Descontados; Regulação; Dividendo.
iii
Acknowledgements
It has been a long journey filled by several challenges and uncertainties along the way.
No venture is carried out effortlessly or easily, but with all of my hard-work, dedication and
determination I made it, and now here I am at the final step of my academic journey.
Finishing this project means a lot to me and it would not have been possible without the support and
help of many people. I would therefore like to express my sincere thanks to all of them.
I would first like to thank my supervisor and CFA Research Challenge 2018 advisor Victor Barros,
who offered his continuous guidance, wise advices and encouragement throughout this project. I
could not have imagined having a better advisor for this project.
A sincere thanks to Professor Clara Raposo, for giving me the unique opportunity to be part of this
incredible experience.
I must also express my gratefulness to my mother and dad. Without their support none of this would
have been possible.
To my sister Daniela, a sincere thank you for the motivation, understanding and for being always with
me for everything.
A deep thank you to my boyfriend André, who was unconditionally by my side supporting me since
day one and always made me believe I would reach the end of this stage.
To my friends, thank you for the patience and for being with me over the years.
At last but not least, to my CFA family: João Silva, Katharine Cardwell, Pedro Gomes and Ricardo
Duarte. Thank you for the sleepless nights when we were working together and for all the fun we have
had. You made this experience full of good memories.
iv
Disclosure
A significant portion of this report was submitted by a group of students at ISEG, including the
candidate, for the CFA Institute Research Challenge 2017, Portuguese Local final. With the wining
of the Local final, the same report was submitted for the EMEA Regional Final 2017 in Prague,
Czech Republic, as a representative of the CFA Society Portugal. This report is published for
educational purposes by Master students at ISEG and is not an investment recommendation. This
report must be read with the Disclosures and Disclaimer at the end of this report. Appendices that
support this report may be obtained from author upon request.
v
Index
Abstract
i
Resumo
ii
Acknowledgements
iii
Disclosure
iv
Index
v
List of Figures
vii
List of Tables
viii
1.
Research Snapshot
1
2.
Business Description
2
3.
Corporate Governance
3
4.
Industry Overview and Competitive Positioning
4
5.
Investment Summary
6
6.
Valuation
7
7.
Financial Analysis
8
8.
Investment Risks
9
9.
A Regulation Approach Based on TOTEX
11
Appendices
13
Appendix 1: Statement of Financial Position (REN)
13
Appendix 2: Income Statement (REN)
14
Appendix 3: Cash-Flow Statement (REN)
15
Appendix 4: Key Financial Ratios
16
Appendix 5: Statement of Financial Position Assumptions
16
Appendix 6: Income Statement Assumptions
17
Appendix 7: EBITDA Breakdown by Segment
18
Appendix 8: RAB Breakdown
19
Appendix 9: RoR Breakdown
19
Appendix 10: REN’s CAPEX
20
Appendix 11: Regulator’s WACC Computations
20
Appendix 12: Electricity and Natural Gas Value Chains
21
Appendix 13: Order of Merit of Energy Sources
21
Appendix 14: REN’s Business Structure
22
Appendix 15: Governance Model
22
Appendix 16: BoD Remuneration
22
Appendix 17: Comparable Companies
23
Appendix 18: Valuation through Multiples
23
vi
Appendix 20: WACC Assumptions
25
Appendix 21: REN’s Share Capital Increase
26
Appendix 22: Sum of the Parts (SoP) Analysis
27
Appendix 23: FCFE & DDM Analysis
28
Appendix 24: Liquidation Approach
29
Appendix 25: Electricity and NG Allowed Revenues
30
Appendix 26: Risk Matrix
32
Appendix 27: Porter’s Five Forces Model
33
Appendix 28: TOTEX Regulatory Framework
34
Appendix 29: List of Abbreviations
37
vii
List of Figures
Figure 1: REN Price Target
1
Figure 2: REN’s Dividend Yield Evolution
1
Figure 3: Revenues per Segment
2
Figure 4: Electricity Indexation Methodology 2016-2019
2
Figure 5: NG Indexation Methodology 2016-2019
2
Figure 6: Electricity OPEX vs Revenues from OPEX
2
Figure 7: NG OPEX vs Revenues from OPEX
3
Figure 8: Shareholder’s Structure
3
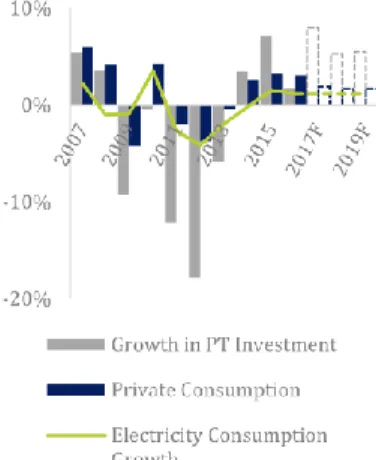
Figure 9: Electricity Consumption vs Economic Indicators
4
Figure 10: 10Y Portuguese Bond Yields
4
Figure 11: Electricity Consumption by Sector (2008-15)
4
Figure 12: Electricity Consumption Growth vs Real GDP Growth
4
Figure 13: NG Consumption & Renewables Production Correlation
5
Figure 14: CO2 Prices vs Electricity Production from Coal
5
Figure 15: Electricity Generation Evolution in LATAM (TWh)
5
Figure 16: Electricity Generation by source in Chile, 2016
5
Figure 17: Real GDP Growth vs Inflation rate in Chile
6
Figure 18: Porter’s Five Forces
6
Figure 19: REN vs Peers Efficiency 16YE
6
Figure 20: REN vs Peers Multiples
7
Figure 21: Debt/Equity Ratios
8
Figure 22: Multiples Valuation Heat Map
8
Figure 23: OPEX Efficiency
8
Figure 24: Hedging Strategy Results
8
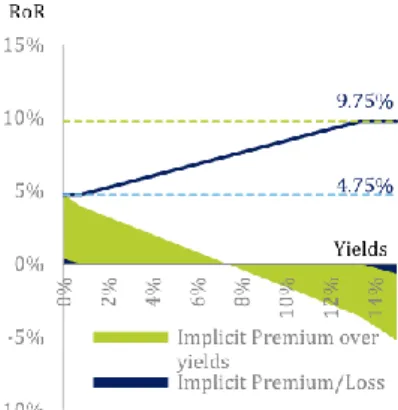
Figure 25: REN WACC vs RoR
8
Figure 26: Risk Matrix
9
Figure 27: DPS vs Payout-ratio
9
Figure 28: 2017 REN vs Peers Liquidity (€’000)
9
Figure 29: REN price sensitivity to certain variables
10
Figure 30: Electricity Revenues Breakdown
11
Figure 31: NG Revenues Breakdown
11
viii
List of Tables
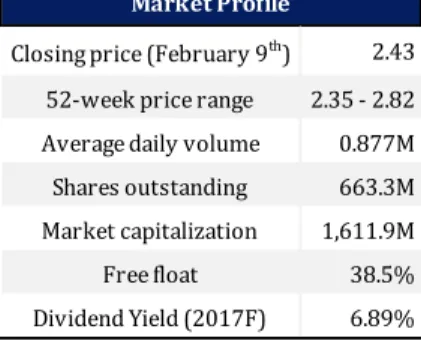
Table 1: REN market data
1
Table 2: Impact on REN’s Price Target of 1% Increase in Yields, per Year
1
Table 3: REN’S Business Plan
3
Table 4: Governance Metrics
3
Table 5: REN’s Sensibility to Yields
6
Table 6: REN’s Price Target
7
Table 7: REN’s WACC
7
Table 8: Peers’ Group
7
Table 9: Scenario ESEC Levy ending in:
10
Table 10: Sensitivity analysis for the Terminal Growth Rates
10
Table 11: Sensitivity analysis for the 10Y Portuguese Bond Yield
10
Table 12: REN’s Price Target under TOTEX Approach
11
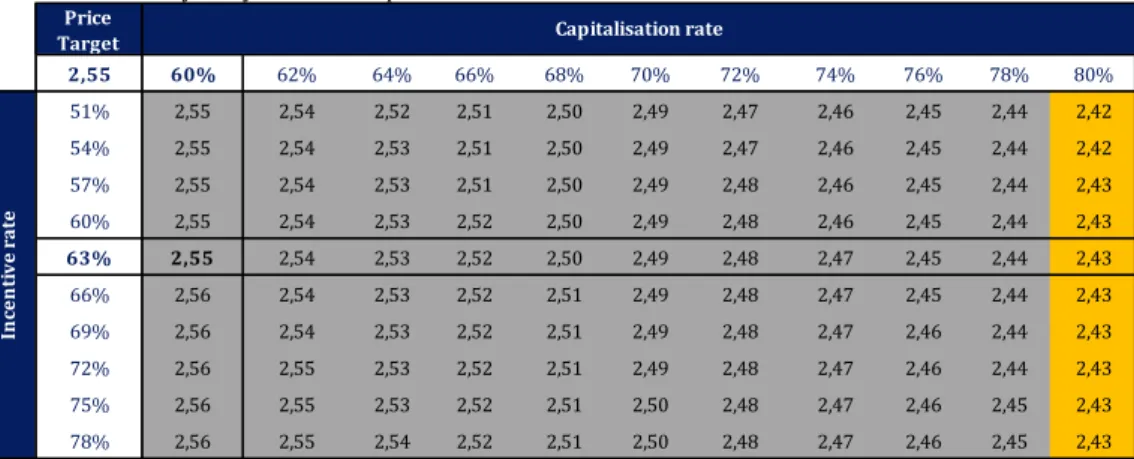
Table 13: Sensitivity analysis for the Capitalisation Rate and Incentive Rate
12
Table 14: Sensitivity analysis for the Efficiency Factor
12
1
REN – Redes Energéticas Nacionais S.G.P.S., S.A.
Electric and Natural Gas Utilities – Utilities
Portuguese Stock Exchange (PSI)
Date: 11/02/2018
Current Price: 2.43
Recommendation:
BUY
(15% Upside)
Ticker: RENE.PL (Bloomberg) EUR 1.000: USD 1.22
Target Price:
EUR 2.76
(USD 3.37) Low-Risk
REN: Moving towards a TOTEX paradigm
1. Research Snapshot
After a comprehensive analysis on REN, S.G.P.S, S.A. (REN), we initiate a BUY recommendation with a 2018YE price target of €2.76/sh using a DCF model, implying a 15% upside potential from the February 9th closing price of €2.43/sh, with low-risk.
REN is holding its ability to generate cash, pay the dividends as well as to pursue opportunities for growth abroad due to:
1. Solid Core Business & Commitment to Efficiency: REN’s monopolist position entails the heavy
regulation it faces. Thus, the company does not have much room to manage their operational results, enabling the generation of stable and highly predictable operating results and free cash flows. We foresee a 2017F-23F Operating Results stabilization at -0.7% CAGR, despite the decreasing trend expected in operating income of -1.2%, and FCFF ranging 160M-190M and 65M-100M for Electricity and NG Transmission, respectively.
Significant changes in results may occur due to efficiency targets set up by the regulator (ERSE). Despite its outstanding performance in being one of the most efficient TSOs in the world, especially in terms of operational expenditures (OPEX), it is coming a new regulatory framework (TOTEX) that aims to remove any CAPEX bias that may appear when the company try to outperform the regulator’s OPEX benchmarking. This new approach aims to encourage the company to overall cost reduction and thus more efficiency, as it is one of REN’s main standards. The marginal effect of the switch to a TOTEX framework is €-0.21/sh from the €2.76/sh FCFF to a price target of €2.55/sh, still slightly above the current price of €2.43/sh.
2. Strategic Debt Management: REN increased the average maturities and the weight of fixed rate debt for
about 63% in 2018F, benefiting from the low yields period. As result of this strategy, when yields start rising- as expected- RoR will increase more than its cost of debt, having a positive effect on REN. A 1% increase in yields in 2018F impacts RoR by +0.4% while affecting the cost of debt by +0.37% (table 2). The expected increase in the spread between the average RoR and the cost of debt (+312bps to +340bps) will allow the ICR to consistently increase in the forecasted period, thus protecting REN’s earnings.
3. Diversification to NG Distribution Segment: REN´s acquisition of Portgás gave an immediate growth of
+13% in its RAB, which allowed to keep it above 2016 levels until 2020, tackling the RAB decreasing issue. The acquisition also gives future growth due to Portgás’ strong growth potential. With the expected increase in NG penetration rates (from current 26.4% to 35%-40% in the next 10-15 years) and the higher 30bp return in NG distribution compared to the WACC for NG transmission, we foresee a 1.5% CAGR growth in FCFF of Portgás in the next 5 years, allowing to keep REN’s FCFF stable. Also, the capital increase expanded the free float, increasing liquidity of REN´s shares. This acquisition is adding value that is not being recognized by the market.
Looking for Growth Abroad
The cash surplus of about 433M€ in 2023F will create a better buffer to pursue opportunities abroad. REN’s first international investment was the acquisition of a 42.5% share of Electrogas in Chile. Chile’s forecasted GDP growth is at 3% CAGR over the next 4 years and expectations are for higher penetration rates in Santiago, reflecting the doubling in NG consumption.
LATAM offers many growth opportunities for TSOs. Electricity generation and NG consumption in this region is expected to grow at 1.4% and 3.5% CAGR until 2030, respectively. Expectations are for craving additional investments in LATAM. 1,5 1,7 1,9 2,1 2,3 2,5 2,7 2,9 01 /20 12 06 /20 12 12 /20 12 05 /20 13 11 /20 13 05 /20 14 10 /20 14 04 /20 15 10 /20 15 03 /20 16 09 /20 16 02 /20 17 08 /2 01 7 02 /20 18
Closing Price Price Target 9th February with TOTEX
+15% upside EUR 2.76 +6% upside EUR 2.55 EUR 2.43 Table 1: REN market data
Source: REN & Reuters
Figure 1: REN Price Target
Source: Team estimates
Figure 2: REN’s Dividend Yield Evolution
Source: Team estimates
Table 2: Impact on REN’s Price Target of 1% Increase in Yields, per Year
Source: Team estimates
Closing price (February 9th) 2.43
52-week price range 2.35 - 2.82 Average daily volume 0.877M Shares outstanding 663.3M Market capitalization 1,611.9M Free float 38.5% Dividend Yield (2017F) 6.89% Market Profile 2,49 2,06 2,81 2,62 2,53 2,77 2,76 2,43 LIQUIDATION P/E P/D EV/EBITDA DDM FCFE FCFF CLOSING PRICE 0% 2% 4% 6% 8% 10% 0,165 0,168 0,171 0,174 DPS Dividend yield 2018F 2023F Δ% in RoR 0.40% 0.40% Δ% in Cost of Debt 0.37% 0.63% % Gain/Loss 0.03% -0.23% Price Target 2.80 2.71
2
2. Business Description
REN - Redes Energéticas Nacionais S.G.P.S., S.A., jointly with its subsidiaries referred to as REN Group, is
Portugal’s exclusive operator and manager of the mainland transport infrastructure of the National Electric System (SEN) and the National Natural Gas System (SNGN). It is a highly regulated publicly listed company, contracted by the state with its core business of guaranteeing an uninterrupted supply of electricity and natural gas to mainland Portugal. As a secondary business REN operates in telecommunications as well as other minor domestic and international investments.
In 1994 REN was initially created as a business unit within Energias de Portugal, SA (EDP), Portugal’s sole and vertically integrated electricity provider. In November 2000, legislation required the liberalization of the electricity transmission and generation business and as a part of the unbundling, REN Rede Eléctrica was spun off and purchased by the Portuguese Republic. In 2006, the gas industry faced similar legislation and liberalization resulted in the unbundling of the subsidiaries of GALP Energia, S.A., giving REN the opportunity to purchase the Sines terminal from Transgás. This provided REN with a significant portion of their assets, including the gas transmission, natural gas underground storage, and liquefied gas (LNG) terminal, which includes the regasification facility. As a result of these transactions, REN S.G.P.S. was formed to recognize the new group structure as Portugal’s transmission operator for both electricity and NG. Starting in 2007, REN underwent a series of three privatization stages. The first divested approximately 43% of REN’s share capital. The second, in 2012, opened the door for the State Grid of China (25%) and Oman Oil (15%) to become leading shareholders. The third and final phase divested the remaining 17%.
Electricity
REN’s electricity segment is expected to generate 71% of 2017F revenues, with an operating margin of 38.93%. It is comprised of three subsidiaries with the primary, Rede Eléctrica Nacional, operating under a 50-year concession which matures in 2057. The concession rights stipulate the full management of the grid including 8,863km of Very High Voltage lines. The other two subsidiaries complementing this core business are REN Trading, S.A., responsible for the purchase, sale, import and export of electricity as well as management of long-term power purchase agreements (PPAs), and Enondas - Energia das Ondas, S.A. which manages the concession to operate a pilot area to produce electricity from sea waves.
Natural Gas
REN’s natural gas (NG) segment is expected to generate 26% of 2017F revenues, with 44.98% and 29.69% operating margins in transportation and distribution, respectively. Transportation operates under a 40-year concession maturing in 2046. The concession stipulates the transport and overall technical management of 1375 km of high-pressure pipeline, the LNG Sines Terminal and 6 underground storage facilities with a capacity of 333Mm3. The business is comprised of four subsidiaries which together deliver the full scope of the business.
REN Gasodutos, S.A. is responsible for the high-pressure transmission of natural gas and general technical management of the SNGN and the supply switching process. REN Atlântico, Terminal GNL, S.A. manages the reception, storage, and regasification of the LNG terminal in Sines. REN Armazenagem, S.A manages the underground storage and related facilities in Carriço. Additionally, REN’s recent acquisition of REN Portgás from EDP Gás, SGPS, S.A. in Oct 2017 gave REN Portugal’s second largest gas distribution network (4,760km) in the northern coastal region of Portugal, with a 2017F Regulated Asset Base (RAB) estimated at €451.6M, growing REN’s asset base by 13%. The transaction included full control over a 40-year concession ending in 2048, allowing REN to further exploit their proficiency in the industry.
Others
REN’s remaining segment is expected to generate the final 3% of 2017F revenues. The primary contributor is a 42.5% stake in the Chilean gas pipeline company Electrogas S.A, which REN completed in 2017 for €169M. Electrogas operates a 165.6 km natural gas pipeline starting from Quintero’s regasification terminal down to the city of Santiago, Chile’s largest population center. The company also operates a 20.5 km diesel oil pipeline. Equity method accounting for this investment results in a direct impact on the bottom line, and the stake is expected to have an impact of 1% on revenues, and 5% on earnings by 2018F. Also included in this segment is RENTELECOM Comunicações, S.A. which manages the telecommunication services with the primary goal of deriving profits by optimizing the optical fiber excess capacity of the installations owned by REN Group, and REN Serviços, S.A. which provides engineering and advisory services to third parties. This last segment, excluding Electrogas, has an operating margin of -51.45%.
Key Drivers of Profitability Yields: Driving Core Remuneration
REN’s operational results face heavy regulation. Through annually set tariffs, ERSE regulates close to 100% of REN’s revenues from electricity and NG distribution. REN’s core remuneration from both electricity and NG activities comes from the rate of return (RoR) REN receives on its Regulated Asset Base (RAB). Moreover, for the electricity segment there is an embedded incentive to efficient investment that provides the RoR with an additional premium when certain criteria are met (Appendix 25). Currently, electricity RAB at premium accounts for 55% of the total at 2017F and we project all forecasted electricity investment will benefit from this premium remuneration. The RoR is defined at the beginning of the 3Y regulatory period based on the cost of capital computed by the regulator (Appendix 11). During that time, it will vary in direct relationship with the 10Y Portuguese yield, bounded by a Cap and a Floor for each activity (Figure 4 & Figure 5). As for RAB, it depends strictly on amortization’s relation with CAPEX, which in turn is driven by demand, supply, and the need for interconnection with the Spanish network system. However, the TSO’s investment is subject to approval by the government after ERSE’s approval. CAPEX is expected to be €138M in 2017F, growing at -1% CAGR 2017F-23F.
Figure 3: Revenues per Segment
Source: Team estimates
Figure 4: Electricity Indexation Methodology 2016-2019
Source: ERSE & Team estimates
Figure 5: NG Indexation Methodology 2016-2019
Source: ERSE & Team estimates
Figure 6: Electricity OPEX vs Revenues from OPEX
3 Costs Recovery and Incentives: Efficiency
REN’s remuneration is also based on the operational expenditures (OPEX) and the amortizations net of subsidies aiming to cover the operational and investment costs incurred by REN. The revenue component linked to OPEX evolves annually depending on the efficiency targets set by the regulator, which change every regulatory period of 3Y. For electricity concession, REN also receives a remuneration for the use of assets that technically still fit their purpose and continue to operate but have been fully amortized. Revenues from OPEX, remuneration of fully amortized assets, and recovery of amortizations is expected to yield €343.74M in 2017F, or 45% of revenues.
Company Strategies
Maintaining Investment at Home: REN intends to continue investing in Portugal, to maintain a
stable RAB and keep revenues steady. Additionally, the Share Purchase Agreement of €532M with the EDP Group to acquire 100% of EDP Gás (EDPD) reinforces REN’s focus on the domestic and core infrastructure business as a top priority.
Commitment to Efficiency: REN has the main task to meet supply and demand of both NG and
electricity with minimum losses, accidents, and failures. The company reported zero interruption in the supply of NG and 1.72% of energy transmission losses in electricity with only 0.34 minutes per offtake in supply interruption. This efficiency is expected to be maintained in the future as it is one of REN’s main standards that awarded them as one of the best TSOs in the world in an International Transmission Operations and Maintenance Study (ITOMS).
Holding the Balance: REN aims to maintain its investment grade rating and stable dividend policy
of €0.171/sh through continued financial discipline.
Looking Abroad: REN seeks international investment opportunities, although a quiet period after
two recent acquisitions is expected. One of those moves was REN’s first international investment, by acquiring a 42.5% interest in Electrogas S.A. (€169M) in 2017, a Chilean company that owns a gas pipeline in the central zone of Chile. It currently accounts for 1% of revenue and we project this revenue to increase to 2% CAGR from 2017F to 2020F and 4% onwards.
Shareholder Structure
REN’s largest shareholder is State Grid of China with a 25% ownership position (maximum allowed by the Portuguese competition authority). Oman Oil, a state-owned petroleum company, is the second largest shareholder with 12%. The third largest with only 6.9% ownership is Lazard Asset Management, a US investment manager. The remaining shareholders are Fidelidade (5.3%), and four others who own about 5% each. Notably, inside ownership only accounts for 2.1% of outstanding shares and 2017YE free float reached 38.5%.
The recent share capital increase puts REN at 663.3M shares outstanding. These ordinary shares are traded on Euronext Lisbon and do not grant any special rights beyond the shareholder’s general rights. The rights offering (raising €250M) was well received by investors as evidenced by the oversubscribed demand at 1.66x. Despite the capital increase, REN’s capital structure has been stable for the period from 2016 to 2017F (Appendix 4).
3. Corporate Governance
Mr. Rodrigo Costa was elected REN’s CEO and Chairman of the Board in 2014. He has an unconventional background with 38 years of experience (15 years with Microsoft Portugal as founder and General Director and executive positions on Unicre and ZON Group). Mr. João Faria Conceição has been with REN for 9 years and is currently REN’s COO. He holds a degree in Aerospace Engineering and an MBA from INSEAD (France). Mr. Gonçalo Morais Soares serves as the CFO, Investor Relations Officer and Executive Director and has 20 years of experience in Corporate Finance. He earned a degree in economics as well as an MBA from Georgetown University and completed executive training at the Northwestern Kellogg Business School.
Board Structure and Attendance
There are 12 seats on the Board of Directors with only 33.3% independent, below both the generally accepted standard of 66% as well as the peer average of 56.4%. The State Grid of China and Oman Oil occupy four of the seats, contributing to the low independence rate. REN’s ISS Quality Score is 5, with 1 being the highest out of 10, which places them just above their peer average at 5.9. This metric analyzes 200 factors divided over 4 pillars, providing shareholders an indication of where REN stands in terms of company best practices. The notable contributing factors for REN’s score include board meeting attendance of 97% which is considered high and within range of the peer average of 98% (Table 4). Also, REN’s management remuneration structure is aligned with the company’s performance. Besides the normal fixed salary, compensation is tied to two variable components, short-term and long-term, each having a payout structure tied to KPIs which require a minimum of 80% be met for a positive payout.
Corporate Governance
REN follows the Anglo-Saxon corporate governance model where shareholders in attendance at the General Meeting elect the following to 3-year terms:
General Meeting – appoint and dismiss the members of the BoD, the remunerations committee and
the statutory auditor;
BoD – who appoint the three members of the Executive Committee responsible for managing the
daily operations, as well allocation of resources and performance reviews.
Audit Committee – three non-executive members that supervise the management of the company
and propose the appointment of the statutory auditor to the General Meeting. Statutory Auditor – Deloitte & Associates who examines the financial statements.
Remuneration Committee – three non-executive members who set compensation.
Figure 7: NG OPEX vs Revenues from OPEX
Source: REN & Team estimates
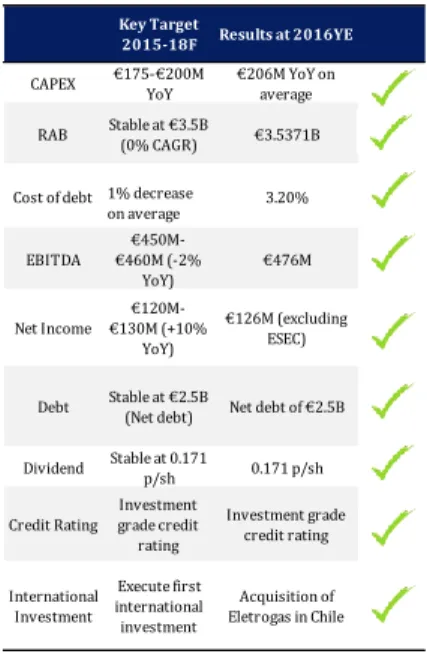
Table 3: REN’S Business Plan
Source: REN
Figure 8: Shareholder’s Structure
Source: REN
Table 4: Governance Metrics
Source: Bloomberg 0 10 20 30 40 50 2012 2013 2014 2015 2016
OPEX Revenues from OPEX
Key Target
2015-18F Results at 2016YE
CAPEX €175-€200M YoY €206M YoY on average
RAB Stable at €3.5B (0% CAGR) €3.5371B
Cost of debt 1% decrease
on average 3.20% EBITDA €450M-€460M (-2% YoY) €476M Net Income €120M-€130M (+10% YoY) €126M (excluding ESEC)
Debt Stable at €2.5B (Net debt) Net debt of €2.5B
Dividend Stable at 0.171 p/sh 0.171 p/sh Credit Rating Investment grade credit rating Investment grade credit rating International Investment Execute first international investment Acquisition of Eletrogas in Chile 25.0% 12.0% 6.7% 5.3% 5.0% 4.8% 2.1% 0.6% 38.5%
State Grid of China Oman Oil
Lazard Asset Management LLC Fidelidade - Companhia de Seguros, S.A. Red Eléctrica I nternacional, S.A.U. The Capital Group Companies, INC. Great-West Lifeco, INC. REN
Metric REN AveragePeer's
ESG Score 50.8 50.9 ISS Score 5.0 5.9 Governance Disclosure Score 60.7 58 % Independent Directors 33.3 56.4 Board Meeting Attendance 96.7 98
4
REN completed a full revision of their Corporate Governance system in 2013 and adopted the full set of recommendations put forth by the CMVM. To date, REN satisfies 88.6% of the recommendations. Bloomberg reports REN’s overall Governance Disclosure Score of 60.7, which is higher than the peer average of 58. Also, the one-share-one-vote principle protects minority shareholders, giving them such rights as voting for candidates for the BoD and the right to receive dividends. Limiting voting share ownership to 25% by any single entity is another protection mechanism to minority shareholders, along with management compensation linked to KPIs.
Sustainability and Social Responsibility
REN’s sustainability strategy highlights three main areas: health and safety, including extensive on-the-job training including regular emergency response practice exercises; environmental protection, with an emphasis on climate change and minimizing environmental impact by managing consumption and reducing impact of the electromagnetic fields; and connection with the community, where REN partnered with Science & Technology Foundation and University of Porto to create a Biodiversity Department.
4. Industry Overview and Competitive Positioning
Portuguese Economic Outlook
In the aftermath of the sovereign crisis, Portugal has been on a recovery path. GDP is expected to post growth of about 2.60% in 2017 and is expected to grow 2.30% this year, bringing GDP back to 2008 levels. The main growth drivers in the period 2016-2020 are private consumption and investment, which are expected to grow at 1.95% and 6.42% CAGR, respectively (Figure 9).
Investment Grade and Lower Yields
The Portuguese budget efforts to reduce debt and deficits, the GDP recovery, and the ECB’s Quantitative Easing program all culminated in an elevation of the investment grade rating. Currently, it enjoys a credit rating of BBB- from S&P. These factors allowed the Portuguese Government to become less risky in the eyes of investors, permitting them to progressively refinance at lower interest rates. At 2017YE the Portuguese 10Y bond yield was quoting at 1.932%, dramatically lower than the historical maximum of 13.557% reached in Dec. 2011 (Figure 10).
Demand for Energy
The main consumers of electricity are manufacturing & agriculture, services, and residential (Figure 11) Historically, electricity consumption moved in accordance with GDP growth, although the mature market conditions should decouple this highly correlated relation (Figure 12). Electricity consumption is expected to grow at a +0.5% CAGR in 2016-2030F, justified by its historical positive correlation with private consumption and investment, already considering a forecasted +22.8% CAGR of electric vehicles circulating until 2030. The consumption of NG is divided into two segments. The electric market (EM) which encompasses electricity production centers, while the conventional market (CM) is composed of manufacturing (glass, ceramic, food and textile), residential & commercial, and transport.
The EM is an important NG consumer. Local DGEG forecasts point to an increase of +3.8% CAGR in 2017F-27F, powered by decarbonization policies. Yet, the demand for NG in this sector is highly volatile and unpredictable due to its negative correlation with the production of renewable energy (Figure 13). The consumption of NG by the CM is expected to grow timidly at +0.76% CAGR in 2017F-27F. Overall, the expected growth for the consumption of NG in the period is +1.53% CAGR.
Supply Side Perspective Renewablization
The European Commission (EC) demands 31% of the total consumption of electricity to come from renewable sources by 2020. Consequently, the installed capacity increased by a +5.61% CAGR in 2010-2016 to about 13,045MW, representing 66.84% of the total and expectations point to a persistent trend. Renewable electricity is the cheapest and cleanest source of energy. Hence, it is first in the order of merit to match demand ( Appendix
13
). If the production is enough to supply the entire demand, the production centers using other sources (fuel, natural gas, coal, nuclear) will simply not function. However, the renewables are not a fully reliable source of energy due to their dependence on weather conditions and to the impossibility to store it. Moreover, the production poles are essentially located in remote zones, far from the major consumption centers.Decarbonization
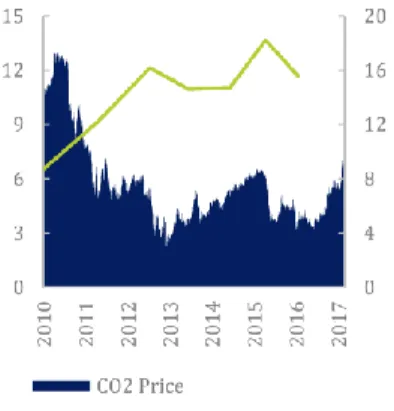
Coal is one of the main sources of electricity production, representing on average 22% in 2010-16 of the total production in Portugal. Even though coal is 50% more polluting than NG, it sometimes gets priority over NG in the electricity order of merit, benefiting from periods of low CO2 prices (Figure 14). The EC’s directives address
the need to reduce the carbon footprint. Following those directives, the Portuguese government committed to shutting down the two existent thermal energy centers (Sines and Pego) that use coal as electricity production fuel until 2030F.
Interconnections with Spain
Under MIBEL, the Iberian electricity market works as one in terms of production and price formation. Currently, there are 11 interconnection points representing an installed capacity of 2,776MW Portugal-Spain and 2,140MW Spain-Portugal. In 2030 the installed capacity is expected to be 4,200MW and 3500MW, respectively. For NG transmission there are two interconnections, and a third one is dependent on both governments’ decision, which is on hold due to the delayed construction of the interconnection between Spain and France.
Transmission Network Capex
Expansion CAPEX on the grid will be mostly driven by the increasing investment in renewable sources, given the distance of production centers from the major consumption concentrations. Consequently, there is the need Figure 9: Electricity Consumption vs
Economic Indicators
Source: INE & Bank of Portugal
Figure 10: 10Y Portuguese Bond Yields
Source: Reuters
Figure 11: Electricity Consumption by Sector (2008-15)
Source: INE
Figure 12: Electricity Consumption Growth vs Real GDP Growth
5
to connect them to the network. Despite the expected increase in demand, 8,863KM of line of very high voltage transmission network with a capacity sufficient to accommodate the future demand. Only maintenance or replacement CAPEX is required from a demand point of view. Hence, it will result in a –37.59% YoY CAPEX from €133M in 2013-17 to €85M 2018F-22F. The investment will continue a decreasing trend, but at a slower pace in the period 2023F-27F. It is expected to evolve -2.41% CAGR, reaching €81M on average.
The NG high-pressure transmission grid has enough capacity to support the forecasted increase in demand from the CM. CAPEX will be mostly driven by the decarbonization trend. Given the foreseen closure of the two coal centrals, NG will gain market share, and NG CAPEX may increase. At first sight, the increasing production of electricity from renewables reduces the need to invest in NG pipelines, although given the unpredictability of the renewable production (and impossibility to store it) maintaining the grid is key. Projections for CAPEX point to a decrease of 63.86% from the average in 2013-17F of €24.9M to €9M in 2018F-22F. The projected third interconnection with Spain represents a three-stage investment of about €225M over 9 years. About 50% will be financed by subsidies. Only the remaining 50% will be added to RAB, but the project is not expected to begin before 2020.
The Need to Go Abroad
Given the remuneration based on RAB, expectations for decreases in CAPEX will tighten TSOs revenues. TSOs from all around Europe have already begun the internationalization process to areas where the electricity and NG markets are at a development stage, in particular LATAM. The Spanish REE has 8% of revenues coming from Peru and Chile, while the Spanish NG TSO Enagas operates also in México, Chile, Peru, and Sweden, and is part in a Trans Adriatic Pipeline project. Terna diversified away from Italy to Brazil and Uruguay.
Growth in LATAM
LATAM offers growth opportunities to European TSOs looking to reduce exposure to mature local markets. The World Energy Council expects LATAM’s GDP growth to be +3.67% CAGR 2017-30F, increasing middle-class income and urbanization rates. This will drive energy demand, projected to be +1.74% CAGR for the period 2017-30F. The UN forecasts the average population growth of 0.85% CAGR in the period.
The LATAM electricity framework will shift to a renewable energy-intensive production, according to a World Energy Council’s scenario. The weight of renewables is expected to be 72% in the energy matrix by 2030 (Figure 15). This target will require an expansion of the transmission grid. Projected investments of $1.0T to $1.25T in power generation will fund the growing hydro energy leadership, along with the increasing NG footprint (CAGR +2.82% 2017-30F) as the main fossil fuel. Decarbonization pressures will also stagnate the final consumption of coal and promote electricity usage of +2.25% CAGR and NG by 3.51% CAGR.
Chile: A Good Low-Risk Growth Prospect
Expected increases in Chile’s demand for electricity of +2.74% CAGR for the period 2018F-30F will require investments in installed capacity, especially to accommodate the peak demand.
The Chilean energy plan to increase production from renewable sources from the current 36% to 60% in 2030 requires investment in the grid estimated at $1.5B for the next 5 years by Transelec, the main TSO in Chile. This investment is expected to be most acute with regards to the expansion of the current 7,000 km in the northern interconnected system (SING) area. This grid brings energy from the thermal centrals that use c.79% carbon to produce energy to large industrial and mining infrastructures.
Furthermore, the transmission sector in Chile currently suffers from poor service quality, averaging 18,77h/person of electricity outages per year according to local SEC. European TSOs have state of the art efficiency and can enjoy opportunities in this open-access market. Greenfield investments or brownfield operations will shape Chile’s electricity grid in the coming years. Investing in an A-rated country is appealing for foreign, stable, and risk-averse companies such as REN.
TOTEX: A New Regulatory Framework Coming
European capital bias regulatory models are shifting towards a more general and simple approach. TOTEX frameworks incentivize more rational, integrated, and efficient management decisions. In broad terms, under this approach, regulated networks would be given a single cost allowance, with a determined capitalization rate, thus removing the distinction between capital and operating expenditures. The industry’s thinking must change into making risk-based interventions beyond capital replacement such as extending the life of an asset, and must also examine whether required outcomes can be achieved in different ways. UK and Italy have already adapted their regulatory models to this approach and expectations are for the trend to expand to other countries.
Competitive Positioning
TSOs operate with concessions awarded by the government and are subject to regulatory frameworks that define the rules of the game, due to the natural monopoly that is embedded in these sectors of utilities. Although there are no competitors for REN, we decided to perform a comparison between the company and other European operators to provide a broader overview of how REN performs as TSO.
REN - The Power of Being Alone
REN is the sole TSO in electricity and NG in Portugal, operating as a government monopoly relatively free of threats of new entrants. The concessions given by the Government are awarded for long periods up to 50Y, and the key role of the regulator limits not only the amount of the operator’s revenues, but also the bargaining power of its customers and suppliers. In addition, pressures from substitute products remain low. Overall, our analysis reveals a favorable competitive environment for REN’s core business as shown in Appendix 27.
Efficiency and Financial Edge
Concerning operational management, REN strives to be one of the most efficient electricity and NG European TSO, incurring on average in 68% lower operational expenditures per km of managed line comparing to its European peers of €33.3 per km. This idea is further supported by its operating margin of 10.7bps above the
73,877
GWh
Figure 13: NG Consumption & Renewables Production Correlation
Source: REN & INE
Figure 14: CO2 Prices vs Electricity Production from Coal
Source: REN & Bloomberg
Figure 15: Electricity Generation Evolution in LATAM (TWh)
Source: World Energy Council
Figure 16: Electricity Generation by source in Chile, 2016
Source: Local CNE
2030F Coal Oil Natural Gas Nuclear Renewable 2014 1,291 TWh 1,871 TWh
6
peer average (Figure 19). Although operating within different regulatory frameworks, TSOs do not have much control above the EBIT line due to the embedded restrictions set by the regulators.
Hence, REN attempts to improve its results with rigorous and conservative financial management to reduce the financial costs as much as they can, helping them maintain stability and keep the constant dividend.
Baby Steps Abroad
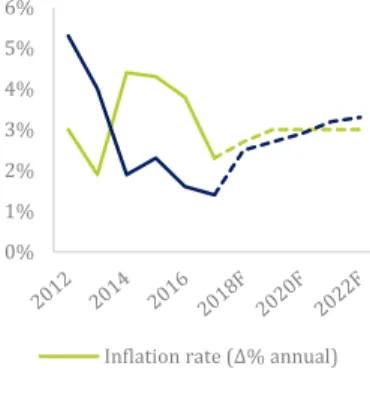
REN operates in a mature market so investment opportunities are becoming scarcer. To cope with the resulting decrease in RAB, REN must look out for opportunities for growth abroad. The recent Electrogas acquisition came as an opportunity due to an asset sale by the Italian company ENEL, but highlights the abovementioned need. The fact that this asset is not regulated further opens an opportunity for REN to diversify its sources of revenues in one of the most developed economies in LATAM, Chile, in which GDP per capita is expected to grow at +3.02% over the next 4 years (Figure 17).
The supply of natural gas is protected by long-term contracts with take-or-pay provisions, providing extra security. Penetration rates in Santiago are expected to grow from 20% to 40% in the next 10-15 years, reflecting expectations that consumption of gas will double as the preferred source for heat over other substitutes, such as coal.
The acquisition did not have material impact on REN’s credit rating or dividend policy because it was financed using credit lines available within the group coupled with Chile’s current low-risk investment grade rating. REN is sensing the opportunity to increase its stake in Electrogas, given the attractive low levels of debt. However, the short run plan is to digest this acquisition and only advance in activist policies if it becomes relevant to REN’s credit rating or dividend policy.
Initial Projects in Gas Distribution
As the sole NG distribution operator in Portugal, REN was in a unique position to gain vertical integration in NG infrastructure. Keeping the focus in Portugal, in a low-risk way, the company acquired the entire share capital of EDP Gas, subsequently renamed REN Portgás. We predict a +3.07% CAGR growth potential in FCF in the next 5 years, based on Portgás’ low penetration rate when compared with Lisboagás, the other main distributor in a high population density area. REN paid €532M although the Portgás RAB was around €450M 2016YE. The premium was paid due to Portgás’s growth potential and because REN expects a 30 bps higher return than the WACC for NG transmission.
Funding of the acquisition was secured by a €250M capital increase through a rights issue and was followed by a debt issuance of €300M (1.768% yield). Instead of reducing the DPS, they opted for a capital increase so that they could expand free float and increase the market liquidity for REN’s shares (Appendix 21). REN is expert in managing regulated gas assets, knows the technology, the market, and all the business complexity it involves; thus, the acquisition entails low integration risk.
Although REN does not have an aggressive internationalization plan in place, it will remain opportunistic with foreign investments, and we believe that expansion in LATAM is inevitable for REN to grow and to diversify its portfolio.
5. Investment Summary
We issue a BUY recommendation on REN with a target price of €2.76/sh for 2018YE using a FCFF method with an upside potential of 15% with low-risk. The recent drop in price in line with the entire global stock market, the capital dilution, the debt restructuring, cash generating operations in Portugal, the potential to grow in LATAM, and a strong dividend policy opens room for an increase in the share price, thus justifying our recommendation.
Key Value Drivers and Potential Catalysts
The recent restructuring of debt plays a pivotal role in REN’s outlook when yields start rising. RoR is based on a theoretical WACC set up by ERSE, estimated between 5.25% and 5.92% for REN’s segments in 2018F, while WACC is estimated at 3.83% driven by a 1.54% after-tax cost of debt and high leverage. REN’s timing to extend debt maturities and to move from floating rates to fixed rates benefited from decreasing yields for Portugal and from its investment grade rating (BBB- with a positive outlook). The latest 1.768% yield on a €300M bond issuance is an example. The hedging of the cost of debt with about 63% debt financed at fixed rates in 2018F mitigates the effects of an expected increase in yields. A +100bps in yields in 2018F affects RoR by +40bps and the cost of debt by +37bps as result of this policy (Table 5).
The acquisition of Electrogas was the first foot in LATAM. The premium paid for a non-controlling stake of 42.5% signals the aim for international diversification. This subsidiary accounts for €0.20/sh of REN, incorporating the 2017 capital increase and debt issuance. Chile’s expected GDP growth is at +3.02% CAGR for 2017F-23F and penetration rates in Santiago are expected to increase from 20% to 40% in the next 10-15 years, meaning that expansion of the grid is critical to accommodate a doubling in consumption. The perspective of a controlling stake in this company will boost returns, given the room for capital structure optimization and high cash flow visibility supported by long-term take or pay contracts for the supply of NG in the country. We take a conservative approach, taking into consideration the limited growth in Portugal and a 2.5% CAGR in Electrogas. Any growth in LATAM will drive an upside on REN’s valuation.
The strong cash flow generation of the company through solid operations in the country will boost the cash surplus to about €433M in 2023F (Appendix 3). Also, the expected end of ESEC in 2019F will have several side effects. This will deleverage the firm given the limited investment opportunities within Portugal, allow for the increase of the €113M cash dividend by 2.5% YoY from 2020F-23F, and will generate a better buffer to explore opportunities abroad.
REN’s operations in Portugal will remain solid, as the firm operates a natural monopoly in the transmission
of Electricity and NG, and along with the recent acquisition of REN PORTGAS will provide room for a +320bps in operating margins from 2016-2023F and the entrance in the distribution segment of NG (Appendix 4). The distribution grid in the North of Portugal covers about 21.7% of the mainland, is expected to contribute €451.6M to RAB in 2017F and offers potential to grow given expectations for an increase to 35%-40% in the Figure 17: Real GDP Growth vs Inflation
rate in Chile
Source: IMF
Figure 18: Porter’s Five Forces
Source: Team estimates
Figure 19: REN vs Peers Efficiency 16YE
Source: Team estimates
Table 5: REN’s Sensibility to Yields
Source: Team estimates
0% 1% 2% 3% 4% 5% 6%
Inflation rate (Δ% annual) Real GDP growth (Δ% annual)
0 1 2 3 4 Threat of new entrants Threat of subsittutes Bargaining Power of Supliers Bargaining Power of Buyers Competition within the Industry Natural Gas Electricity 10.5 52.0 33.3 43.6 O P E X / K M L I NE O P E R A T I N G M A R G IN REN Average Peers
2018F 2023F
Δ% in RoR 0.40% 0.40%
Δ% in Cost of Debt 0.37% 0.63%
% Gain/Loss 0.03% -0.23%
7
penetration rate. The distribution is remunerated at +30bps versus the transmission of NG, following the same regulatory scheme (Appendix 9).
REN has a current 6.9% dividend yield, the highest between selected peers, stable operations and investment-grade credit rating, placing the stock as a possible bond proxy. Investors go long in this stock looking to receive a very stable stream of cash flows over time with limited risk. This clientele effect is supported by our €2.53/sh fair value estimation using the dividend discount model (DDM).
Valuation methods
To compute REN´s target price we derive the Enterprise Value of each segment (Electricity, NG transmission, NG distribution and Others) through FCFF and use the DDM to value Chilean operations, using a SoP approach. As complementary methods we used FCFE, arriving at a €2.77/sh, the DDM, yielding €2.53/sh, and a multiples valuation through EV/EBITDA, P/E, and P/D multiples that are in line with our base 2018YE valuation of €2.76/Sh.
Risks to Achieve Price Target
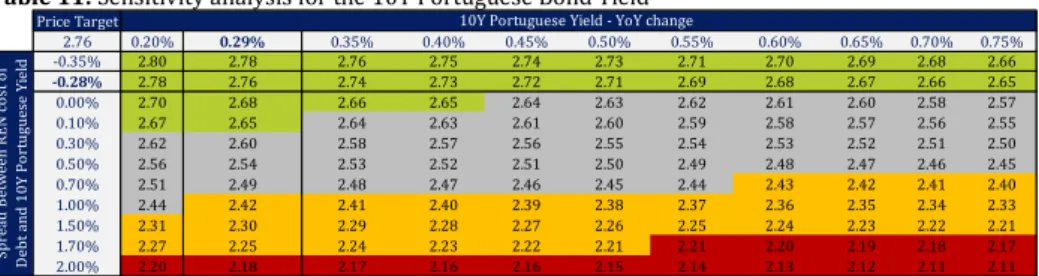
Investors should be aware of the impact that 10 Y Portuguese yields have on results. Decreases in RAB due to a lower investment will impact REN’s ability to grow revenues. ESEC remains a big concern. Despite expectations about its end by 2019, a continuation of the levy will impact REN’s capacity to sustain increases in dividends, leading to unsustainable payout ratios, around 90%. A Liquidation valuation after the end of the concessions accounts for a drop of €-0.27/sh, changing the target price for REN to €2.49/sh, still modestly above the current price.
6. Valuation
SoP: FCFF for the Core
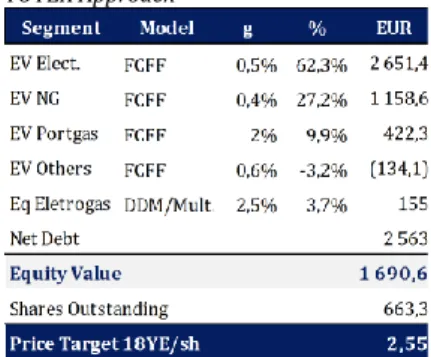
REN’s core business is valued using a FCFF model to derive the EV of each operational segment (Electricity, NG transportation, NG distribution, and Others) along with the DDM and a price multiple to value the current 42.5% stake in Electrogas. This approach yields a 2018YE price target of €2.76/sh (Appendix 22). Complementary approaches for the entire company using a FCFE model, the DDM, and a multiples approach support the BUY recommendation. The upside potential of 15% and the low risk makes REN an attractive stock for investors targeting a current dividend yield of around 7.0% in a BBB-rated and very stable company. The valuation follows a going concern, but a liquidation approach on the maturity of each concession accounts for €-0.27/sh to €2.49/sh, still supporting the positive outlook for REN (Appendix 24). Our valuation is mainly influenced by the following factors:
Portuguese 10Y Yields Drive Revenues
The expectation of a normalization in yields after the end of ECB’s QE and the recent figures in the US points for increases in yields across Europe, reflecting the improvement of economic indicators. The outlook for yields and REN’s RoR are estimated through the computation of forward rates starting in 5 years for a 10-year period (Appendix 9). REN’s cost of debt parallels our expectations for yields, as we are assuming a -28bps spread, which corresponds to the rates difference between REN’s and the Portuguese government’s most recent bond issues, except for the hedged part of the debt of about 63%. This represents a large source of the upside in price target.
Regulated Asset Base (RAB)
REN’s RAB has been showing a progressively decreasing trend since 2014, however, this was disguised by two recent acquisitions. RAB increased by €70.5M following the acquisition of the GALP NG caverns in 2015, and by €451.6M with the purchase of EDP Portgás in 2017. With all of mainland Portugal electrified there is little room for REN to grow within the country in the electricity segment. Supported by both PDIRT-E (Plano Desenvolvimento e Investimento da Rede de Transporte de Eletricidade) and PDIRGN (Plano de Desenvolvimento e Investimento da Rede de Gás Natural) a decrease in RAB is expected because depreciations will surpass CAPEX. Estimations of changes in RAB are subject to adjustments by ERSE on embedded efficiency incentives. From 2016 onwards, we take a conservative approach. REN’s CAPEX is assumed to be transferred to RAB, implying the end of subsidies for new investments in both electricity and NG segments. In electricity the investment made with a cost lower than the reference cost will be remunerated at a higher rate (Appendix 25). CAPEX is expected to be paid at a premium in electricity. The third connection of NG with Spain is expected to add €58M CAPEX starting in 2020 (Appendix 10).
Incentives to Economic Rationalization
Regarding electricity, the company is provided with a remuneration on fully amortized assets that are kept in operation. Our assumptions follow what is stated in “Proveitos Permitidos e Ajustamentos para 2017 das empresas reguladas do sector Eléctrico”: €21.9M for 2017F and €25.0M/year for 2018F-19F. For the following years we forecast a +8.0% YoY growth for 2020F and +9.0% YoY from then onwards, since we expect that this incentive will increase in the future driven by: 1) an enlargement of fully amortized asset base, and 2) the ceaseless objective of ERSE to protect consumers from unneeded investments.
Recovery of OPEX
REN is provided with a mechanism that allows the recovery of its operational expenditures related with the transmission of electricity and NG and the distribution of NG. Given the complexity of computation of this remuneration, we consider that the recovery of OPEX will evolve YoY based on the Portuguese GDP Deflator minus an efficiency factor set by ERSE for each segment. OPEX is estimated to evolve at -1.03% CAGR 2018F-2023F. REN has been able to recover more than its OPEX, proving efficiency in its operations (Figure 6 &Figure 7).
Energy Sector Extraordinary Contribution (ESEC): A Turnaround
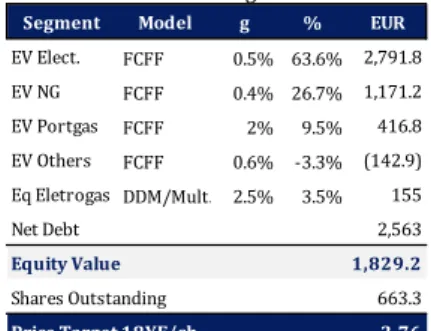
We project that this extraordinary levy will end in 2019, by the end of the legislature. All companies in the sector except REN and ENDESA have already decided to forego the contribution, and have instead sued the Portuguese State on the Constitutional Court. Forecasts are that this levy will not hold in the future, following expectations by subject companies. Nevertheless, the recovery of ESEC paid until 2019F is not accounted for in Table 6: REN’s Price Target
Source: Team estimates
Table 7: REN’s WACC
Source: Team estimates
Figure 20: REN vs Peers Multiples
Source: Bloomberg & Team estimates
Table 8: Peers’ Group
Source: Team estimates & Bloomberg
Segment Model g % EUR
EV Elect. FCFF 0.5% 63.6% 2,791.8 EV NG FCFF 0.4% 26.7% 1,171.2 EV Portgas FCFF 2% 9.5% 416.8 EV Others FCFF 0.6% -3.3% (142.9) Eq Eletrogas DDM/Mult. 2.5% 3.5% 155 Net Debt 2,563 Equity Value 1,829.2 Shares Outstanding 663.3
Price Target 18YE/sh 2.76
DCF Analysis 2018F Terminal
COST OF EQUITY
Risk Free Rate (RFR) 0,7% 2,5%
Country Risk Premium (CRP) 1,4% 2,2%
Beta (β) 0,6 0,6
Equity Risk Premium (ERP) 8,5% 8,5%
Cost of equity 7,2% 9,8% COST OF DEBT
Cost of debt 2,2% 3,6%
Marginal tax rate 30,8% 30,8%
After-tax cost of debt 1,5% 2,5%
Weight of equity 40,3% 40,0% Weight of debt 59,7% 60,0% WACC 3,8% 5,4% 10,79 13,63 18,37 8,94 12,74 14,68 E V / E B I T D A P / E P / D Peers REN
Peers Operating Margin
(2016YE) Mkt Cap (€B) SNAM 57.77 12.51 ELIA 27.33 2.88 TERNA 50.82 9.03 ENAGAS 50.32 4.86 NATIONAL GRID 24.41 25.50 REE 50.68 8.78 REN 52.01 1.62
8
the base case valuation. A positive decision by the Court may add up to €0.13/sh to REN’s price target, including interest.
FCFE and DDM
These complementary approaches are useful in valuing company. In the case of FCFE, it is supported by the stable capital structure the company has maintained and is expected to maintain. The use of the DDM is justified with the stable dividend payment of the company. Also, the €2.53/sh derived by the DDM supports the clientele effect, meaning that investors look to the stock not in a controlling perspective or with the aim of realizing capital gains, but to receive a stable stream of cash flows with low-risk. We are assuming an increase of +2.5% YoY starting on 2020 following the end of ESEC (Appendix 23).
WACC Assumptions
Applying the CAPM model, we are assuming a Cost of Equity that ranges from 7.1% to 8.0% in the forecasted period. We are using the 10Y German yield annual forecasted average as the RFR, ranging from 0.66% in 2018
and 1.45% in 2023. We are adding to the model an average CRP of 2.0%, equalling the spread between the
RFR and a 2-year average of forecasts for the 10Y Portuguese bond yield. The Beta is around 0.6, which was derived using a pure-play method from peer average betas. That value was supported by regressing REN’s returns against the PSI20, Euronext 150 and EUROSTOXX600 returns. The ERP is 8.5% and comes from the relation between the REN and the PSI20, given the company’s almost 100% exposure to Portugal, and takes into consideration our forecast for the future volatility of the index (Appendix 20).
Cost of Debt is linked with the assumptions for the 10Y Portuguese yield with a spread of -29bps. It will be
inside the 2.23%-2.76% range, which is much lower than just 29bps from 10Y yields due the 65% fix rate debt cost of financing (Appendix 19). As such, and considering the relatively stable market capital structure around 60% D/EV, WACC will range from 3.8% in 2018 to 4.8% in 2023.
Proper Peer
Valuation multiples are used as a complementary approach. We employ the Sum of Absolute Rank Differences (SARD) approach developed by Knudsen et al. (2017) as a basis for the search for the proper peer group, as REN is the sole TSO in Portugal. The Euro Stoxx 800, FTSE 100, and the S&P Latin America 40 constituents supplied the potential peer group. Once the SARD was calculated for each company, a subjective decision was made to exclude companies based on unrelated industry classifications. The resulting peer group has an average D/D+E ratio (based on book values) of 66.1%, in line with the 68.6% of REN. Also, average operating margins of 52.4% are in line with the 52% of REN, excluding National Grid and ELIA (Appendix 17).
Multiple Valuation
As a stable, regulated utility, the standard multiples are suitable for REN’s valuation, and in this regard the EV/EBITDA, P/E, and P/D ratios were used for the analysis. The final metric, the P/D ratio, is not often used but is indeed just an inversion of the dividend yield, a significant factor in the value proposition of investing in utility shares. The company appears undervalued based on its EV/EBITDA (8.94x), P/E (12.74x) and P/Dividend (14.68x) multiples (Figure 20). These multiples are at discount when compared with the peer medians of 10.79x, 13.63x and 18.37x, respectively. However, adjusted multiples to account for historical discounts do not deviate our recommendation (Appendix 18). REN’s historical lower market cap and liquidity and country risk are potential drivers of these historical discounts.
EV/EBITDA and P/D support the upside potential, generating values of €2.62/sh (+7.59%) and €2.81/sh (+16.13%), respectively, while P/E points to a potential downside of €2.06/sh (-17.23%). However, we believe that P/E could be the most biased of these multiples, given the varying countries of domicile and capital structures (Figure 21) amongst peers. Figure 22 shows a heatmap of all possible valuations resulting from relative weight combinations of the three multiples.
7. Financial Analysis
Operations Set on Cruise Control
REN’s operations are bounded by strict regulation reflected in the stability of its operating margins (+35.40% in 2016 with an average YoY growth of +46bps until 2023F). This improvement is explained by the €400M RAB increase in 2017F. REN benefited from the inclusion of REN PORTGAS (€451.6M) and from an expected growing trend for RoR (5.35% in 2018F to 5.97% in 2023F), explained by estimates for the increase in 10Y Portuguese Yields (2.08% to 3.52% from 2018F-23F)- Appendix 9 & Appendix 19.
Focus on Operational Efficiency
The company is expected to maintain the pace of recovering OPEX in its operating segments during 2017F-23F (c.120%) (Figure 23). This reflects compliance with the regulatory mechanism of ERSE, although REN does not benefit from being more efficient than the regulator demands. ERSE will adjust efficiency parameters as long as the company proves to enhance efficiency, shrinking the room for accumulated efficiency gains. The limitation in terms of efficiency gains is reflected in 0.11 asset turnover stable from 2012-23F.
Prudent and Strategical Debt Management
The increase in maturities and the change from floating to fixed rates allowed the company to consistently decrease the cost of debt from 5.70% in 2012 to 3.20% in 2016. In 2017F around 56% of total debt is expected to be financed at fixed rates powering a total cost of 2.70%. Fixing rates accounts for €0.40/sh in our valuation when comparing with a scenario of debt entirely at floating rates. REN is prepared for the expected and generalized increase in yields. The difference between RoR and cost of debt is expected to increase in 2018F-22F, from +312 bps to +340bps, leading to a better ICR (from 3.94 to 4.18). This spread will decrease to +308 bps in 2023F (Figure 24). The Debt-to-Capital ratio will decrease slightly from 0.66 to 0.6 (2017F-23F), reflecting REN’s smooth deleveraging given limited investments perspectives. NPM will jump from 17.06% 2016 to 22.22% 2023F, excluding ESEC effects. ROE will stabilize at around 10% in 2018F-2023F driven by a low-interest burden.
Figure 21: Debt/Equity Ratios
Source: Bloomberg
Figure 22: Multiples Valuation Heat Map
Source: Team estimates
Figure 23: OPEX Efficiency
Source: Team estimates
Figure 24: Hedging Strategy Results
Source: Team estimates
Figure 25: REN WACC vs RoR
Source: Team estimates
0 50 100 150 200 250 300 SR G IM ELI BB T R N IM EN G S Q N G/ LN R EE S Q R EN 100% 110% 120% 130% 140% 0 20 40 60 80 100 120 Total OPEX
Total Revenue of OPEX Revenue of OPEX/OPEX 0% 1% 2% 3% 4% 0 1 2 3 4 5
Interest Coverage Ratio (lhs) RoR-Cost of Debt Spread (rhs)
0% 2% 4% 6% 8% RoR WACC