Master of Science in Viticulture & Enology
Joint diploma “EuroMaster Vinifera” awarded by:INSTITUT NATIONAL D'ETUDES SUPERIEURES AGRONOMIQUES DE MONTPELLIER AND
INSTITUTO SUPERIOR DE AGRONOMIA DA UNIVERSIDADE DE LISBOA
Master thesis
Effects of must turbidity on fermentative aroma development in
Sauvignon blanc
Lukas Karl Herrmann
2014-2016 (P8)
Supervisor : Claire GROSE, Plant and Food Research, Blenheim, New Zealand
Supervisor : Jorge M. RICARDO DA SILVA, Instituto superior d agronomia, Lisbon, Portugal
Jury:
President: Carlos Manuel Antunes Lopes (Phd), Associated Professor at Instituto Superior de Agronomia, Universidade de Lisboa.
Members: Doris Rauhut (Phd) Professor at Geisenheim University;
Jorge Manuel Rodrigues Ricardo da Silva (Phd), Full Professor, at Instituto Superior de Agronomia, Universidade de Lisboa, supervisor;
Sofia Cristina Gomes Catarino (Phd), Invited Assistant Professor at InstitutoSuperior de Agronomia, Universidade de Lisboa.
I
Statement of originality:
This document is written by student Lukas Herrmann who declares to take full responsibility for the contents of this document.
I hereby declare that the text and the work presented in this document is original and that no sources other than those mentioned in the text and its references have been used in
creating it.
ISA, Lisbon, Portugal and Plant and Food Research, Blenheim, New Zealand are responsible solely for the supervision of completion of the work, not for the contents.
………... ……… Heidelberg, Lukas Herrmann
II
Dedicated to my parents Elisabeth Märkle-Herrmann and Dieter Herrmann. Thank you for all the support along the way.
III
Acknowledgement:
This thesis only became reality with the help of the whole Plant and Food research team.
My special thanks go to Claire Grose, my supervisor during my stay in New Zealand, thanks for guidance, patience and empathy.
Cherryl Fitzgerald for outstanding communication, which gave me confidence from the very beginning.
Mark Greven, Jeff Bennett and Andrew Lachlan for their constant help with statistical issues.
Damian Martin for his influential knowledge and expertise.
Abby Albright and the whole laboratory team.
My supervisor Jorge M. Riccardo da Silva from Instituto Superior d Agronomia, Lisbon for its guidance.
IV
1.0 Index:
1.1
Table of content:
Acknowledgement: ... III 1.0 Index: ... IV 1.2 Table of Figures: ... VI 1.3 Table of tables: ... VII 1.4 Table of equations: ... VII 1.5 List of abbreviations: ... VII2.0 Introduction: ... 1
3.0 Bibliographic review: ... 2
3.1 Pyrazines: ... 3
3.2 Thiols: ... 4
3.3 Turbidity: ... 9
3.4 Sterols and fatty acids: ... 12
3.5 Inoculation rates: ... 16
3.6 Goals of this work: ... 18
4.0 Materials and methods: ... 19
4.1 Inoculation trial: ... 19 4.1.1 Initial juice:... 19 4.1.2 Juice turbidity ... 19 4.1.3 Yeast nutrition: ... 19 4.1.4 Glutathione addition: ... 20 4.1.5 Repetitions: ... 20 4.2 Turbidity trial: ... 21 4.2.1 Initial juice:... 21 4.2.2 Juice turbidity: ... 22 4.2.3 Yeast nutrition: ... 24 4.3 General procedure: ... 24 4.3.1 Bentonite: ... 24 4.3.2 Yeast inoculation: ... 24
4.3.4 Yeast cell count: ... 25
4.3.5 Total soluble solids and temperature measurements: ... 25
4.3.6 FTIR spectroscopy: ... 26
4.3.7 Ethanol: ... 26
4.3.8 Glucose and Fructose: ... 26
4.3.9 Yeast available nitrogen (YAN): ... 26
V
4.3.11 Organic acids: ... 27
4.3.12 Brix, titrable acidity and pH: ... 27
4.3.13 Thiol analysis method: ... 27
4.4 Statistics: ... 28
5.0 Results and Discussion: ... 29
5.1 Inoculation trial: ... 29 5.1.1 Fermentation kinetics: ... 29 5.1.2 General results: ... 34 5.1.3 Thiol analysis: ... 47 5.2 Turbidity trial: ... 49 5.2.1 Fermentation kinetics: ... 49 5.2.2 General results: ... 56 5.2.3 Thiol analysis: ... 64 6.0 Conclusion: ... 69 7.0 Recommendations for PFR: ... 72 8.0 References: ... 74 9.0 Attachments: ... 92
VI
1.2 Table of Figures:
Figure 1: Structural formulas of the three most common Methoxypyrazines. ... 3
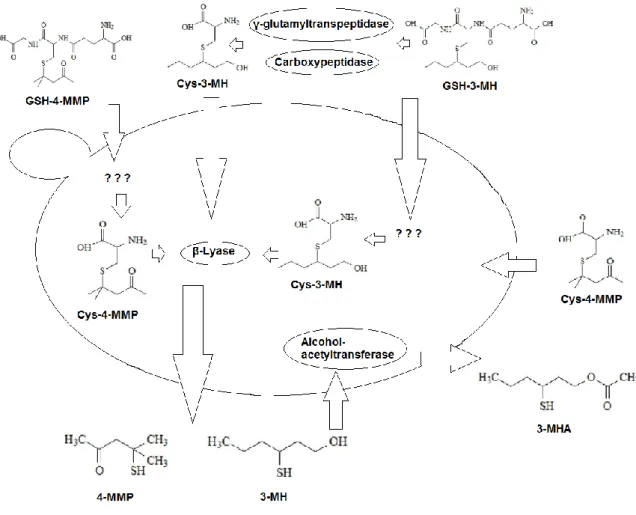
Figure 2: Genesis of the three most common thiols, from their non-odorous precursors by yeast interaction during fermentation. ... 5
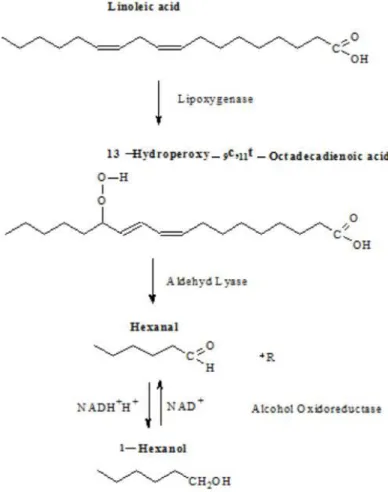
Figure 3: Genesis of hexanol due to oxidation of Linoleic acid. ... 15
Figure 4: Genesis of hexanol due to oxidation of Linolenic acid. ... 16
Figure 5. Different amounts of sediments as found after turbidity adjustment ... 22
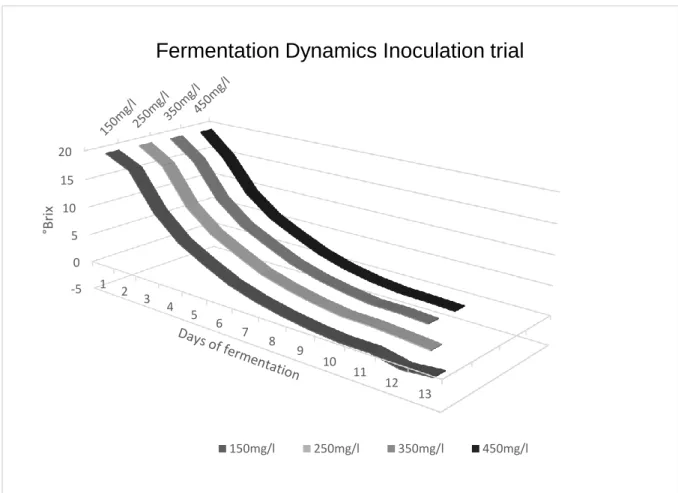
Figure 6. Fermentation dynamics for different inoculation levels ... 29
Figure 7. Logistic curve for all four inoculation levels ... 31
Figure 8. Fermentation temperatures as recorded during the inoculation trial. ... 31
Figure 9 Interactions for pH values within the inoculation trial ... 34
Figure 10 Interactions for titratable acidity within the inoculation trial ... 35
Figure 11 Interactions for malic acid trendlines within the inoculation trial ... 37
Figure 12 Interactions for alcohol corrected within the inoculation trial ... 38
Figure 13 Interactions for tartaric acid within the inoculation trial ... 39
Figure 14 Interactions for acetic acid within the inoculation trial ... 43
Figure 15 Interactions for succininic acid within the inoculation trial ... 44
Figure 16 Interactions for reducing sugar within the inoculation trial ... 46
Figure 17. Mean fermentation dynamics as monitored during the turbidity trial ... 50
Figure 18. Fermentation temperatures as recorded during the turbidity trial. ... 51
Figure 19. Correlation between initial YAN levels and fermentation time within the turbidity trial. ... 56
Figure 20. Correlations between initial YAN levels and Polyphenols within the turbidity trial. ... 61
Figure 21 Different expressions of 3MHA between the vineyards of the turbidity trial. ... 66
Figure 22 . Correlations between initial YAN levels and 3MHA within the turbidity trial. ... 67
VII
1.3 Table of tables:
Table 1 Initial YAN values ... 20
Table 2 Juice Turbidity ... 22
Table 3 NTU levels after adjustment ... 23
Table 4 Initial nitrogen status ... 24
Table 5 Fermentation times ... 30
Table 6 Table of means - inoculation trial. ... 33
Table 7 Thiol analysis ... 47
Table 8 Juice analysis ... 49
Table 9 Fermentation times ... 51
Table 10 Organic acid analysis ... 53
Table 11 Table of means - turbidity trial ... 55
Table 12 Nitrogen composition ... 57
Table 13 Thiol analysis ... 64
1.4 Table of equations:
Equation 1: Shows the equation, applied to calculate yeast cells/ml. ... 25Equation 2: A calculative estimation of Nitrogen (N) sources ... 58
VIII
3MH 3-Mercaptohexan-1-ol
3MHA 3-Mercaptohexyl acetate
4MMP 4-Mercapto-4-methylpentan-2-one C Carbon °C Degree Celsius CoA Coenzyme A SBMP 3-sec-butyl-2-methoxypyrazine CO2 Carbon dioxide
DAP Diammonium Phosphate
FTIR Fourier transform infrared
FS Free Sulphur
g Gram
GAE Gallic acid equivalents
GCL Gifford’s Creek Lane
h Hour
hl Hectoliter
HPLC High-performance liquid chromatography
kg Kilogram
H2S Hydrogen sulphide
H2O2 Hydrogen Peroxide
H2SO4 Sulfuric acid
IBMP 3-isobutyl-2- methoxypyrazine
IPMP 3-isopropyl-2-methoxypyrazine l Litre mg Miligram min Minutes ml Mililitre mm Milimetre MP Methoxypyrazine N Nitrogen
NAD(P)H Nicotinamide adenine dinucleotide phosphate
IX
NCR Nitrogen Catabolite Repression
ng Nanogram
nm Nanometre
NOPA Nitrogen by o-phthaldialdehyde assay
NTU Nephelometric Turbidity Unit
NZD New Zealand Dollar
OB Omaka Block
PFR Plant & Food Research
ppm Parts per million
PUFA Poly-unsaturated fatty acid
rpm Rounds per minute
S Sulphur
SF Superfood
SFA Saturated fatty acids
SO2 Sulphur dioxide
t Ton
TA Titratable acidity
TCA Tricarboxylic acid cycle
TB Tuamarina Block
UFA Unsaturated fatty acid
V Volume
wt.% Weight percent
YAN Yeast assimilable nitrogen
μg Mikrogram
1
2.0 Introduction:
In many ways New Zealand has become an ideal for a New World wine country. With the first commercial Sauvignon blanc only released in 1974, Sauvignon blanc fought its way to become not only the flagship of New Zealand`s wine industry, holding around 66 % of the country’s total grape production at the 2015 harvest, but also made its way to be recognized for its outstanding quality all over the world. For some critics, New Zealand Sauvignon blanc is arguably the best in the world and others called the Marlborough wine region the best place to grow Sauvignon blanc in New Zealand. Even though testimonies like that may be subjective as taste lies on the tongue of the beholder, New Zealand Sauvignon blanc clearly came a way plastered with success leading to an export value of $1.424 billion NZD in 2015. Key to this success is that the industry found a way to distance itself from its French archetype, world famous Sauvignon blanc originated from the Loire valley, and reinvented itself, introducing a unique winestyle that does not need to shy any comparison. In the heart of this winestyle aroma compounds of the thiol group play an important role. Derived during yeast activity during fermentation from non-odorous precursors found in grapejuice, the two most important thiols that have been related with Marlborough Sauvignon blanc are 3MH and 3MHA. These deliver exotic nuances reminiscent of grapefruit, passionfruit, gooseberry, guava and boxtree. Due to the high oxidability of thiols, several strategies have been adapted by the industry to preserve these key compounds and their non-odorous precursors during the processing of grapes, which includes harvesting, transportation, processing and storage. Although a lot of research has been carried out to further understand the relations between precursors, thiols and their preserving, and to be able to continuously contrast New Zealand Sauvignon blanc from competitors, many questions still remain unclear at the present day. One of them is the effect of juice turbidity on aroma development during fermentation. Research has revealed a broad idea on the positive and negative effects, caused by micronutrients and physical parameters of grape solids derived during process steps leading to juice extraction from the berries on fermentation kinetics and general aroma development. To my best knowledge no research has been published to the present day that focuses on the effect of juice turbidity on the thiol development and expression in Sauvignon blanc ferments. This masterthesis in hand, with the title “Effects of must turbidity on fermentative aroma development in Sauvignon blanc” is supposed to give an overview over the state of research on Sauvignon blanc with a further focus on the question about possible effects and practical applications of juice turbidity. Finally, this work tries to improve the small scale winemaking protocol of Plant and Food Research, Blenheim, where this research has been conducted.
2
3.0 Bibliographic review:
In 2015 the productive viticultural area of New Zealand was 35000 ha. Although harvest was rather small compared to the 2014 vintage, that led to a total yield of 326,000 tons, export rates were growing during the last years, finally reaching 209 million litres and a record of $1.42 billion in sales. Wine thereby became New Zealand’s 6th biggest export good. The most rewarded variety of the country is Sauvignon blanc, reaching a total amount of 66 % of all grapes produced in 2015. 80 % of Sauvignon blanc vines are planted in The Marlborough region, which is known for its big amount of sunshine and cool nights, which preserve acidity and flavours (New Zealand winegrowers, 2015). Typical vegetal and bell pepper flavours which add up to tropical nuances like passion fruit and grapefruit characterize the wines from New Zealand and separate them from wines coming from other origins (Lacey et al., 1991) The aroma of Sauvignon blanc wines can be generally separated into two groups. One of them, the methoxypyrazines (further referred to as pyrazines) are responsible for the so called “green” aromas. They are generally described as grassy, herbaceous, asparagus, green pepper, capsicum or tomato leaf (Allen et al.,1991; Marais, 1994). Thiols on the other hand bring “yellow”, tropical aromas of gooseberry, grapefruit and passionfruit. Composition of these aromas and especially the impression of the final wines are highly connected to the country they come from and even to regions inside the country. Marlborough Sauvignon blanc with its aromas of sweet, sweaty, passion fruit and capsicum characteristics stands out, when compared to other regions in New Zealand. Hawkes bay wines are known for flinty characteristics and Wairapara, known for cat urine and boxwood characteristics (Lund et al., 2005). Lund et al., (2009) showed that Marlborough Sauvignon blanc shows the highest analytical rates of MP and thiols (3MH and 3MHA), when compared to wines, coming from France, South Africa and Australia. Australia Sauvignon blanc are known to have apple, and lolly characteristics while South African and French wines show general notes of minerals, flintstone and bourbon.
Research also showed that the Marlborough style is preferred by New Zealand consumers and is a recognized style all over the world. Although other compounds add to the flavour profile like esters, C6 compounds and fusel alcohols, not all contributors to Sauvignon aroma are known now (Aznar et al., 2003). As consumers, especially more knowledgeable tend to prefer wines coming from specific regional origins, it is very important to increase knowledge about regional differences and find ways to ensure the presence of these parameters for the future. Investment in research programs by the industry, to improve and ensure product quality are known to have a positive impact on price points accepted by customers (Schamel et al., 2006).
3 3.1 Pyrazines:
Pyrazines are nitroginated ring structures produced as a secondary product of amino acid catabolism in grapes and therefore directly derived (Allen et al., 1991). They are found in stems, grapeskin and seeds, of which the stems contain the highest amount (Roujou de Boubee et al., 2002). Taking a closer look on the grape parts used during white wine vinification, they are located to 67 % in the grapeskins (Ribereau-Gayon et al., 2006). The three MP most common in wine are; 3-isopropyl-2-methoxypyrazine, IPMP, 3-isobutyl-2- Methoxypyrazine, IBMP, and 3-sec-butyl-2-methoxypyrazine, SBMP (Murray & Withfield, 1975).
The main compound contributing to the aroma profile of Sauvignon blanc wines is 2-Methoxy-3-(2-methylpropyl) pyrazine also known as 2-methoxy-3-isobutylpyrazine or 2-isobutyl-3-methoxypyrazine, IBMP (Ribereau-Gayon et al., 2006). It was first detected in Sauvignon blanc wines in 1982 (Augusty et al., 1982). IBMP is detectable at concentrations as low as 2 ng/l but in wines its concentration varies between 12 ng/l and 26 ng/l (Allen et al., 1991). Research of Lacey et al., (1991) detected ranges between 0.6 ng/l and 38 ng/l in wines coming from different origin. IBMP is recognized to bring a greenish, bell pepper aroma, while at lower concentrations, it may only be recognized as a more general vegetal aroma or flavour. Other MP reach much lower values in the final wines. IPMP was reported to be found up to 4.5 ng/l in wines derived from Cabernet Sauvignon and SBMP up to 11.2 ng/l (Sala et al., 2005). It was also suggested, that at higher concentrations, MP may mask other fruity aroma compounds (Chapman et al., 2004).
IBMP was shown to be photodegradable (Heymann et al., 1986) and affected by growing temperature (Lacey et al., 1991). This leads to the conclusion, that viticultural practises affecting canopy architecture and fruit zone microclimate highly affect MP. In fact, higher IBMP levels have to be expected from shaded microclimates. Also higher IBMP concentrations have to be expected from grapes coming from cooler growing regions or years with lower average temperature (Lacey et al., 1991)
4
MP are known to highly decline with ripening. 96 % loss of the initial IBMP concentration was detected at harvest at maturity stage (Lacey et al., 1991). Similar results were observed by Sala et al., (2005) in Cabernet Sauvignon wines where IBMP concentrations decreased up to 90 % from veraison to harvest. This study revealed similar behaviour other MP, showing a decrease of 94 % for IPMP and 43 % of SBMP.
Research on Cabernet Sauvignon grapes showed, that an increase in yield would decrease IBMP concentrations in the pressed juices. Therefore, pyrazine concentrations correlate like sugars and anthocyanins inverse with crop yields. Also the intensity ratings of bell pepper aroma, vegetative aroma, and vegetative flavour by mouth were all positively correlated with the IBMP concentration in wines (Chapman et al., 2004).
Sala et al., (2005) showed that MP are correlated with planting density. Denser planted vineyards showed higher amounts of MP. Further the effect of irrigation was studied and irrigated vineyards showed to have higher MP levels.
IBMP was less affected by the amount of pressure applied during commercial grape pressing but increased by skin contact (Magu et al., 2007). These results disagree with the findings of Roujou de Boubee et al., (2002) who found that press wines had higher MP levels, which is a more obvious result, as MP are located to higher amounts in the skin than in the berries flesh. Kotseridis et al., (2008) showed in a trial with different turbidity levels between 25 and 1280 NTU, that 3-isopropyl-2-methoxypyrazine (IPMP) levels correlate with the amount of turbidity left in a juice before fermentation. The amount of IPMP was positively correlated with the time, juice was prefermentative allowed to settle. The usage of bentonite further increased the effect of settling. This research showed also, that the amount of (IPMP) increased in all turbidity levels during fermentation, which was suggested to be a result of grape solid degradation during fermentation. Roujou de Boubée et al., (2002) already showed that Sauvignon blanc juice clarified to 200 NTU lost half of its IMBP amount compared to an untreated version.
3.2 Thiols:
Sauvignon blanc belongs to the so called "simple flavoured" varieties. This means that musts arising from this variety show no or barely any traces of the typical aromatic characteristics of the grape (Peynaud E. 1980). Higher odours only develop during fermentation (Tominaga et al., 1998). The aromatic compounds responsible for that are volatile thiols with additional functional groups as ketones, alcohols and esters (Coetzee & du Toit, 2012). Among the many thiols found, three volatiles thiols have been identified to have a major influence in the typical aroma of Sauvignon blanc: 4-Mercapto-4-methylpentan-2-one, 4MMP (Darriet et al., 1995), 3-Mercaptohexan-1-ol, 3MH (Tominaga et al., 1998) and 3-Mercaptohexyl acetate, 3MHA (Tominaga et al., 1996).
5
Figure 2: Genesis of the three most common thiols, from their non-odorous precursors by yeast interaction during fermentation.
4MMP gives a smell of box tree, passion fruit, broom, black current, citrus zest and grapefruit, but can also give hints of cat urine, if present in higher amounts (Darriet et al.,1995; Dubordieu et al., 2006). 3MH brings odours of passion fruit, grapefruit, gooseberry and guava (Tominaga et al.,1998) and 3MHA reveals passion fruit, grapefruit, box tree, gooseberry and guava (Tominaga et al., 1996). Thiols have very low sensory perception threshold: 4MMP is the lowest, detectable from 0.8 ng/l. The amount of 3MH needed to be detected is 60 ng/l and finally 4 ng/l are required to make 3MHA findable in wines (Dubourdieu et al., 2006).
Although a lot of research has been carried out during the last years in this field, pathways to free volatile precursors from their non-odorous precursors are not indicated completely yet and the context to final thiol concentration in wine still remains unclear. Therefore, this is still a topic of recent research. Especially the formation of 3MH seems to be quite unpredictable as the precursor formation process is dynamic and affected by multiple factors. Three pathways for the formation of 4MMP and 3MH in saccharomyces cerevisiae have been identified so far.
6
1. The first pathway described, is the direct transfer of the Cysteinlyated precursors: 3-S-cysteinylhexan-1-ol (Cys-3MH) and S-3-(4-mercapto-4-methylpentan-2-one)-cysteine (Cys-4MMP) by beta-lyase (Tominaga et al., 1998).
2. The second pathway describes the presence of S-3-(hexan-1-ol)-L-cysteine in grapes as an intermediate in the breakdown process of S-3-(hexan-1-ol)-glutathione, arising from detoxification processes in vines. Enzymes involved in this process have been suggested to be γ-glutamyltranspeptidase and probably carboxypeptidase first by Gachons et al., (2002). Clear relationship was shown by Roland et al., (2010), using stable isotope dilution assay. This pathway was finally confirmed by recent studies with more sensible methods (Capone et al., 2011).
3. The third pathway is a convertion of (E)-2- hexenal into 3MH and mesityl oxide as a precursor which can be converted to 4MMP. This pathway is proposed to require either the presence of a sulfur donour as H2S, cystein or glutathion to finally form several possible adducts (Schneider et al., 2006, Roland et al., 2010).
Swiegers et al., (2005) showed that no cysteinlyated precursors exists for 3MHA. This compound is only formed during fermentation by saccharomyces cerevisiae. The enzyme shown to be responsible for this transfer is alcohol acetyltransferase, the same enzyme responsible for the formation of the ester ethyl acetate. This study also revealed that the formation of 4MMP does not correlate with the cells ability to form 3MH.
There is a big pool of potential aroma still locked in Sauvignon blanc wines after fermentation, which might be able to be unlocked by winemakers in the future. The amount of 3MH gained from the transformation of Cys3MH represents only 3-12 % of the total amount in wine (Masneuf et al., 2006; Subileau, 2008). Only 10 % of 3MH were shown to arise from green leave volatiles as demonstrated in point 3.) (Schneider et al., 2006).
Recent studies focusing on genes involved in the conversion of cys-4MMP and glut-3MH to their related thiols 4MMP and 3MH showed that the yeast gene IRC7 is essential for this transformation (Thibon et al., 2008). In addition it was shown that the gene OPT1 is required for the uptake of glut-3MH into the yeast cell, although further transporters may be required for this step in some yeast genomes and CIS2/ECM38, encoding γ-glutamyltranspeptidase to further transfer glut-3MH to cys-3MH as part of the detoxification process of electrophilic xenobiotics (Ubiyvovk et al., 2006). The full length IRC7 gene is then not only essential for the release of 3MH but was also found to be the gene responsible for the transformation of cys-4MMP to cys-4MMP (Santiago & Gardner, 2015). Former research has already revealed the encoding of beta-lyase by IRC7 and have shown a preference of the enzyme towards cys-4MMP to cys-3MH (Roncoroni et al., 2011). Other research also revealed the effect of STR3
7
to the encoding of beta-lyase, although its effect was found to be rather minor (Harsch & Gardner, 2013). The conversion of cys-3MH to 3MH is only partly affected by the IRC7 gene (Santiago & Gardner, 2015).
The levels of thiols found in bottled Sauvignon blanc wines are strongly influenced by both, viticultural practises as well as winemaking conditions and enological treatments.
It was shown, that precursors greatly increase during ripening, except for the cysteinlyated conjugate of 4MMP, especially in the pre-harvest time (Roland et al., 2010; Capone et al., 2011; Cerreti et al., 2015). Moderate water stress can increase 3MH) and decrease (Cys-4MMP) concentration in musts, but more severe water stress will lead to a degradation of the final concentration of cysteinlyated precursors (Choné, 2001; Peyrot des Gachons, 2002). To supply the vine with sufficient amount of nitrogen has shown to improve the aromatic potential by increasing cysteinlyated precursor levels (Choné et al., 2006). The foliar application of a combination of sulphur and nitrogen prior to veraison showed to have a positive effect (even a higher effect than a single nitrogen application) on glutathione and volatile thiol expression in wines obtained, without negative impacts on yield and vine vigour. No increase in botrytis
cinerea was seen in this study (Lacroux et al., 2008).
Besides the many changes occurring by an infection with botrytis cinerea, levels of volatile thiols have been shown to increase strongly in wines made from botrytisized grapes both, analytical and sensorial (Sarrazin et al., 2006). Especially S-3-(hexan-1-ol) cysteine (P-3SH) has been shown to be affected strongly by infection with the fungus, due to a stimulation of the grapes metabolic pathway (Thibon et al., 2009).
3MH-S-cys levels were seen to increase when higher pressures were applied during the pressing of grapes. Also skin contact showed an increase of 3MH-S-cys, precursor for varietal aroma (Magu et al.,2007; Roland et al., 2011). These observations are explainable by the fact that more than 50 % of 3MH precursors are found in grapeskins, though 80 % of 4MMP precursors are found in the berry flesh (Peyrot des Gachons, 2002). An extraction of polyphenols though was shown to have an indirect negative impact on thiols. Research by Blanchard et al., (2004) revealed higher oxidation of 3MH in the presence of oxygen and catechin compared to the presence of only oxygen. It was shown that must oxidation affected hydrocinnamic acids which form quinones and usually later react with glutathione via a Michael addition, to GRP (grape reaction product) due to the presence of phenoloxidase activity under presence of oxygen on hydrocinnamic esters, particularly trans-caftaric acid (Singleton et al., 1985; Singleton, 1987). But quinones are also able to directly react with thiols within a Michael addition or form peroxides as a result of multiple reactions (Wildenradt & Singleton, 1974; Cheynier et al., 1986; Nikolantonaki & Waterhouse, 2012). Nikolantonaki & Waterhouse, (2012) showed also that thiols react differently with quinones, 4MMP was shown to be less
8
affected than 3MH. The thiol-oxidative capacities of peroxides have more recently been confirmed (Blanchard et al., 2004). Must oxidation still seem to be a way to increase G3MH and Cysteinlyated precursors and G4MMP are not decreased, as their sulfhydryl group is involved in a C-S bond which preserves them from oxidation (Roland et al., 2010). These results have to be rated with caution though as they may only match wines with a very low polyphenol fraction. No effect has been seen on different pH and potassium levels in Sauvignon blanc juice (Grose et al., 2015). But a higher oxidation of polyphenols is known to occur at higher pH, which ends in an indirect negative effect on thiols as described above. The use of SO2 is known to prevent phenol oxidation by inhibition of phenoloxidases and is therefore an important factor of conserving thiol oxidation.
Saccharomyces cerevisiae offers different abilities to free volatile thiols from their non-odorous
precursors, especially in their aptitude to release 4MMP from its cysteinlyated precursors. Research by Howell et al., (2004) revealed abilities of certain yeast strains to release 4MMP from its cysteinlyated precursor up to 138 fold in synthetic medium, compared to a control strain. It was shown that the release of 3MH is not affected by the yeast strain. The most efficient commercial wine yeast can only release approximately 5 % from precursors (Murat et al., 2001; Swiegers et al., 2006). In another study, a transfer rate between 0.6 % and 10.2 % with an average of 3,2 % was shown in rose wines coming from AOC Bordeaux (Murat et al., 2001b). Studies have also shown that some non-saccharomyces strains may contribute to the final volatile aroma concentrations found in wines, especially to the amount of 3MH released (Zott et al., 2011).
Masneuf-Pomaréde et al., (2006) clearly demonstrated the effect of fermentation temperature on volatile thiol transfer. 4MMP aswell as 3MH were found to be higher when fermented at 20 °C, compared with levels achieved at 13 °C fermentation temperature. In contrast Swiegers et al., (2006) found that a wine fermented at 18 °C had higher amounts of 4MMP than wines fermented at 23 °C and 28 °C. Studies of Howell et al., (2004) on the effect of fermentation temperature on the abilities of different yeast strain to release 4MMP have shown that temperature was an increasing factor for some strains but not for all, leaving the conclusion that other factors need to be considered to qualify the total effect of temperature.
Former research has proven the positive effect of low fermentation temperatures (10 °C) on fruity esters as isoamyl acetate, isobutyl acetate, ethyl butyrate, hexyl acetate compared to the formation of more "heady" esters as ethyl octanoate, 2-phenethyl acetate and ethyl decanoate at higher temperatures during fermentation at 15 - 20 °C (Killian & Ough, 1979). Additionally, the research conducted by Masneuf-Pomaréde et al., (2006) also showed an increase in acetic acid in wines, fermented at higher temperatures. More research has to be carried out to find perfect fermentation temperatures at which wines would profit from both, fruity esters and volatile thiols, leading to a maximisation of total winearoma.
9
Subileleau et al., (2008) showed that the addition of diammonium phosphate decreases 3MH production. This is suggested to be an effect of the yeast cells nitrogen catabolism repressing GAP1, an identified transporter molecule, responsible to transport Cys-3MH into the cell. This suppression can be extended under nitrogen rich conditions. These findings have also been confirmed more recently by Harsch & Gardner (2013) who found that thiol yields are not only modified by nitrogen containing but also sulphur containing supplements. Among 17 genes involved in sulphur amino metabolism, MET17, CYS4, and CYS3 were standing out, responsible for the multiple step conversion of H2S to cysteine. Nitrogen wise, addition of ammonia, known to induce nitrogen catabolic repression and urea increased thiol production substantially. These results disagree with the findings of Subileau et al., (2008), who found that only addition of Urea had a positive effect on thiols whereas addition of DAP decreased Thiol expression. Thaillandier et al., (2007) showed different behaviour towards nitrogen, when monitoring four yeast strains. Therefore, effects of nitrogen content and source have to be related to a specific strain. The addition of nitrogen sources has on the other hand shown to have an effect on the final ester profile of wines, as addition of ammonia increases concentrations of acetate esters and ethyl butyrate but not the higher molecular weight fatty acid ethyl esters. Differences depend on the yeast strain added and source of nitrogen used. A general increase on esters by ammonia addition could not have been proven (Miller et al., 2007). Also Pinu et al., (2013) have monitored changes in ester profile due to the addition of nitrogen sources. Further an increase of negative perceived aroma compounds as methional (sweet soup and meat aroma) and 4-ethylguaiacol (glove spicy, smoky aroma) could be monitored.
Recently, the presence of the two precursor Cys-3MH and GSH-3MH was proven in commercial, grape derived tannin (Larcher et al., 2013). Tannins are widely known to winemakers for their abilities to stabilize colour in red wine making and to increase mouthfeel and aroma profile. The positive potential of this thiol source as a contribution to the total precursor pool, leading to higher 3MH and 3MHA values, has been shown in recent research (Larcher et al., 2015). Although more research has to be carried out about the perfect usage of this new precursor source, an alternative, introduced precursor source was revealed within this research.
3.3 Turbidity:
The composition and amount of juice lees, varies with the raw material the juice was obtained from and the process of juice extraction. This refers mainly to total amount and particle size. The lees, obtained after the pressing of grapes consist of earth, skin, stem fragments, cellular
10
debris, from grapepulp and insoluble residues from vineyard treatment products (Ribereau-Gayon et al., 2006b).
Although the exact chemical composition of grape lees is hardly known, they contain insoluble polysaccharides, few nitrogen compounds, mineral salts and a big amount of lipids, most likely from cellular membranes (Ribereau-Gayon et al., 2006b).
Alexandre et al., (1994) analysed particles obtained by settling of a white must and found they consist of 72 % of total sugars, 8 % of lipids, 5.5 % of minerals, 5.2 % of pectin, and ~2.6 % of nitrogen. Further the author investigates UFAs and detected that linoleic acid is the most abundant UFA in lees, reaching up to levels of 25 %, followed by stearic acid up to 22.2 %, oleic acid and palmitoleic acid to 5.5 %. For SFAs an amount of 25 % of palmitic acid, 13.8 % of stearic acid, and 8.3 % of lauric acid was detected. Tumanov et al., (2015) investigated the lipid composition in a total of 217 Sauvignon blanc juice samples, delivered by wineries all over New Zealand. It was shown, that the total lipid content in grape juices reached up to 2.8 g/l. The free fatty acid content, as directly usable by saccharomyces cerevisiae was in a range between 0.56 - 28.45 mg/l. The study revealed also vintage effects on total fatty acid amount and composition of the fatty acid profile. The composition of UFAs and SFAs was previously investigated by Roufet et al., (1987) who found a composition of 72 to 28 % at maturity. During grape maturation, lipids acted quite stable, except for linoleic acid, which proceeds to decline from veraison. Nicolini et al., (2011) suggest a turbidity of 100 NTU to achieve fruity fermentation notes while ensuring a non-sluggish fermentation. Fermenting at slightly higher NTU may lead to a slightly more complex aroma. Ribereau-Gayon et al., (2006b) gave an optimum value between 100 and 250 NTU, Charrier et al., (2013) recommend values between 50 and 150 NTU.
The effects of suspended solids can be separated into two main groups, physical or chemical. The physical component is mainly based on an increase of inner surface. This increase allows CO2 to be released from the ferment, providing gushing points. At low turbidity though, CO2 is one of the main inhibitors of yeast cells. Although the actual mechanism of CO2 on yeast cells could not be proven so far, the most probable explanation is due to an intracellular decrease in pH caused by CO2 dissolving into the cell membrane, forming carbonic acid. The effect is a decrease in the cytoplasmatic pH, affecting enzymatic activity and protein synthesis and causing irreversible protein denaturation which ultimately leads to the inactivation of the microorganism (Spilimbergo et al., 2005).
Suspended solids are known to have an absorbable effect on various components. Research by Joshi et al., (2013) has revealed a decrease in titratable acidity, related to adsorption by insoluble solids added to an apple wine ferment. Probably this is due to providing crystallisation points for acidic salts. A decrease of K and Na ions can be related too, as residues of K and Na were lower in wines, fermented with solids. Wines with lower K and Na
11
levels are known to be less likely to tartar instability which can be seen as a positive effect. At the same time suspended solids affected metal ions: a reduction of Cu and Fe content was observed, Zn content increased significantly. Especially degradation of Fe and Cu ions can be seen as positive effects of juice turbidity as those ions are known to have an effect on aroma composition, especially on sulphur containing compounds as thiols and even trace amounts below 1 μg/l were suggested to catalyse thiol oxidation (Blanchard et al., 2004). Solids in juice are known to contain an amount of polyphenols which are likely to be oxidized by phenoloxidase and to increase colour or may even oxidise thiols by a multiple step reaction via quinones (Joshi et al., 2013).
Joshi et al., (2013) reported results similar to earlier findings which showed a decrease in total ester content in wines fermented from juices with a higher content of solids. These results differ from previous research by Groat & Ough (1987), who found esters and fusel oils to generally increase with higher content of solids fermented.
Research has shown that the prefermentative addition of grape derived solids to grapejuice decreased acetic and pyruvic acid production, reduced the lag phase, and increased the fermentation rate. These effects have been compared to alternative products to increase turbidity as bentonite, diatomaceous earth powder, charcoal, cellulose, gelatine and silica gel, and inert insoluble materials as glass beads, quartz powder, and talc. But none of these alternatives had an effect as strong as grape derived solids. These effects have been related to fatty acid composition of grape solids. In strongly clarified musts acetic acid has been considered to be hydrolised from Acetyl-CoA, unable to be metabolised by yeast (Delfini & Costa., 1993).
Depending on spray timing, active ingredient used and half time of the ingredient, freshly pressed grape juice may contain some pesticide residues. Some early organic fungicides, used to fight downy mildew (Plasmopara viticola), Folpet, Captan, Captafol and Dichlofluanid, which are still common to use, have been shown to have antiseptic effects on yeast (Cabras et al., 1987). Fermentation delays have been observed under influence of some pesticides like thiophanate-methyl and fenarimo (Zironi et al., 1991). Molecules nowadays can only be introduced to the market after their inactivity on microflora has been proved. In grapejuice, pesticides normally undergo absorption by yeast, degradation by the acidity of the juice itself or transformation during fermentation. Clarification decreases pesticide residues up to complete elimination (Cabras & Angioni, 2000). Before the introduction of organic pesticides, copper and sulphur were the most abundant ingredients to fight mildew diseases. Copper is naturally found in grapes up to 2 mg/l. Darriet et al., (2001) revealed that the application of copper around veraison into the fruitzone can increase copper concentration in grapes up to 37.6 mg/l. Due to this increase varietal thiols, as found in Sauvignon blanc, Merlot and
12
Cabernet Sauvignon were decreased strongly in all the three years analysed. 3MH decreased 37 - 94 %, compared with Folpet treated vines, 4-mercapto-4-methylpentan-2- one decreased 25 - 50 %. Finally, this lead to wines lacking in olfactory typicity. It was further suggested that copper is adsorbed by grapesolids and therefore decreased in must after clarification. Depending on the origin of the grapes and the methods applied during their production, residue pesticides may become a stress factor for yeast. Residue copper has a strong effect on thiol yield, if insufficient clarification is carried out.
In research, studying the effect of different juice turbidities between 15 and 350 NTU, it was shown, that an increase in turbidity, decreased fermentation time and residual sugars. The same study could not show differences in ethyl acetate. At the same time a decrease of acetic acid was revealed in ferments of higher turbidity (Nicolini et al., 2011).
Saccharomyces cerevisiae is known to change its metabolism according to changes in
environment. Studies showed that yeast also utilises secondary nutrients besides its main metabolites glucose and fructose. Sugar alcohol, carboxylic acids and fatty acids are utilised after fermentation of main sugars which shows that wine is affected by juice composition (Pinu et al., 2014)
3.4 Sterols and fatty acids:
Winemaking techniques as used in countries considered as “new world” wine regions nowadays are known for a highly reductive style of winemaking when it comes to the production of Sauvignon blanc wines. Modern techniques as stainless steel vats, the use of inert gases, sparging, and the use of antioxidatives are used to prevent oxidase activity and the loss of highly reactive thiols, which lead to the appreciated styles of wines coming from “new world” origins. These techniques can lead to juices with an extreme prefermentative prevention of oxygen. Additionally, prefermentative clarification is applied after pressing. Both techniques may cause troubles during the process of winemaking. Already early in the history of wine related research, growth rates of yeast in an oxygen depleted medium were described as very low. Further, the supplementation of sterols was first described to significantly increase yeast growth under such anaerobic conditions (Andreasen & Stier, 1953). More recently the sterol needs of yeast were monitored more precisely, specifying the sterol requirement for optimal yeastgrowth from 2 to 4 mg phytosterols/l (Deytieux et al., 2005). The cell wall of yeast consists mainly of fluidity providing phospholipids (principally phosphatidylcholine and phosphatidylethanolamine) and rigidity providing sterols, principally ergosterol and zymosterol (Walker G.M., 1998). Therefore, lipids and sterols are key factors of the growth, metabolism, and viability of yeastcells during the alcoholic fermentation.
13
Yeast cells can synthesize their own sterol, ergosterol, in the membrane of the endoplasmatic reticulum by squalene cyclization, from where it is transported through the Golgi bodies to the plasma membrane in aerobic conditions (Zinser et al., 1991). The requirements of oxygen in a lipid depleted must were estimated at about 10 mg/l to maintain a vital yeast population (Sablayrolles & Barre, 1986.) The enzyme responsible for the regulation of sterol synthesis is hydroxymethylglutaryl-CoA reductase. The activity of this enzyme is highly oxygen dependent. Therefore, yeast becomes auxotroph to sterols and long chained fatty acids under anaerobic conditions (Jacquier & Schneiter, 2012). Besides that, UFAs, especially linolenic acid have been shown to accelerate sterol synthesis up to 7 fold. Therefore, it was suggested, that the supplementation of UFAs leads to a completion of the protein synthesizing apparatus during cell growth (Boll et al., 1980).
Only under anaerobic conditions, yeast is able to import exogenous sterols, arising from sources other than fungal (Zavrel et al., 2013). It was shown that the highest UFA uptake rates are observed in the exponential phase of yeast growth, ending in an almost complete consumption (Duan et al., 2015). Luparia et al., (2004) pointed out the importance of solids for nutritional purposes, mainly for their content of grape phytosterols. Casalta et al., (2016) analysed solids from white and red musts and found phytosterol concentrations to range from 3 to 10 mg cholesterol equivalent per gram dry weight. Their composition was described as follows: 89 % β-sitosterol, 6 % campesterol, 3 % stigmasterol, and 3 % stigmastanol.
Betrand and Miele, (1984) have shown that clarification reduces the total fatty acid content in juice to 90 %. Further they suggested that also exogenous sterols are removed within the suspended solids. It was shown that yeast loses its ability to divide when no sterols and UFAs are left in a media to ferment, as these compounds are a non-replishent compound of the cell membrane (Monk, 1997). If yeast is inoculated, 4 to 5 doublings are required to reach the stationary phase but if spontaneous fermentation is allowed, up to 16 doublings are possible. Reserve sterols in the yeast dilute with each doubling, finally leading to cell walls unable to protect its permease proteins, and leading to a rapid acidification of the cytoplasma. Acidification of the cytoplasma finally ends in ethanol induced nutrient leakage and inhibit sugar transportation systems (Monk, 1997; Boivin et al., 1998; Jackson, 2008). In a sterol free medium, in absence of oxygen, yeast cells exhibited stuck fermentation, which is related to a rather low biomass (Luparia et al., 2004). A supplementation of UFAs on the other hand showed to improved yeast growth and fermentation activity (Duan et al., 2015).
Further, the ability of yeast to produce and tolerate increasing ethanol content during fermentation is highly linked to the amount of UFAs and sterols in their plasma membranes (Rose, 1993). Saccharomyces cerevisiae was shown to increase UFAs/SFAs and ergosterol
14
content at the expense of the steryl ester pool in in their cell membranes as a way to adapt to stressful conditions during fermentation (Rupčić J. & Jurešić G.Č., 2010). Finally, Tesnière et al., (2013) showed that lipid limitation affects nitrogen metabolism. A rapid loss of cell viability and higher cell death rates were recorded in a lipid depleted medium, and correlated to higher nitrogen availability. These results implement a possible negative role of nitrogen during fermentation by modulating stress responses. Higher lipid contents were suggested in high nitrogen ferments.
Smith et al., (1996) have shown that ergosterol is not only incorporated by the yeast as part of the cell membrane, but also has effects on gene expression and enzymatic activity. Research by Duan et al., (2015) clearly showed the positive effect of UFAs on most volatile compounds. The amount of higher alcohols (2-phenylethanol, 2-methyl-1-propanol and 3-(methylthio)-1-propanol), medium-chain fatty acids (butanoic acid, hexanoic acid and octanoic acid), acetate esters (isoamyl acetate and 2-phenylethyl acetate) and all ethyl esters was increased after the addition of UFAs to a synthetic medium. As mentioned before, the enzyme responsible for the formation of ethyl esters, alcohol acetyltransferase is also responsible for the formation of 3MHA from 3MH it is expectable that an increase of UFAs could increase the formation of this compound. To my best knowledge, no research about the effect of UFAs on 3MHA formation was done to date.
Pinu et al., (2013) suggested that the initial biosynthesis of 3MH might be influenced by the activity of the TCA cycle and fatty acid metabolism of yeasts as linoleic acid has been shown to correlate with 3MH even if no correlation was found in this study with 3MHA or its acetylation ratio. Saccharomyces cerevisiae lacks of ∆12-fatty acid desaturase and ω3-fatty acid desaturase, the enzymes required for the production of polyunsaturated fatty acids as linoleic acid and linolenic acid (Yazawa et al., 2009). Research has revealed the contribution of juice lees to content in linoleic and linolenic acids and related enzymes (Nicolini et al., 2011; Varela et al., 1999). The contribution of PUFAs to cell integrity and a wide stress tolerance is widely known (Kajiwara et al., 1996; Rodriguez-Vargas et al., 2007; Yazawa et al., 2009).
The formation of hexanal and hexenals as (Z)-3-hexenal and (E)-2-hexenal due to the enyzmatic breakdown of linoleic acid was formerly described by Drawert, (1974). The pathway to form n-hexanal from linoleic acid was described by Matsui, (2006) as a result of lipoxigenase (LOX) being able to oxidise the carbon double bonds of linolenic acid, forming linolenic acid 13-hydroperoxide (13HPOT). Further 13-hydroperoxide lyase (13HPL) is able to form (Z)-3-hexenal and 12-oxo-(Z)-9-dodecenoic acid. LOX is known to be able to break doublebonds at position 9, preferring linoleic acid (100 % activity) over linolenic (60.4 % activity) and oleic
15
acids (46 % activity). It was further shown, that the highest activity of this enzyme occurs between 25 and 30°C and an increased activity was monitored in presence of magnesium ions (Busquets et al., 2004). Drawert (1974), described these enzymatic-oxidative processes occurring after the crushing of fruit, if oxygen had access to the substrate and if enzymes had not been inhibited previously and the formation of these compounds leading to grassy, green impression of freshly crushed unripe grapes and leaves. This effect was also described by Roufet et al., (1987) who described the proceeding decrease of linolenic acid during maturation as the reason, that green, unripe, unpleasant flavours are not to be found in juices pressed from ripe fruit. Harsch et al., (2013) proved that a sulphur donor as H2S is required to further transfer (E)-2-Hexenal and its alcohol (E)-2-Hexen-1-ol into 3MH and 3MHA. It was also shown that (E)-2-Hexenal and (E)-2-Hexen-1-ol are metabolized in the first 24 hours after yeast inoculation, prior to alcoholic fermentation, probably to decrease its fungicide effect, which was mentioned by Kubo et al., (2003).
At the other hand it was indicated that linoleic and linolenic acid influences ester and medium chain fatty acid excretion negatively when fatty acids in the yeast reached a defined concentration. The same study revealed an increase in fusel alcohols when linoleic and linolenic acid were increased (Rosi and Bertuccioli, 1992).
16
Figure 4: Genesis of hexanol due to oxidation of Linolenic acid. Described by Drawert (1974).
3.5 Inoculation rates:
Research on icewine has shown that an inoculation of 0.5 g/l had higher fermentation capacities than an inoculation of only 0.2 g/l. This may be due to higher biomass and cell concentrations attained at the 0.5 g/l inoculation rate (Kontkanem et al., 2004). Normally the initial yeast population doubles 5 times if grown in anaerobic conditions to reach a final population of approximately 120-150 × 106 cells/ml, depending on the yeast strain when 30-50 % of sugar remains to be fermented. The addition of 25 g/hl of dry yeast, after rehydration provides an initial cell density of approximately 5 × 10⁶ cells/ml needed to achieve that goal but the author gives a value arising from personal experience of 3 × 10⁶ cells/ml minimum,
17
which equates to approximately 15 g/hl as a minimum (Monk, 1997). Miller et al., (2007) have also shown that the addition of nitrogen sources, preferable NH4 but also the addition of amino acids, increased fermentation capacities of yeast and made fermentations finish in a shorter time than control wines. Interesting in the research of Kontkanem et al., (2004) where yeast cells were shown to double more often at lower inoculation rates before going into a stationary phase. This result can be confirmed by the work of Lee et al., (2004) aswell. Here, even though initial inoculation rates were different by a factor of two, the average total cell count in between the treatments was less than 15 %. There are two major factors, limiting cell growth, being partly able to supplement each other: one of it is molecular oxygen, partly replaceable by two, fatty acids and sterol, which objective has been discussed before (Monk, 1997). This leads to the suggestion that yeast, inoculated at lower rates have to struggle more for the limited amount of these nutrients to double till the sufficient cell number. This stress will also have effects on metabolism and gene expression on some enzymes playing a role in aroma composition and maybe alcohol yield. Dried yeast cell cultures are known to have similar sterol reserves. This implements that a higher inoculation rate might have similar effects as the supplementation with fatty acids and sterols as cells can benefit of their lipid storages and finally do not have to divide that often to reach desirable cell numbers, which is known to dissolve lipid reserves between yeast generations (Deytieux et al., 2005).
Williams & Boulton, (1983) showed in a model that higher ethanol losses have to be expected from ferments of higher initial sugar concentration. Also higher inoculation rates have been suggested to produce higher ethanol evaporation due to higher fermentation rates and higher fermentation temperature, which finally greatly affects the transfer of ethanol into a gaseous phase. Joshi et al., (2013) decreased the final ethanol content in apple wine by addition of insoluble solids, previous to the fermentation. Although these results have not been confirmed statistically, they show a trend which may result from a decreased fermentability of must, caused by turbidity. Swiegers et al., (2006) suggested that warmer fermentation temperatures could also lead to thiols, formerly released during fermentation could get boiled off and be released from the ferment as part of the gaseous phase. Lee et al., (2004) could not show any effect on ethanol yield, arising from different inoculation rates either in a low (12.3 %) or a higher (14 %) alcohol degree ferment. It is also suggested that fermentation container design has an effect on final ethanol extraction out the container as ethanol may partly condensate in the headspace and be automatically reintroduced to the ferment. Different results have to be expected by red wine ferments in open top fermenters. It was shown that cap temperature could be up to 8-11°C higher than the liquid phase of the ferment and contains ethanol concentrations up to twice as high (Guymon & Crowell, 1977). Therefore, higher evaporation losses may have to be expected for red ferments. It was shown that higher concentration of esters like ethyl acetate, ethyl butyrate, isoamyl acetate, ethyl hexanoate, hexyl acetate, ethyl
18
octanoate, ethyl decanoate could be achieved at higher inoculation rate (0.5 g/l) compared to the lower inoculation rate (0.25 mg/l) when alcohol levels were low (Lee et al., 2004). Higher rates of turbidity at the other hand lead to a decrease in total esters in an apple wine ferment (Joshi et al., 2013). These observations correlated with an increase in fermentation speed, which is likely to boil of a certain number of esters in the gaseous phase.
3.6 Goals of this work:
In the further progress of this thesis, it will be tried to illuminate the development of thiols a little more. Turbidity is known for two main advantages. First to deliver UFAs and second, to help to release CO2.
If CO2 would not be released from a ferment it will in the worst case denaturise proteins and enzymes within the yeast cell. It is therefore likely that a higher release of CO2 may protect enzymes and therefore higher thiols expression may occur (Spilimbergo et al., 2005).
Smith et al., (1996) reported on the effect of UFAs not only on cell wall composition but also on enzyme activity. Swiegers et al., (2005) reported alcohol acetyltransferase, the same enzyme responsible for the formation of the ester ethyl acetate to be responsible for the transformation of 3MH to 3MHA. UFAs are known to increase acetyltransferase activity (Duan et al., 2015). At the same time, most 3MH precursors are found in skin (Peyrot des Gachons, 2002). As turbidity consists mainly of skin debris, an increase of 3MH during fermentation at higher turbidities is expectable. Therefore, the effect of grape solids on thiol production during fermentation should be clarified. Further, interactions of nitrogen compounds on thiol production have been stated (Subileleau et al., 2008). But differences have been monitored between nitrogen sources and yeast strain, effects of different nitrogen sources in combination with turbidity shall be analysed more in advance as suggested by Tesnière et al., (2013).
19
4.0 Materials and methods:
4.1 Inoculation trial:
4.1.1 Initial juice:Initially juice was collected from a commercial Marlborough winery in 2015 (further referred to as Marlborough juice), and stored at -1°C with FS of 40 ppm. To help maximise the aroma potential in the finished wines the concentration of green leaf volatiles was increased with the addition of freshly processed grape juice. Grapes (2.5 kg) of early maturity were harvested from OB vineyard where an irrigation regime of 3 weeks irrigation deficit was applied before veraison. Fruit was crushed in a manual crusher (Marchisio Cervino 400/600 kg/h) and rachis were removed by hand under reductive conditions. 2.5 l of stored Marlborough juice was added to the crushed and destemmed fruit and given 24 h skin contact at 6 °C. Fruit was then pressed in a compressed air operated 6 kg sample press (Stainless Steel Systems, Blenheim, New Zealand) under a cover of CO2. The pressing regime consisted of depressing the plunger and pressing for one minute, releasing the plunger and stirring the marc. This regime was repeated three times. Pressed juice (1.6 l) was added to the stored Marlborough juice to make a final volume of 25 l. To decrease FS levels to ˂20 ppm for fermentation, two 80 ml additions of 0.3 % H2O2 was added at 30 minute intervals to the 25 l of juice. The final FS concentration before inoculation was 15 ppm (juice analysis found in attachment section)
4.1.2 Juice turbidity
Turbidity measurements were carried out, using a “Hach-2100Q IS” turbidity meter. Juice turbidity in the initial juice was 1.6 NTU following juice crossflow filtration after the 2015 harvest. After the addition of the freshly pressed juice, turbidity levels were as high as 65 NTU. Our target juice turbidity for this trial was a value between 100 and 150 NTU. Therefore “Laffort-Turbicel”, purified cellulose (C6H10O5), was added at a rate of 250 ppm to maintain juice neutral solids to help keep yeast in suspension. 0.25 g/l were diluted in 10 times its weight in water and added to the juice fraction. Final NTU readings of the juice before inoculation showed 126 NTU.
4.1.3 Yeast nutrition:
To provide sufficient nutrition to the ferments, “Beverage Supply Group-Superfood” (distributed by Pacific Rim Oenology, Blenheim, NZ) was added at two rates 300 mg/l and 600
20
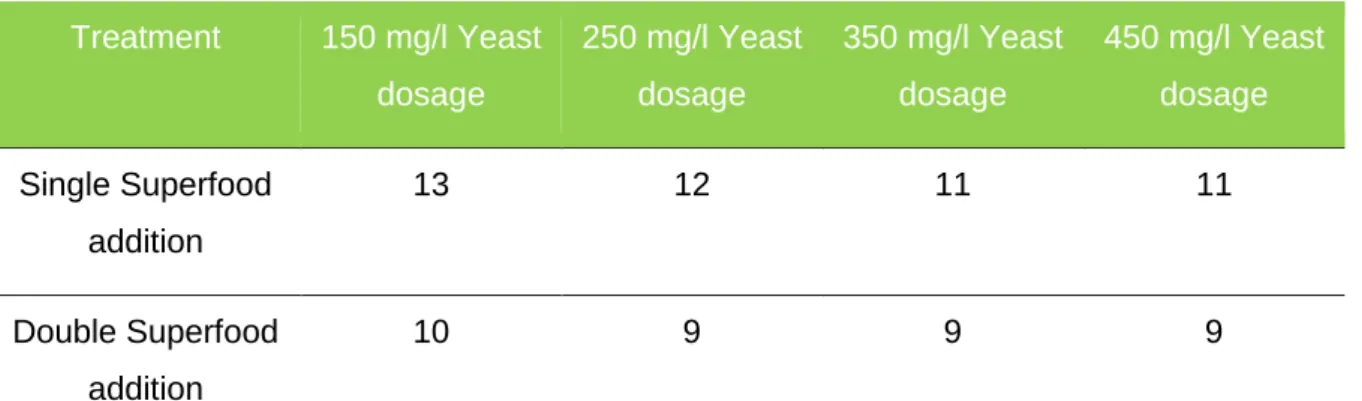
mg/l directly to fermentation bottles. Juice was added later. “Superfood®” is a complex yeast nutrient, consisting of yeast hulls Nutrex 370. DAP (32.5 %), Yeast Extract T154, minerals and vitamins. “Superfood®” was chosen to provide yeast not only with Ammonia but also with compounds needed for cell wall building. NOPA, ammonia and YAN were analysed after additions (Table 1).
Table 1 Initial YAN values
Sample YAN (mg/l)
Single Superfood addition 216,4
Double Superfood addition 240.6
Yeast assimilable nitrogen (YAN) levels as found in single and double Superfood (SF) adjusted juices, before inoculation.
The values shown above result from two single measurements. “Superfood was actually chosen not only for its effect on YAN but for its nutrition complex, providing long term supplementation, not measurable in the analysis carried out. Therefore, Yan values as given above only show an indicator and were not used statistically. As given by The Australian Wine Research Institute, minimum YAN values are 150 mg/l, for a fruitier expression of wines, 250 mg/l to 350 mg/l are recommended. Both nutrition additions can be seen as sufficient for a non-sluggish or stuck fermentation.
4.1.4 Glutathione addition:
For antioxidative properties, food grade glutathione, produced by “Now Foods”(USA), was added to the juice. Glutathione comes in capsules of 433.7 mg of weight, containing 355.7 mg of powder. Each capsule contains 250 mg of Glutathione and fillers made of Rice Flour, Magnesium Stearate (vegetable source) and silica. A standard dose of 250 mg to 725 ml of juice is added at PFR. Glutathione was added to the initial base juice of 25l at the rate of 344.8 mg/l. Glutathione was added after desulfurization. Glutathione is a tripeptide consisting of glutamate, cysteine and glycine.
4.1.5 Repetitions:
Different Superfood doses were weighted and distributed straight into the fermenters. Each level of Superfood and yeast dosage was repeated three times. For four levels of yeast and 2
21
levels of Superfood, 24 fermenters were prepared. After Superfood was distributed, fermenters were filled under use of argon gas, up to a previous marked equal filling height. Finally, yeast which was previously weighted and rehydrated according to the PFR small scale winemaking protocol was added to the fermenters.
4.2 Turbidity trial:
4.2.1 Initial juice:
Juices used for the turbidity trial came from three different vineyards in the Marlborough region; TB, harvested on 5.4.2016, OB, harvested 6.4.2016 and GCL, harvested on 13.04.2016. The intention was to deliver an overall profile of Marlborough vineyards. Therefore, vineyards with different soils and different management techniques were chosen. TB, farmed organic (2057 vines/ha) yielded app.15T/ ha, GCL (2314 vines/ha) yielded app. 27T/ha and the OB (2314 vines/ha) yielded app. 20T/ha. In terms of vigour, the TB is slightly less vigorous as the OB. Both can be classified as low vigour sites whereas GCL is high vigour site.
Once the fruit parcels arrived at the winery, a 40 kg subsample of grapes was crushed and destemmed in an Enoitalia crusher/destemmer (Eno 1S, Italy). A standard sulphur dioxide (SO2) addition (40 ppm) was added as potassium metabisulphate at crushing. A pectinase enzyme, Rapidase (rate 50 ml/t) was added to the crushed and destemmed fruit (must) and given one hour skin contact time before pressing. Grape must was pressed in a 20 kg hydro press (Marchisio, Italy) under a cover of CO2. A pressing regime of 2 min. at 1 bar followed by 12 min at 3.5 bar was applied. An addition of bentonite Seporit PORE-TEC by ERBSLȌH (rate 0.5 g/l) was made to pressed juice. Juice was cold settled for 24 h at 10 ºC and then racked off juice lees. A juice sample was collected for analysis. A final volume of 17 l of settled juice was then set aside for winemaking per replicate.
22 4.2.2 Juice turbidity:
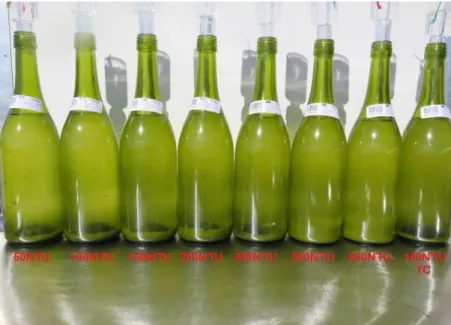
Figure 5. Different amounts of sediments as found after turbidity adjustment, before inoculation.
Juices pressed for the turbidity trial were handled according to the PFR winemaking regulations (to be found in the attachment section). After cold settling overnight, juices were racked, always by the same person to avoid variations in technique and lees composition. After the clear fraction was racked, the fluffy lees section was racked off the sediments, stored in 2 l jugs, and covered with argon gas till further processing. The clear juice fraction was further cut into 10 parts of 1.5 l and stored under argon cover in 4 l minibins. Then initial turbidity (Table 2) was adjusted by a multi-step process. Juice lees were added via a 10 ml pipette, and a 100 ml laboratory jug. After each addition, juices in the minibins were stirred, turbidity measured with the turbidity meter and argon gas added. This procedure was repeated till desired turbidity level was reached (Table 3). 2 minibins were kept as spare juices if turbidity level exceeded the desired level. After the juice turbidity adjustment, 0.7 l of the juice was bottled into the 0.75l fermenters (Figure 5) and inoculated under respect of the PFR small scale winemaking protocol, on the same day. This procedure was carried out for all three juice lots, ending in 3 fermenters for each turbidity level which was further seen as one repetition.
Table 2 Juice Turbidity
Origin/Vineyard Tuamarina Block Replicate 1
Giffords Creek Lane Replicate 2
Omaka Block Replicate 3
Initial Turbidity 52.6 NTU 53.9 NTU 34.0 NTU
Initial juice turbidity given in Nephelometric Turbidity Unit (NTU), after racking, before adjustment of the desired turbidity levels.
23 Table 3 NTU levels after adjustment
Origin/ Vineyard 50 NTU Target 100 NTU Target 150 NTU Target 200 NTU Target 250 NTU Target 500 NTU Target 950 NTU Target 150 NTU-TC* Target Tuamarina Block, Rep 1 Turbidity(NTU) 52.6 104 148 196 254 521 965 144 Derivation to target (%) 1.3 0.3 2.0 0.2 0.5 4.2 0.1 0.9 Giffords Creek Lane, Rep 2 Turbidity(NTU) 54.1 105 153 195 255 525 960 142 Derivation to target (%) 1.5 1.3 1.3 0.4 2.0 0.3 0.7 2.3 Omaka Block, Rep 3 Turbidity(NTU) 53.9 102 152 195 249 524 974 150 Derivation to target (%) 1.1 1.7 0.6 0.4 1.5 0.1 0.8 3.2 Total Average Turbidity(NTU) 53.3 103.7 151 195.7 252.7 523.3 966.3 145.3 Total Derivation to target (%) 0.8 1.5 2.7 0.6 3.2 2.1 7.1 4.2
Final turbidity levels given in Nephelometric Turbidity Unit (NTU), after adjustment with must lees. Derivation from the relevant average turbidity is given below each vineyard. A mean standard derivation is given in the last row.
24 4.2.3 Yeast nutrition:
Table 4 Initial nitrogen status
Vineyard/ origin YAN (mg/l)
Tuamarina Block 141
Giffords Creek Lane 251
Omaka Block 88
Shows mean initial Yeast assimilable nitrogen (YAN) levels of the three vineyard blocks used within the turbidity trial, before adjustment with Diammonium Phosphate (DAP) and Superfood.
To maintain equal YAN values of 250 mg/l, “Superfood” and DAP was added to each bottle of ferment as required. As specified by the Plant and Food winemaking protocol, the required addition to achieve 250 mg/l total YAN was split, 50 % as delivered by DAP and 50 % as “Superfood”.
4.3 General procedure:
4.3.1 Bentonite:Protein fining was carried out in both trials, using “Seporit PORE-TEC”-bentonite (ERBSLȌH) at a rate of 0.5 g/l to must. Additionally, prefermentative clarification was enhanced due to this step. “Seporit PORE-TEC” bentonite is known for its high purity and therefore releases almost
no heavy metals to wine, during fermentation therefore no negative influence on thiols can be expected
4.3.2 Yeast inoculation:
All musts were inoculated with “Laffort-Zymaflore X5” commercial yeast, known for its thiol releasing properties. Standard procedure of inoculation at PFR is a standard yeast addition of 250 mg/l added to all 0.7 l treatments of the Turbidity trial. Yeast was rehydrated in 10 times of its weight in water and afterwards inoculated by pipette. For the Inoculation trial yeast was inoculated at a rate of 150 mg/l, 250 mg/l, 350 mg/l and 450 mg/l and followed the same PFR
25
yeast rehydration protocol as the turbidity trial. Temperature of the must at inoculation was 16 °C for both trials.
4.3.4 Yeast cell count:
Total yeast cell numbers were counted, using a “Hawksley-Counting chamber” (Haemocytometer) in style of an improved-Neubauer chamber. Cell counts were carried out, starting from 1.5 h after inoculation and on a daily base till 5 days after inoculation when cell counts reached a stationary phase. Dilution factors of 1.1 on the day of inoculation 2.2 on the first day after inoculation, 11-15 on the second day after inoculation and 100 from the third day after inoculation were used. Dilution was done, using distilled water. To make cells more visible 0.1 ml of “Aldrich-Methylene blue 0.05 wt.% solution in water was applied to each sample. Cell counts were further processed using the formula:
X=(d*n)/V where
X= total number of cells per ml d= dilution factor
n= average number of cells per square
V= volume of square that was counted = 4*10-6
Equation 1: Shows the equation, applied to calculate yeast cells/ml.
Samples of 1 ml were taken after fermenters had been homogenized by mixing. Argon gas was applied before and after sample taking to avoid oxidation.
4.3.5 Total soluble solids and temperature measurements:
Total soluble solids (measured as °brix) and fermentation temperature were measured daily, using an “Anton Paar-DMA35” density meter (Anton Paar, Austria). Before and after measurements Argon gas was used to protect ferments and avoid oxidation. Once °Brix values dropped below 0 residual sugars were monitored daily using Clinitest® (Bayer, USA). When residual sugars reached 2.0 g l-1, the ferments were stopped with the addition of 50 mg l-1 SO
2 (as potassium metabisulphite). Ferments were settled for 24 hours and wine was racked and centrifuged at 4600 rpm for 5 minutes using a Thermo Scientific Heraeus Multifuge 3SR+ centrifuge (Thermo Fisher Scientific) and samples taken for chemical analysis.