i
Case study: An Analytical Model for the Fraud
Detection in Company Purchases
Raquel Alexandra Batista Reynaud
Dissertation presented as partial requirement for
obtaining the Master’s degree in Statistics and Information
Management
i
NOVA Information Management School
Instituto Superior de Estatística e Gestão de Informação
Universidade Nova de LisboaCASE STUDY: AN ANALYTICAL MODEL FOR THE FRAUD
DETECTION IN COMPANY PURCHASES
by
Raquel Alexandra Batista Reynaud
Dissertation presented as partial requirement for obtaining the Master’s degree in Statistics and Information Management with specialization in Information Analysis and Management
ii
ACKNOWLEDGEMENTS
A special thank you to my parents. Without them, I would not be able to accomplish this goal of becoming a Master. To my Mother, for always being there for me and always having a kind hug for me. To my Father, who was always proud of me and wanted me to succeed. Thank you for all your love.
To my advisor, Professor Rui Gonçalves, for having followed me through the entire project, giving me the necessary guidance and support.
iii
ABSTRACT
In a world where the business landscape is changing as a consequence of the increasing importance of the digital area, the financial and reporting environment are also being reshaped, resulting in several challenges for audit committees and auditors. Assurance services are responsible for transmitting clear information and nowadays auditing has become an increasingly demanding task. In this regard, detection fraud is one of the areas explored by assurance, including studying the risk of companies committing fraud, and also the hypothesis of employees committing these kinds of misconduct. In fact, in the modern digital world, it becomes easier to commit fraud, therefore it is quite relevant to study its impacts and causes. Theories related to the fraud triangle as well as fraud related to the utilities sector will be explored and will be the basis of this study.
Having this in mind, this study aims to identify the most significant variables in detecting the risk of fraud in company purchases, using some companies’ data in order to help this analysis. Having this in mind, the conclusions about the selected model were to consider two different approaches: Keeping All Variables and Removing Some Variables. For the first option, the best model was Linear Regression and for the other one was Neural Networks, considering Misclassification Rate and Captured Response as significant statistics. Thus, this study aims to fill the gap of information and studies in this area by providing relevant inputs that may be used on other studies in this field.
KEYWORDS
iv
INDEX
1.
Introduction ... 1
1.1. Background and Problem Identification ... 1
1.2. Study Objectives ... 2
1.3. Study Relevance and Importance ... 2
2.
Literature Review ... 4
2.1. Concepts of Fraud ... 4
2.1.1. Fraud Triangle Theory and Fraud Diamond Theory ... 5
2.1.2. Fraud Prevention and Detection... 7
2.1.3. Purchase Fraud in Utilities Sector ... 9
2.2. Techniques for Fraud Detection ... 10
2.2.1. Statistical methods... 10
2.2.2. Data Mining methods... 11
Linear Regression ... 12
Decision Trees ... 12
Neural Networks ... 12
3.
Methodology ... 14
3.1. Applied Methodology ... 15
3.1.1. Data Collection and Cleansing ... 15
3.1.2. Data Transformation ... 16 3.2. Modelling ... 17 3.3. SEMMA Methodology ... 18 3.3.1. Sample ... 18 Data Sources ... 18 Variables ... 19 3.3.2. Explore ... 20 Interval Variables ... 21 Class Variables... 21 Data Partition ... 27 3.3.3. Modify ... 28
Missing Values (NULL Values) ... 28
Dimensionality Reduction ... 29
3.3.4. Model ... 33
v Neural Networks ... 34 Decision Trees ... 34 3.3.5. Assess ... 34 Misclassification Rate ... 35 ROC curve ... 35 Captured Response ... 35 Gini Coefficient ... 35
4.
Results ... 37
5.
Discussion and Conclusions ... 39
6.
Bibliography ... 42
vi
LIST OF FIGURES
Figure 1.1 – The Fraud Cycle ... 2
Figure 3.1 - The Fraud Analytics Process Model ... 14
Figure 3.2– Purchase Diagram of Alpha ... 15
Figure 3.3 – POs with NULL values in the Contract variable ... 22
Figure 3.4 – Total number of POs distributed by the variable RiskFactor ... 22
Figure 3.5 – Total number of POs per region ... 23
Figure 3.6 – Gender distribution of the final approvers ... 24
Figure 3.7 – Total number of POs per year ... 24
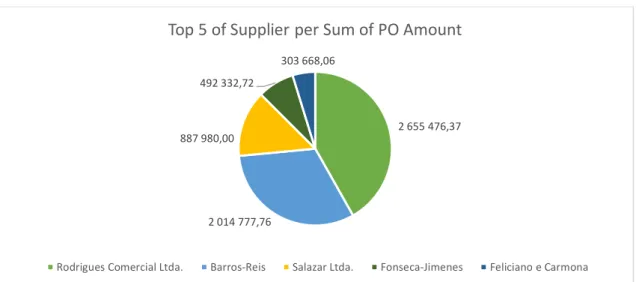
Figure 3.8 – Top 5 of suppliers with the higher sum of PO amount... 25
Figure 3.9 – Top 5 of suppliers with the higher sum of Invoices amount ... 25
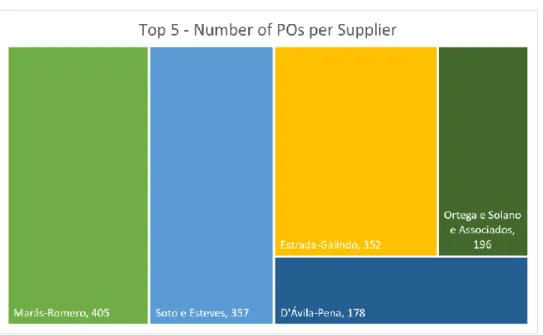
Figure 3.10 – Top 5 of suppliers with the higher number of POs ... 26
Figure 3.11 – Top 5 of approvers with the higher number of POs ... 26
Figure 3.12 – Training Set ... 27
Figure 3.13 – Validation Set... 28
vii
LIST OF TABLES
Table 3.1 – Data sources information ... 19
Table 3.2 – Variables of DB_Alpha ... 20
Table 3.3 – Variables Role and Level Distribution ... 20
Table 3.4 – Statistics of Interval Variables ... 21
Table 3.5 – Interval Variables behaviour with RiskFactor (Target variable) ... 21
Table 3.6 – Variable Selection Output ... 31
Table 3.7 – Dimensionality Reduction Strategy: Metadata node ... 32
Table 4.1 – Keeping all variables – Final Results ... 37
Table 4.2 – Removing some variables – Final Results... 37
viii
LIST OF ABBREVIATIONS AND ACRONYMS
ACFE Association of Certified Fraud Examiners
CFO Chief Financial Officer
DM Data Mining
DT Decision Tree
ERP Enterprise Resource Planning
FDT Fraud Diamond Theory
FI Financial Accounting (module)
FTT Fraud Triangle Theory
IT Information Technology
MM Materials Management (module)
MSE Mean Square Error
NN Neural Network
PO Purchase Order
ROC Relative Operating Characteristic
SAS Statistical Analysis Software
SOM Self-organizing maps (NN)
1
1. INTRODUCTION
1.1. B
ACKGROUND ANDP
ROBLEMI
DENTIFICATIONFraud is defined by the Association of Certified Fraud Examiners as “the use of one’s occupation
for personal enrichment through the deliberate misuse or application of the employing organization resources or assets” (ACFE, 2016). This definition covers a wide variety of conduct
from executives to employees. Violations can range from asset misappropriation, fraudulent statements and corruption, using company property for personal benefit, and others (Jans, Lybaert, & Vanhoof, 2008).
It is increasing everyday with the growth of new technologies, resulting in money loss for companies and individuals worldwide (Bolton & Hand, 2002). The technological improvement, that is partly responsible for the increasing trend in fraud, is also part of the solution, according to Jans, Lybaert, and Vanhoof (2007). Recent studies even show that fraudulent behaviour is a worldwide issue, consuming an estimated 5% of the typical organization’s annual revenue (Baader & Krcmar, 2018). In fact, fraud has increased over the last few years and there is a growing trend for large organizations to consider hiring professionals to prevent this issue and also to reduce the pressure and the potential of occupational fraud (Mansor & Abdullahi, 2015). Regarding this, fraud detection is a crucial field which remains in a continuous development. Whenever it becomes known that one detection method is in place, criminals adapt their methods and use other ways to accomplish their goals. This means that the newest detection tools must be applied as well as the latest developments (Bolton & Hand, 2002). In assurance, fraud is a main area of study and detecting accounting fraud has always been a problem for accountants (Elkan, 2001). As Wang (2010) argued, model fraud detection is better than an auditor detecting fraud rate without assisting.
Having this in mind, techniques using Statistics or Data Mining are the future of this area, since they provide effective technologies for fraud detection (Bolton & Hand, 2002). About the Data Mining field, like Kirkos, Spathis, and Manolopoulos (2007) stated, it is an iterative process and it is most useful in an exploratory analysis scenario in which there are no predetermined notions about what will constitute an “interesting” outcome, which is the case in this study. Related to Statistical analysis, it is possible to implement regression models that estimate the likelihood of fraudulent financial reporting, conditioned by the presence or absence of several fraud-risk factors (Bell & Carcello, 2000). Related to fraud-risk factors, there is the Fraud Triangle theory, developed by Cressey (1973), where three main criteria must be present for fraud to occur: pressure, opportunity and rationalization.
Fraud in corporations is a topic that receives significant and growing attention from regulators, auditors, and the public (Kassem & Higson, 2012). In this regard, and since fraud is a wide field, the specific theme under study is fraud in company’s purchases in the utilities sector. The main goal is to define an analytical model that helps understanding the most relevant variables to be considered to uncover fraud. To achieve this goal, some variables will be determined, as well as the specific methods to analyse the data.
2
1.2. S
TUDYO
BJECTIVESSince the specific theme of this project is fraud in company’s purchases in the utilities sector, the main goal is to define an analytical model that helps to understand the most relevant variables to be consider to uncover fraud.
The main question of this study is: “What are the most significant variables to detect fraud in company’s purchases, specifically in the utilities sector?”
Specific objectives:
1. Evaluation of fraud cases in a company from the utilities sector and analysis of the methods used to detect it in these cases;
2. Selection of variables that may be relevant in detecting fraud in a company from the utilities sector;
3. Application of models using Data Mining and Linear Regression techniques through variables considered relevant in a company specific case;
4. Presentation of a model with relevant variables to detect of fraud in the sector aforementioned.
1.3. S
TUDYR
ELEVANCE ANDI
MPORTANCEFinancial crime and fraud have probably existed since the beginning of commerce (Woodward, Orlans, & Higgins, 2003). In fact, recent surveys announce that fraudulent behaviour consumes an estimated 5% of the typical organization’s annual revenue (ACFE, 2016).
Having this in mind, and according to Hawlova (2013), in the business areas where employees get in contact with money, there is a possibility that the financial resources are not spent effectively, and it could lead to a financial loss for the company.
In this regard, it is necessary to have updated models to prevent fraud through the use of measures that can stop fraud to occur in the first place. Also, when it is not possible to prevent fraud from happening, it is necessary to have models and ways to detect fraud as quickly as possible once it has been perpetrated.
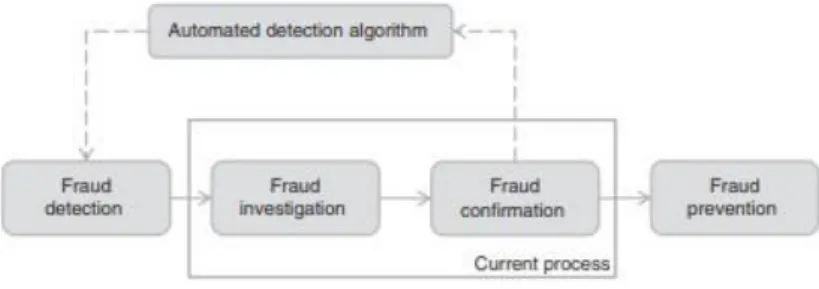
On this subject, according to Baesens, Vlasselaer, and Verbeke (2015), there is a fraud cycle that depicts four essential activities, as it is shown in the following figure:
Figure 1.1 – The Fraud Cycle
3 So, after applying the detection models, if a suspicious case arises, a fraud investigation starts in order to confirm the accusations, possibly involving field research. Finally, the last step involves fraud prevention, which makes it possible to avoid the whole process, if a successful prevention model is applied.
The main risk of fraud in a company are known from previous studies. However, there is clearly a gap regarding fraud detection in purchases of a company from the utilities sector. This specific area was not conveniently explored yet, since there are not so many studies available.
As Behling, Floyd, College, Smith, and Koohang (2009) affirmed, “fraud is not going away” and, for this reason, it is important to continue studying variables that may be important for fraud detection. Since once a fraud detection method is discovered by a fraudulent individual, a need for searching another way to detect fraud is crucial.
Having these facts in mind, the present study aims to fill this gap by providing an analytical model where the main variables concern this field of business. Thus, this study also strives to provide new perspectives and methodologies to understand the reasons why fraud happens and try to improve the methods to avoid it.
4
2. LITERATURE REVIEW
2.1. C
ONCEPTS OFF
RAUDThe term fraud has multiple definitions which have been quite similar over the years. According to Wang (2010), fraud can be defined as the abuse of a profit organization’s system without necessarily leading to direct legal consequences. Another definition is given by the Concise
Oxford English Dictionary as a criminal deception intended to result in financial or personal gain.
Manurung and Hadian (2013) defined fraud as “any act, expression, omission, or concealment
calculated to deceive another to his or her disadvantage, specifically, a misrepresentation or concealment with reference to some fact material to a transaction that is made with knowledge of its falsity”. In fact, defining fraud has always been a difficult task, and it is not a recent issue.
However, this is becoming an increasingly complex challenge for business organizations due to today’s dynamic environment (Mangala & Kumari, 2015).
The wave of financial scandals in this century elevated the awareness for fraud (Kerr & Murthy, 2011). Even with public examples of this issue, it is not easy to detect fraud from the beginning, as fraud behaviours are often subtle at first (Chivers, Clark, Nobles, Shaikh, & Chen, 2010). According to EY’s Global Fraud Survey of 2018 (EY, 2018), 11% of companies have experienced significant fraud in the last two years. It is stated in this report that, although fraud and corruption remain more prevalent in emerging markets, there is still a minority of respondents that reported fraud in developed markets. EY also observed that younger respondents are more likely to justify fraud to meet financial targets or to help the business survive an economic downturn. The statistics demonstrated that 1 in 5 respondents aged under 35 justify cash payments against 1 in 8 respondents aged 35 and over (EY, 2018).
According to Mansor (2015), fraud prevention should be the main focus because it is more effective to prevent fraud from happening than to detect it. In this regard, Ruankaew (2016) stated that it is important for business organizations to identify the factors that lead to fraudulent behaviour as well as identifying who are the fraudsters. In this way, to prevent fraud, regulations play an important role, especially auditors, as they are responsible for assessing the risk of fraudulent financial reporting adequately (Srivastava, Mock, & Turner, 2008). To develop their expectations, auditors employ analytical review techniques, which allow the estimation of account balances without the need of examining individual transactions (Fraser, Hatherly, & Lin, 1997). On this matter, they are also estimating the possibility of management fraud. Although Ramos (2003) agreed about the importance of auditors, he explains that the tendency of auditors in looking at current numbers, without considering the past, is one of the reasons for failure in the detection of material misstatements. In fact, auditors must be alert about possible evidences of fraud, starting with fraud risks (Ramos, 2003). A fraud risk factor is an event or condition that tracks the three conditions of the fraud triangle. Although fraud risk factors do not necessarily indicate that fraud exists, there are often warning signs where it does (Kerr & Murthy, 2011).
Nevertheless, detecting fraud is a difficult task as there is no commonly accepted definition of reasonable assurance. Furthermore, the limitations of audit methods and the cost constraints also explain this difficulty (Spathis, 2002) (Hogan, Rezaee, Riley, & Velury, 2008). Through the years, various theories have attempted to explain the causes of fraud and the two most important and cited theories are the Fraud Triangle Theory (FTT), developed by Donald Cressey,
5 and Fraud Diamond Theory (FDT), investigated by Wolf and Hermanson. In both theories, some elements, which lead perpetrators to commit fraud, were identified and studied.
2.1.1. Fraud Triangle Theory and Fraud Diamond Theory
Cressey was the first person to think about the Fraud Triangle Theory, in 1950. He was a criminologist that started to study this subject by believing that there is always a reason behind everything people do (Mansor & Abdullahi, 2015). He developed his study by interviewing 250 criminals, in a period of 5 months, whose behaviour matched in two criteria:
• Initially, people are accepting responsibilities of trust in good faith; • Circumstances make them violate the trust.
Having this in mind, the fraud triangle is a model that explains the factors that cause someone to commit occupational fraud. It is composed by three components, which together lead to possible fraudulent behaviours (Cressey, 1973). The top element of the triangle represents the pressure or motive to commit the fraudulent act while the two elements at the bottom are perceived as opportunity and rationalization (Kassem & Higson, 2012). Therefore, this model is built on the premise that fraud is likely to result from motivation, opportunity and rationalization.
First, the individual may have an incentive or be under pressure to commit fraud. This element refers to the factors that lead to unethical behaviours (Kassem & Higson, 2012). Lister (2006) stated that there are three types of pressure, which are personal, employment stress and external pressure. Besides that, Murdoch (2008) also argued that the pressure could be related to financial, non-financial, political and social factors. Also related to pressure, Kaplan (2001) stated that the desire to meet analysts’ forecasts is one of the external incentives with more impact in committing fraud. In fact, a study developed by Young (2000) concludes that 43% of the fraud cases analysed were related to the desire to meet analysts’ forecasts. Other incentives or pressures may result when financial stability or profitability is threatened by economic, industry, or the entity’s operating conditions (Huang, Lin, Chiu, & Yen, 2016).
The second risk factor associated to the fraud triangle is opportunity. The circumstances may be conductive to provide an opportunity for fraud to be perpetrated. Opportunity is created by ineffective controls that allow an individual to commit organizational fraud (Mansor & Abdullahi, 2015). Some companies are more liable to be defrauded because of weak internal controls, poor security over company property, or unclear policies considering the presumed acceptable behaviour. In fact, Cressey (1973) even stated that, the lower the risk of being caught, the more likely it is that fraud will take place. Furthermore, Srivastava, Mock, and Turner (2005) argued that, even when the pressure is extreme, financial fraud cannot occur unless an opportunity is present.
Finally, there may be an attitude or rationalization for committing fraud (Huang et al., 2016). Those involved in a fraud are able to rationalize a fraudulent act as being consistent with their personal ethical values. Some individuals possess an attitude, character or set of ethical values which allows them to knowingly and intentionally commit a dishonest act (Huang et al., 2016). Michele J. Hooper and Cynthia M. Fornelli (2010) even stated that individuals who commit fraud possess a particular mind-set that allows them to justify or excuse their fraudulent actions, leading to a clear conscience. Cressey (1973) observed that individuals who commit fraud desire
6 to remain within their moral comfort zone. Therefore, at least internally, the fraudster seeks to justify the fraudulent action before the first fraud act. Cressey (1973) noted that fraud perpetrators do not want to be considered trust violators, but rather consider their dilemma as a special exception, a situation that allows them not to view themselves in a negative manner. Regarding this last risk factor, it is not possible to know with certainty a person’s ethical standards and beliefs (Ramos, 2003). However, other studies have shown that adequate business and economics education may actually cause a decline in moral behaviour, because such programs can increase self-interested behaviours in some individuals and thereby encourage unethical practices and fraud (Huang et al., 2016). To conclude about this factor, Howe & Malgwi (2006) stated that a bridge between pressure and opportunity is created when an individual can rationalize the fraudulent behaviour.
Related to fraud triangle theory, Hollinger and Clark (1983) posited the following relationships: 1. There is little correlation between personal income levels and fraud. Income does not
appear to be a predictor of theft, which means that employees from all income levels commit fraud;
2. There is a positive correlation between job dissatisfaction and employee deviance, including fraud;
3. There is a negative correlation between controls and incidences of employee deviance. Therefore, Cressey (1973) concluded that even an upstanding and professional individual may commit fraud when they have a non-sharable financial challenge, a perceived opportunity to steal with little fear of detection and a morally defensible excuse.
The fraud triangle provides an efficient conceptual model that has broadly served as an aid to the anti-fraud community in understanding the antecedents to fraud (Dorminey, Scott Fleming, Kranacher, & Riley, 2012).
Considering this, David T. Wolfe (2004) developed another theory denominated “The Fraud Diamond”, that is considered an expanded version of the FTT. The author argued that the fraud triangle could be enhanced to improve both fraud prevention and detection by considering a fourth element, capability. The Fraud Diamond modifies the opportunity side of the fraud triangle, because without the capability to exploit control weaknesses for the purpose of committing and concealing the fraud act, no fraud can occur (Wolfe & Hermanson, 2004). Opportunity opens the door to fraud, incentive and rationalization draw the fraudster closer to the door, but the fraudster must have the capability to recognize the opportunity to walk through that door to commit the fraudulent act and conceal it (Dorminey et al., 2012).
This extra factor plays an important role since it is where the fraudster recognizes a particular fraud opportunity and ability to turn the intention of fraud into reality (Mansor & Abdullahi, 2015). In fact, David T. Wolfe (2004) even stated that position, intelligence, ego, coercion, deceit, and stress, are the supporting elements of capability. Furthermore, some investigators even considered that this element is particularly important when it concerns a large-scale or long-term fraud (WS Albrecht, Wernz, & Williams, 1995). About the position and role of the fraudster, David T. Wolfe (2004) argued that the position of the employee may facilitate his or her way to breach the organizational trust.
According to the ACFE 2016, and quoted by Mansor (2015), 51% of the criminals of occupational fraud had at least a bachelor’s degree, and 49% of the fraudsters were over 40 years old. This investigator also stated that managers or executives were responsible for 46% of the frauds. In
7 fact, the fraudster has a strong ego and believes that he will not be detected (Mansor & Abdullahi, 2015). Regarding this, Duffield and Grabosky (2001) noted that one of the most common personality characteristics among fraudsters is the high ego, that is to say that an egoistic person refers to someone who is “driven to succeed at all costs and narcissistic”. Considering this extra factor of the FDT, the role of the anti-fraud professionals is extremely important. The essential traits necessary for committing fraud, especially for large sums over long periods of time, include a combination of intelligence, position, ego, and ability to deal well with stress (Dorminey et al., 2012). The person’s position or role within the organization may furnish the ability to create or exploit an opportunity of fraud. In this regard, the potential perpetrator must have sufficient knowledge to understand and exploit internal control weaknesses and to use position, function, or authorized access to his or her advantage (Dorminey et al., 2012). On this point, the FDT is considered an extended version of the FTT with an extra element to the basic components of the FTT (Mansor & Abdullahi, 2015).
Cressey (1973) observed that a fraudster’s internal moral conflict often appears to be a temporary dilemma. After the criminal act has taken place, especially if the fraud has taken place for a long period of time, the rationalization will likely be cognitively dismissed. As the act is repeated, the perpetrator becomes de-sensitized and carefree (Cressey, 1973).
Considering this, and according to the conclusions stated by Duffield and Grabosky (2001), the risk of fraud is a product of both personality and environmental variables, and this has two implications for understanding fraud risks. It means that the propensity for individuals to commit fraud will vary even when they are subject to similar environmental pressures.
2.1.2. Fraud Prevention and Detection
Nowadays, and according to EY Global Fraud Survey of 2018, one-third of business leaders see fraud and corruption as one of their greatest risks. In fact, since the business is becoming more digital day by day, the fraudsters are getting more strategic and sophisticated in their methods (EY, 2018).
Considering statistics from EY’s Global Fraud Survey of 2016, it was found that:
▪
13% of the CFOswould offer cash payments to win or retain business while 16% of other finance team members would have this attitude;▪ 9% of CFOs would be prepared to backdate contracts against 8% of other finance team members;
▪ 36% of CFOs could rationalize unethical conduct to improve financial performance while 46% of other finance team members would do this (EY, 2016). Considering this, it is highly relevant that CFOs and senior members of finance teams are exemplary and committed to prevent and detect fraud (EY, 2016).
In this sense, fraud prevention and ways to detect fraud are increasingly more relevant. Fraud prevention describes measures to stop fraud from occurring in the first place. Fraud detection involves identifying fraud as quickly as possible once it has been perpetrated (Bolton & Hand, 2002). In fact, Dilla and Raschke (2015) even stated that successful fraud detection methods
8 depend on the investigator’s ability to detect patterns in data that are suggestive of fraudulent transactions.
In fact, fraud risk assessments can help organizations to prevent this kind of problems by identifying the specific frauds they need to look for (Dilla & Raschke, 2012).
In order to prevent fraud, anti-fraud measures should be implemented, and professionals must be trained for several situations. Generally, anti-fraud measures can be described as efforts at prevention, deterrence, and detection. Prevention reduces the probability of fraud mainly by the reduction of opportunity. One way to prevent fraud may be through the segregation of duties, which is considered by some investigators as a fundamental anti-fraud key mechanism (Dorminey et al., 2012). Related to deterrence, this factor refers to creating environments where fraud is less likely to occur. In fact, the two most powerful deterrents are believed to be the fear of getting caught (detection) and the fear of repercussions (punishment) (Dorminey et al., 2012). Regarding the anti-fraud environment, examples of deterrence include efforts to create workplace integrity, ethical tone at the top, whistle-blower hotlines, and whistle-blower protections. Detection procedures are used primarily to discover the crime, but if employees are aware that rigorous detection procedures are in place, these measures may become a form of deterrence (Dorminey et al., 2012).
Regarding the controls of the organization, and because of the inherent limitations on the effectiveness of them, the risk of fraud can be mitigated but not completely eliminated. Therefore, companies typically employ two strategies to mitigate fraud risks: controls that focus primarily on deterring potential fraud and controls to detect fraudulent activity (Michele J. Hooper; Cynthia M. Fornelli, 2010). Controls to deter fraud are designed to ascertain and mitigate the forces that can enable fraud, while detective controls generally focus on the timely identification of fraud that has occurred (Michele J. Hooper; Cynthia M. Fornelli, 2010). In fact, some controls, such as a whistle-blower program, deter fraud by their presence and help detect incidents of fraud. Still regarding internal controls, Jans et al. (2007) explained that there are active and passive internal controls. Active internal controls can be signatures, passwords and segregation of duties, while passive internal controls can be surprise audits, customized controls and audit trails.
Considering this, the development of new fraud detection methods is difficult because the exchange of ideas in fraud detection is limited, due to security and privacy concerns (Sahin, Bulkan, & Duman, 2013). In fact, it would not be safe to describe fraud detection techniques in a public domain, as it would give criminals the information that they need to evade detection (Bolton & Hand, 2002). Having this in mind, there are more reasons that explain why detecting fraud is an extremely difficult task, such as the fact that the data sets are constantly evolving, causing the profiles of normal and fraudulent behaviours to remain in constant change (Bolton & Hand, 2002). Another reason is the fact that data sets are not available, and the results are often censored, making them difficult to assess.
Consequently, appropriate fraud detection methods are increasingly more important. The data that a company holds is extremely relevant to identify events of potential fraud but it is necessary to transform data into information, to really understand if the alerts are in fact cases of fraud (EY, 2018). With the constant improvement of fraud techniques, as well as technology resources becoming more irreplaceable for corporate organizations, suitable detection methods must be applied and updated all the time.
9 In conclusion, it is important to have in mind that the analysis of possible cases of fraud should give an alert when a situation is anomalous, in order to be investigated in more detail.
2.1.3. Purchase Fraud in Utilities Sector
The risks associated with purchasing fraud go beyond monetary losses; fraud allegations also put an organization’s reputation at risk. Designing and implementing an effective internal control environment helps reducing the risk of fraud, which includes a variety of policies, procedures, strategies and tactics (Mann, 2013).
The ACFE defines a kickback scheme as giving or receiving anything of value to influence a business decision without the employer’s consent. These schemes, which involve collusion between employees and vendors, typically include submission of invoices for goods or services that are either overpriced or completely fictitious (Mann, 2013). Kickback schemes may be originated at any level within the organization, from executives to ordinary employees, since the only need is to have enough ability to influence purchasing decisions.
Purchasing fraud can be very difficult to prevent and to detect because, for example, if a vendor is simply increasing the price of each item purchased by small amounts, it could be unnoticed for years. Furthermore, if an employee with a high level of control over the purchasing process is involved, it could be unnoticed indefinitely (Mann, 2013).
A study developed by Julie Quink (2018) indicated the following statistics: ▪ 10% of employees would never commit fraud;
▪ 10% of employees are actively exploring ways to commit small-scale fraud against their employer, which could include small-scale theft of supplies and other materials;
▪ 80% of employees would never commit fraud unless certain factors are present. Fraudulent acts can damage an organization’s reputation with customers, suppliers, and the capital markets (Singh, 2017). Concerning this, the power and utilities sector today faces many challenges. These include governance concerns, demands of the stakeholders involved, pricing pressure, market violability and fluctuating performances. These challenges have increased the propensity of bribery and corruption risks (Singh, 2017).
According to Singh (2017), some of the fraud risks that organizations in this sector face and the measures to mitigate them are as follows:
1. Bribery and corruption: Conducting business in the power and utilities sector entails numerous approvals to build and operate establishments. This could make the sector vulnerable to bribery and corruption risks;
2. Fraud losses: High capital expenditure (capex), operating expenses (opex) and widespread distribution channels, which involve multi-jurisdiction transactions, could make the sector prone to fraud losses as well. Some of the areas where organizations could lose revenue are capex and opex procurements, where the quantities and value of purchases may be inflated to favour vendors, power theft and leakages in distribution channels, collection losses and bad debts (Singh, 2017).
10 3. Financial reporting frauds: The pressure to show and maintain profitable growth and margins, especially on early to mid-stage start-ups, could increase the risk of financial misreporting or window dressing, including deferment of costs, misclassification of opex by capitalizing it or revenue recognition that is not in line with the accounting standards or principles. These frauds are typically perpetrated by employees in senior or decision-making positions and are camouflaged to avoid detection (Singh, 2017).
While it may not be possible to completely eliminate these risks, taking measures to proactively mitigate and isolate the organization from them, is seen as an uptick.
2.2. T
ECHNIQUES FORF
RAUDD
ETECTIONThe purpose of using techniques to detect fraud is to identify general trends of suspicious or possible fraudulent behaviours (Wang, 2010). In fact, the data analysis should be regarded as alerting the analyst to the fact that an observation is anomalous or more likely to be fraudulent than others, so that can be more examined in detail (Bolton & Hand, 2002).
Considering the study of fraud, techniques using Statistics or Data Mining are the future of this area, since they provide effective technologies for fraud detection (Bolton & Hand, 2002). In this regard, these two types of techniques will be analysed in the literature review.
About Data Mining field, like Kirkos et al. (2007) stated, it is an iterative process and it is most useful in an exploratory analysis scenario in which there are no predetermined notions about what will constitute an “interesting” outcome, which is the case in this study. Methods like Decision Trees and Neural Networks will be analysed.
On the other hand, statistical analysis is essentially based on comparing the observed data with expected values (Bolton & Hand, 2002). It is possible to implement regression models that estimate the likelihood of fraudulent financial reporting, conditioned by the presence or absence of several fraud-risk factors (Bell & Carcello, 2000). In fact, some studies were developed regarding regression models and, according to Bell and Carcello (2000), a simple linear model may outperform the auditors in terms of the fraud risk assessment.
One of the difficulties with fraud detection is that typically there are many legitimate records for each fraudulent one. In fact, and according to Bolton et al. (2002), fraud can be reduced to as low a level as one likes, but only by virtue of a corresponding level of effort and cost. In this regard, some methods will be reviewed in the next subchapters.
2.2.1. Statistical methods
Statistical tools for fraud detection are many and varied since the type of data changes case to case. In this sense, this kind of methods are usually based on comparing the observed data with expected values. In this case, things are often further complicated because a given actor may behave in a fraudulent manner some times and not other times (Bolton & Hand, 2002).
Considering statistical fraud detection methods, it is possible to define supervised and unsupervised approaches. In supervised methods, samples of both fraudulent and nonfraudulent records are used to construct the model. In this sense, it is required to have
11 examples from both classes and it can only be used to detect fraud which has previously occurred (Bolton & Hand, 2002). Hawlova (2013) explains this method in another way, by stating that is based on examples from the past that are used to prepare and “train” the statistical model which then calculates the probability of fraud to occur. In these kind of approaches, it is possible to construct linear regression models that attempt to discover the relationship between independent variables and a target variable (also called dependent variable) (Ramos, 2003). Considering this, the regression technique is typically used to the detection of corporate fraud, which is the case of this particular study (Ngai, Hu, Wong, Chen, & Sun, 2011). Some examples of this method are linear discriminant analysis and logistic discrimination.
On the other hand, unsupervised methods are based on the searching of outliers in the dataset, that is, the observations most dissimilar from the norm. In fact, it is not certain that a case of fraud is discovered but the analysis in this kind of methods is regarding to alert to the fact that an observation is anomalous, and it needs to be investigated in more detail (Bolton & Hand, 2002). This kind of method is used when there are no prior sets of legitimate and fraudulent observations. A baseline distribution that represents normal behaviour is modelled and then the objective is to detect observations that show the greatest departure from this norm (Kou, Lu, Sirwongwattana, & Huang, 2004). Examples of such method is digit analysis using Benford’s law and also clustering. Benford’s law states that the distribution of the first significant digits of numbers drawn from a wide variety of random distributions will have asymptotically a certain form (Hill, 1995). Regarding clustering, data with the same characteristics are organized in small groups – clusters. Within these groups, there are then identified entities with features that differ most from the others in different clusters (Hawlova, 2013).
The intent of using a mathematical model for fraud detection is to determine whether there is statistically significant evidence that a claim is likely to be fraudulent or not. A linear model can help to identify claims that have a higher likelihood of fraud potential, prioritizing the claims that need to be investigated (Wilson, 2009).
Although the basic statistical models for fraud detection may be categorized as supervised or unsupervised, the application areas of fraud detection are very diverse and according to the variety and quantity of data available, it is necessary to choose the most suitable fraud detection tool (Bolton & Hand, 2002).
2.2.2. Data Mining methods
Nowadays, information is stored in databases and it is crucial to turn these data into knowledge. This creates a demand for new, powerful tools, according to Jans et al. (2007).
Data Mining is defined by Bose and Mahapatra (2001) as a process of identifying interesting patterns in databases that can then be used in decision making. Other investigators define DM as “the process of discovering patterns in data. The process must be automatic or (more usually)
semi-automatic” (Witten & Frank, 2005). In fact, and considering this last definition, if data
mining results in discovering meaningful patterns, data turns into information. In this regard, data mining is considered a complex process involving iterative steps, including the selection of the dataset, its cleansing and analysis and finally an interpretation of the information that the data gave, which will be transformed into knowledge (Bose & Mahapatra, 1999). Using DM techniques to detect fraud is common and since they are known for the advanced classification
12 and prediction capabilities, DM techniques can easily facilitate auditors’ job regarding the accomplishment of management fraud detection (Kirkos et al., 2007).
Considering this, some techniques regarding DM will be approached and explained in more detail in the following subchapters.
Linear Regression
One of the statistical concepts used as basis for data mining techniques is Linear Regression. This technique is commonly used because it is appropriate to evaluate the strength of a relationship between two variables (Bakar, Mohemad, Ahmad, & Deris, 2006). When Linear Regression models are used, one of the main goals is to minimize the error, in order to obtain the best model possible (Fugon, Juban, & Kariniotakis, 2008). In this regard, this type of models are very flexible, and they may give good results even if the dependency of the variables is only approximately linear or the other attributes are weakly correlated (Wilhelmiina Hämäläinen & Vinni, 2010). Considering this, these models are useful when data does not contain empty values as well as a small number of outliers (Huber & Ronchetti, 1981).
Decision Trees
Decision Trees (DT) are data based classification models and, basically, it is a tree structure, where each node represents a test on an attribute and each branch represents an outcome of the test. In this regard, observations are divided into mutually exclusive subgroups (Kirkos et al., 2007). The sample is successively being divided into subsets, until either no further splitting can produce statistically significant differences.
For this type of classification models, a set of structured examples with non-categorical variables – the inputs – and one categorical variable – the output – are required. Then, the goal is to find a model, namely decision tree, that can correctly classify to what category the non-categorical data presented with new values belongs to. Related with the type of variables that input and output are, the first one may be continuous or discrete while the type of the output is discrete, and in general binary type. This means that the variable assumes values 1 or 0, which represents if it belongs or not to a category, respectively (Filho et al., 2004).
Generally, the decision tree algorithms use a set of training data and then a set of rules is created, expressing what is known about the problem. After the decision tree is trained, it is necessary to verify if it is classifying correctly the new data. In order to check the algorithm performance, a test data set is presented, and its outcome will represent the evolution of the classification model (Filho et al., 2004).
Using Decision Trees provides a meaningful way of representing acquired knowledge and make it easy to extract IF-THEN classification rules (Kirkos et al., 2007).
Neural Networks
A Neural Network (NN) is a popular way to build a classification model by finding any existing patterns on the input data. NNs are adaptive, allow the creation of robust models and they also
13 do not require rigid assumptions like normally distributed data, often made in other statistical techniques (Green & Choi, 1997).
A NN consists of a number of neurons, i.e., interconnected processing units, and, associated with each connection is a numerical value – “weight”. The workflow of the NN is that each neuron receives signals from connected neurons and the combined input signal is calculated, where the total input signal for neuron 𝑗 is 𝑢𝑗= ∑ 𝑤𝑖𝑗∗ 𝑥𝑖, where 𝑥𝑖 is the input signal from neuron 𝑖 and 𝑤𝑖𝑗 is the weight of the connection between neuron 𝑖 and neuron 𝑗 (Han, 2015). So, briefly, data first enters the network through nodes in the input layer; while input nodes pass data to nodes in the next layer, subsequent hidden and output nodes both receive and process all inputs (Green & Choi, 1997).
Neurons are arranged into layers and a layered network consists of at least an input (first) and an output (last) layer – it is possible that hidden layers exist between these two layers. There are two types of architecture for NN: self-organizing maps (SOM) and backpropagation NN. Concerning the first type, there are only one input and one output layer, whereas the second one has additionally one or more hidden layers.
Considering that backpropagation network is the most popular for prediction and classification of problems, it will be analysed with more detail. In this regard, and after the network architecture is defined, the network must be trained. Thus, a pattern is applied to the input layer and a final output is calculated at the output layer. Then, the output is compared with the expected result and the errors are propagated backwards in the NN by tuning the weights of the connections in the training process. Concerning the errors, all connection weights are assumed to be responsible for an output error, defined as the difference between a network’s estimated/predicted value and the corresponding observed output value (Sohl & Venkatachalam, 1995). This process iterates until an acceptable error rate is reached (Kirkos et al., 2007).
Therefore, the NN modeler has to decide when the node’s output is correct. The practice of training is to obtain output node(s) below or above certain threshold(s) – values between the set thresholds can be defined as unknown. If nodes are below or above correct thresholds, then training stop and the modeler should interpret the results (Green & Choi, 1997).
Neural Networks are popular algorithms because they do not make assumptions about attributes’ independence and they are also capable of handling noisy or inconsistent data. In fact, NN is a suitable alternative for problems where other algorithmic solutions are not applicable (Sohl & Venkatachalam, 1995).
The development of a robust and reliable classification model for fraud may contribute to satisfy auditor’s increased responsibility for fraud detection through an effective risk assessment tool, improving his work (Green & Choi, 1997).
14
3. METHODOLOGY
Davia, Coggins, Wideman, and Kastantin (2000) compared the art of fraud detection with the art of fishing by saying the following: “Expert fishermen never simply go fishing for fish. Rather, they
first decide what type of fish they have a taste for. Next, they decide the how, with what equipment, and where they will expertly search for that type of fish and that type alone”.
Considering this, it is important to decide what sort of fraud is under investigation in this study. Since fraud is a wide field, the specific type of fraud chosen to be under study is fraud in company purchases in the utilities sector. The data used will be provided by a company that will not be revealed throughout the study and it will be denominated “Alpha” from now on.
Alpha is a company with more than a decade of history and, along the years, suffered many concessions. Considering that only a part of data from Alpha will be used, from 2015 July until 2018 August, it is important to refer some numbers:
▪ 146 subcompanies will be considered in the analysis as well as 423 suppliers; ▪ 6.774 purchases orders will be contemplated in this study;
▪ 32 approvers of purchases orders will be analysed;
▪ The total amount of the purchases orders under study is €12.534bn while the billed amount is €10.713bn.
In this regard, the main goal of this study is to define an analytical model that helps to understand the most relevant variables to be considered to uncover fraud.
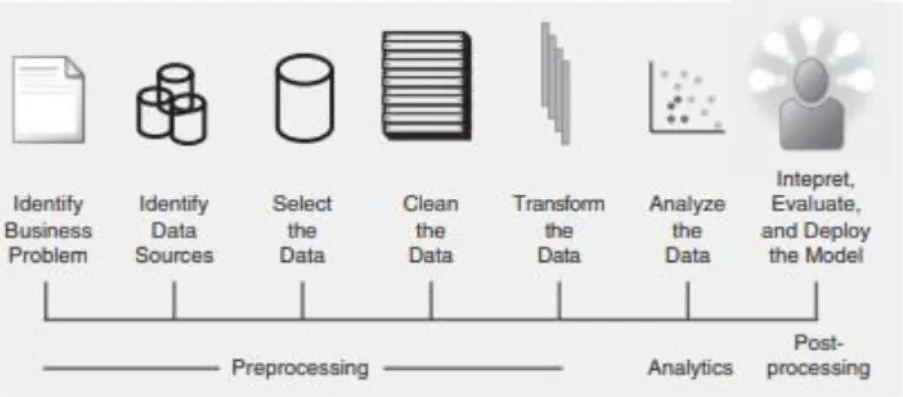
So, it is relevant to define the methodology that will be used. Erro! A origem da referência não
foi encontrada. provides an overview of the analytics process model proposed by Baesens et al.
(2015) and this study will consider the same organization, intercalated with SEMMA methodology from the “Analysed the Data” step.
Figure 3.1 - The Fraud Analytics Process Model
Source: Fraud: Detection, Prevention, and Analytics (Baesens et al., 2015)
Considering that the business problem under study is fraud, the next step was to collect the data from Alpha. Since this company has as ERP the SAP software, the collection was carried out directly from the systems of Alpha. Besides that, some data was obtained directly by the company administrator, since it was not available on SAP. After this, the selected data was cleaned and transformed. Finally, an analysis of the data was performed in order to interpret, evaluate and deploy the model, using SAS.
15
3.1. A
PPLIEDM
ETHODOLOGY3.1.1. Data Collection and Cleansing
As previously stated, the data was collected directly from SAP. First, the Materials Management (MM) module was extracted by parts because of the size of the data. The collection was made from year to year, since the full years of 2016 and 2017 were considered and the information was too large, sometimes these extracted by quarters. This is the most important source of data for this study and, because of that, it is important to define what MM is. MM module in SAP is responsible for controlling all the processes of acquisition of products, goods and services, in addition to efficiently managing stock control of the companies.
After this, the Financial Accounting module was extracted in the same way as the MM. Yet, this module was only extracted for precaution, since the data will not be used.
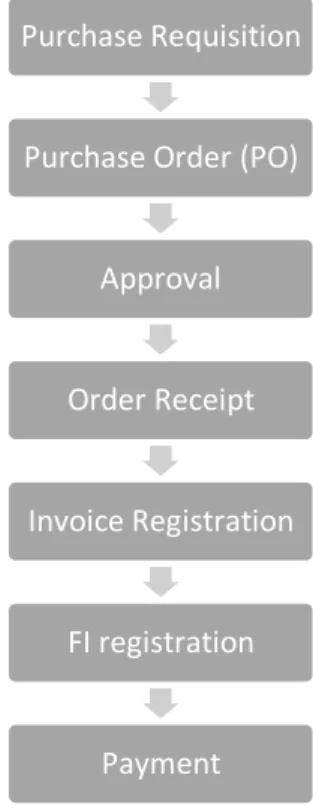
In this regard, and considering the collected data from MM and FI modules, the purchases diagram of this company is as followed:
Figure 3.2– Purchase Diagram of Alpha Source: Author
Still regarding the purchase process of Alpha, it is important to note that a purchase order may have more than one line of products, which means that the database extracted does not have a unique id per line but a group of lines that correspond to the same PO.
In this regard, after completely understanding the purchase process, it was asked Alpha to provide information about the approvers and the respective values that they are authorized to approve. In this regard, two tables were given with the information of the approvals limit: one considering 2015 and 2016, and other related to 2017 and 2018. There are two tables because
Purchase Requisition
Purchase Order (PO)
Approval
Order Receipt
Invoice Registration
FI registration
16 between 2016 and 2017 there was a modification in the company that led to some changes regarding the approvers and their approval limits. In addition, it was also requested that was given information about the several subcompanies involved in the analysis, such as the name of the subcompany (that it was anonymized), the code of it and also the acronym of such subcompany. Still about the data collection, some documents, regarding legal issues and information about the changes within the Alpha company, were made available to better understand this business.
Subsequently after the collection, it was necessary to apply a process of cleansing of the data since there was information that was not necessary to the study. This process was done using Microsoft SQL Server Management Studio 2012 since it was the easiest and most efficient way to treat the data.
Then, since it is necessary to maintain the confidentiality of the company under study, the data was anonymised, as it will be explained soon. In this regard, related to the approvers and PO creators, their usernames were replaced by another name, more generic and unrecognizable. Additionally, a target variable was created to evaluate between 0 and 5 the risk of fraud. Having this in mind, and before explaining how the analysis was performed as well as the construction of the models, the transformations made regarding new variables and anonymization of the data, as well as the definition of the target variable, will be explained in order to facilitate the use of SAS tools.
3.1.2. Data Transformation
In this study, in order to maintain the anonymity of the company, some variables were transformed. In the database, there is information about the process of purchase of Alpha but some variables, such as the year, purchase order, or purchase/billed amount, were not necessary to anonymize since they did not reveal any important information about the identity of the company. Considering this, the following variables were anonymized:
▪ Supplier name: A set of names were randomly chosen and associated with the supplier names that are part of the database.
• PO Creator name: Starting with the original purchase order creator name, the first 3 letters were selected. Then, the last 2 letters of the PO creator names were picked. • Final Approver name: Starting with the original purchase order final approver name, the
first 3 letters were selected. Then, the last 2 letters of the PO creator names were picked. ▪ Subcompany name: A set of names were randomly chosen and associated with the
subcompany names that are part of the database.
▪ Region: The regions are associated with the subcompanies anonymized names, and they were randomly chosen.
After anonymizing those variables, a set of flags were created in order to indicate warnings of possible fraud. The flags created were:
▪ Flag_InvPOAmount: Flag that indicates 1 if the invoiced amount is higher that the PO amount, with a difference between these two fields of 100€. Otherwise, the field will be 0.
▪ Flag_POnotInv: Flag that indicates 1 if the PO does not have an invoice associated. Otherwise, the field will be 0.
17 ▪ Flag_GenericUser: Flag that indicates 1 if final approver is the Generic_User. Otherwise,
the field will be 0.
▪ Flag_NoLibInv: Flag that indicates 1 if the final approver is Sem Liberador. This means that there was not any approver to this PO. Otherwise, the field will be 0.
▪ Flag_ApprLimit: This flag evaluates if the liberators approved the PO amounts that they are allowed to approve. In order to distinguish between Generic_User approvals and others, it was necessary to give values as 0, 1 and 100, where this last value is regarding approvals by the Generic_User. On the other hand, the value 1 means that the approver approved a higher amount than the allowed. Finally, when the value is 0, the amount approved was between the expected limits.
▪ Risk Factor: This is the target variable and it was created based on the flags described above with the goal to evaluate the risk of fraud, with a classification between 0 and 5. In this regard, the variable construction was the following:
o Level 5 if all the above flags were positively classified; o Level 4 if one of the flags was classified as 0;
o Level 3 if two of the above flags were classified as 0; o Level 2 if just two flags were classified as 1;
o Level 1 if just one flag was classified as 1; o Level 0 if all the above flags were classified as 0.
Additionally, a variable that was also anonymized was the gender of the final approvers. Since there are no information about the name of the final approvers, the gender was defined before the importation in SAS. If it is a man the gender was classified as 0, while if it is a woman the gender was classified as 1. For the cases that the final approvers are Sem Liberador or
Generic_USER, the gender assumes the value 2.
In this regard, with all these transformations, as well as a selection of the relevant variables for the study, the next step was to use SAS to perform the analysis.
3.2. M
ODELLINGSAS Enterprise Miner has been developed to support data mining process, being an intuitive and dynamic tool. In fact, it provides unrivalled power in aggregating and transforming data, supporting virtually any modelling need (SAS Institue Inc., 2017).
In this regard, Enterprise Miner provides several tools to promote the process of data mining. This process is applicable across a variety of industries and provides methodologies for such diverse business problems as fraud detection, risk analysis or bankruptcy predictions.
The main benefits of using this program are: it supports the entire data mining process having available a large set of tools; it builds models in a faster way having an easy-to-use approach; the innovative algorithms improve the stability and accuracy of predictions; and it allows the analysts to promote business information and efficiently share results using a single easy-to-interpret framework (SAS Institue Inc., 2017).
Considering this, and since the tool used in this study is SAS Enterprise Miner, the first step was to select the dataset, previously clean. That is, some variables were eliminated since they had to many empty values and, some other variables were created in order to anonymize the data.
18 Additionally, like it was explained before, a target variable named RiskFactor was created, with five levels of risk of fraud.
The dataset was in Excel format and it was cleansed and modified in Microsoft SQL Server Management Studio 2012. Finally, it was imported to Enterprise Miner in order to construct the model. In this regard, after creating a project and a diagram, and defining a library, it was finally possible to import a data source in Enterprise Miner.
3.3. SEMMA
M
ETHODOLOGYSEMMA is the methodology that SAS proposed for developing DM products (Marbán, Mariscal, & Segovia, 2009). And, according to documentation of SAS, (SAS Institute Inc, 2013), SEMMA stands for Sample, Explore, Modify, Model and Assess. This process is described as:
▪ Sample: The data is sampled by creating one or more tables. The sample should be large enough to contain the significant information, but small enough to process.
▪ Explore: The data is explored by searching for anticipated relationships, trends and anomalies to gain understanding about the dataset.
▪ Modify: The data is modified by creating, selecting, and transforming the variables to focus on the model selection process.
▪ Model: The data is modelled by using analytical tools to search for a combination of data that predicts a desired outcome.
▪ Assess: The assessment is done by building charts to evaluate the usefulness and reliability of the findings from the data mining process.
Considering this, SEMMA is a methodology used in projects that are company oriented, and it helps providing solutions for business problems (Shafique & Qaiser, 2014). Since SEMMA offers an easy way to understand processes, allowing an organized and adequate development and maintenance of DM projects (Azevedo & Santos, 2008), this is the methodology chosen for this study.
3.3.1. Sample
The first step was to organize and understand the database structure. The main goal was to identify the data that was necessary to build the model, verify its quality (missing values, outliers), and obtain the variables that would be relevant for all the process.
Data Sources
In this study, there is one table to be considered in the analysis, that result from other tables and transformations previously made.
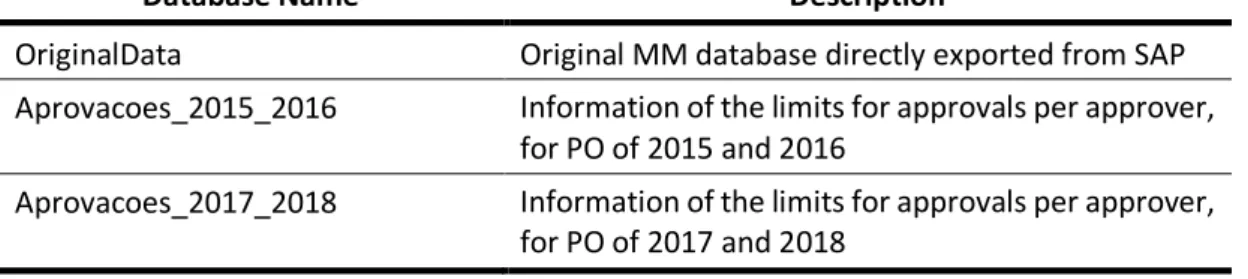
Considering this, the table mentioned before is DB_Alpha, that is a mixed of combination from three different tables described below:
19
Database Name Description
OriginalData Original MM database directly exported from SAP Aprovacoes_2015_2016 Information of the limits for approvals per approver,
for PO of 2015 and 2016
Aprovacoes_2017_2018 Information of the limits for approvals per approver, for PO of 2017 and 2018
Table 3.1 – Data sources information
These tables are the basis of DB_Alpha and they allowed the construction of this table with all the necessary information regarding the process of PO approvals. In this regard, the combination of these 3 tables allowed the creation of the flag Flag_ApprLimit, that is related to the approval limits. It is a result of the original data and the approval limits, resulting in 1 if the limit is exceeded or 0 if the approval is within the expected limits. About the other flags, they result in alerts to the possibility of fraud.
With all the necessary variables anonymized, DB_Alpha is the final database, used to build the predictive model, containing a target variable that indicates the risk of that transaction is fraudulent. The purpose of constructing this variable is that it will contribute to better measure and assess the model quality (Dean, 2014).
Having in consideration that each purchase order can generate more than one line of transactions, it was necessary to exclude some non-relevant attributes for the analysis, like invoice date or header of the purchase order, and to aggregate the amounts into a unique sum. This table was imported to SAS Enterprise Miner with 6.774 purchase orders targeted with a risk factor of fraud from 1 to 5.
Variables
The transformation of the data was through Microsoft SQL Server Management Studio 2012, using distinct queries to aggregate the tables mentioned above. Besides that, the new variables were added using this tool, through the establishment of conditions for each flag.
Considering that the goal was to have only one line for each PO, the numeric information (Invoice Amount and PO Amount) was summarized.
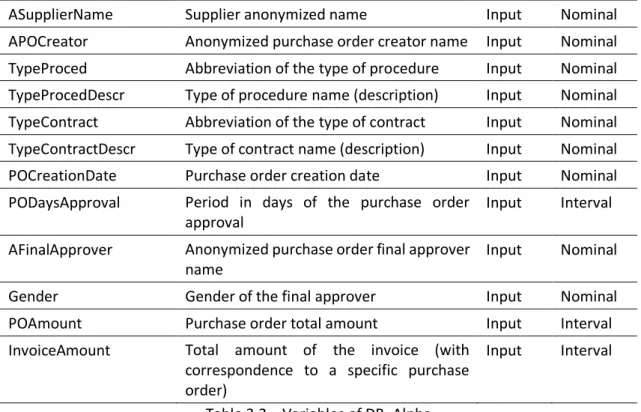
The explanation of the variables of the database DB_Alpha are as followed:
Variable Description Role Level
Year Variable based on the year of the purchase order date
Input Nominal
Purchase Group Purchase group code of the purchase order Input Nominal
PO_number Purchase order number ID Nominal
A_SubcompanyName Anonymized subcompany name Input Nominal
ARegion Anonymized region name Input Nominal
Contract Number of the contract, if it exists Input Nominal
20
ASupplierName Supplier anonymized name Input Nominal
APOCreator Anonymized purchase order creator name Input Nominal TypeProced Abbreviation of the type of procedure Input Nominal TypeProcedDescr Type of procedure name (description) Input Nominal TypeContract Abbreviation of the type of contract Input Nominal TypeContractDescr Type of contract name (description) Input Nominal
POCreationDate Purchase order creation date Input Nominal
PODaysApproval Period in days of the purchase order approval
Input Interval
AFinalApprover Anonymized purchase order final approver name
Input Nominal
Gender Gender of the final approver Input Nominal
POAmount Purchase order total amount Input Interval
InvoiceAmount Total amount of the invoice (with correspondence to a specific purchase order)
Input Interval
Table 3.2 – Variables of DB_Alpha
In addition to these variables, there are the flags mentioned before, as part of the database. The ones with values of 0 or 1 are classified as binary. The level of the others is nominal.
After having all the databases organized, the data was imported into the project on SAS Enterprise Miner, where roles and levels were defined for the selected variables. As referred above, the metric RiskFactor was defined as target variable, with 5 different levels of risk of fraud. Besides this, the variable PO_number was defined as the ID role while the remaining variables as Inputs. The levels for this table were identified considering if the variables were binary, interval or nominal. In the end, 25 variables were imported regarding DB_Alpha, distributed as shown in the table below (Table 3.3).
DB_Alpha
Role Nr of Variables
ID 1
Input 23
Target 1
Table 3.3 – Variables Role and Level Distribution
3.3.2. Explore
The second phase of the SEMMA methodology is directly related with making an exploratory data analysis. The main goal is to describe some characteristics of the dataset, including identifying missing values and outliers, as well as understand the value of each variable. DB_Alpha table has 23 input variables, where 3 are interval variables and 19 are class variables. In this regard, the exploratory analysis was separately performed considering these two groups of variables.
21
Interval Variables
By analysing the Interval Variables output (Table 3.4), it is possible to verify that there are not missing values in the dataset, which means that the process of data cleansing was effective. Another finding is related to possible outliers in some variables, observable through the distance between the mean and maximum values of the variables. For example, considering the POAmount variable, its mean value is approximately 8 times greater than the maximum value while the InvoiceAmount variable is about 6 times greater than the maximum value registered.
Interval Variable Mean Std. Deviation Missing Median
InvoiceAmount 1.581,635 9.651,492 0 260
POAmount 1.850,373 15.527,52 0 378,44
PODaysApproval 2,154 11,648 0 0
Table 3.4 – Statistics of Interval Variables
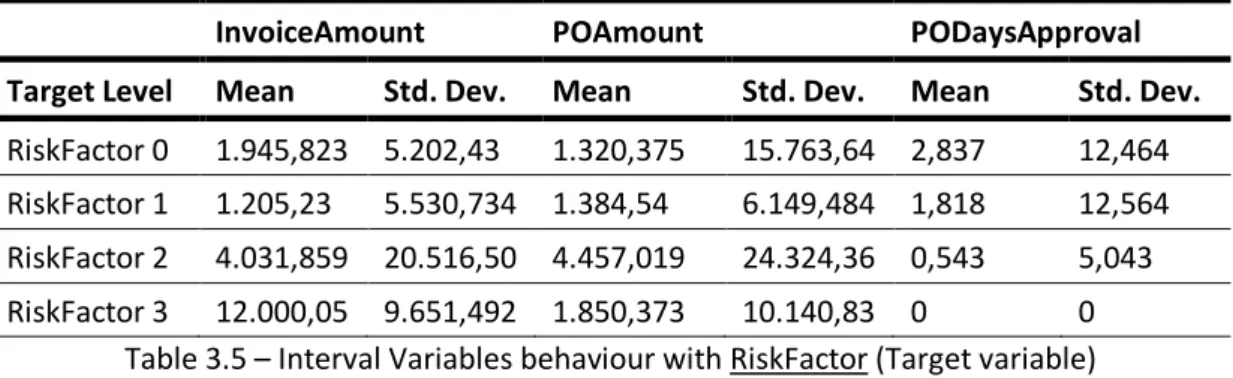
In addition to these conclusions, the descriptive statistics analysis allowed to understand some variables’ behaviour with the target variable RiskFactor. According to Table 3.5, it is possible to verify that the mean for InvoiceAmount increases as RiskFactor is higher. This may show that the POs that possibly are alerts for fraud are the ones with the highest amounts billed. Through this table, it is also observable that the mean of PODaysApproval, number of days for a PO to be approved, is smaller as RiskFactor is higher, concluding that it seems easier and faster to have a PO that it is by itself an alert of fraud approved.
InvoiceAmount POAmount PODaysApproval Target Level Mean Std. Dev. Mean Std. Dev. Mean Std. Dev.
RiskFactor 0 1.945,823 5.202,43 1.320,375 15.763,64 2,837 12,464 RiskFactor 1 1.205,23 5.530,734 1.384,54 6.149,484 1,818 12,564 RiskFactor 2 4.031,859 20.516,50 4.457,019 24.324,36 0,543 5,043 RiskFactor 3 12.000,05 9.651,492 1.850,373 10.140,83 0 0
Table 3.5 – Interval Variables behaviour with RiskFactor (Target variable)
Class Variables
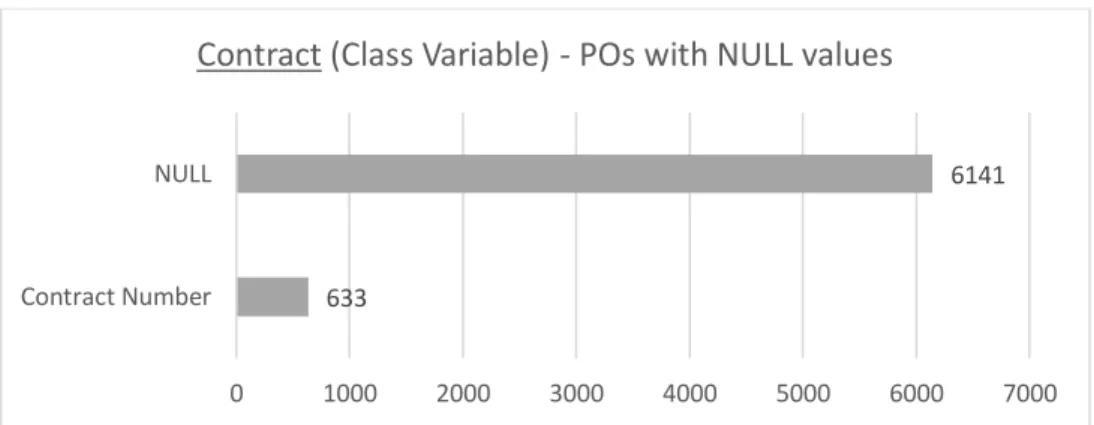
Considering these variables, the first thing to do was to verify the presence of missing values in the data. According to the exploration of data, there are no variables with missing values. However, the variable Contract only has 633 POs with a contract number associated while the others’ POs have this field filled with NULL, with a mode percentage of 90%. Additionally, this variable only has a worth of approximately 0,1, according to the graphic that will be present in the following chapter (Figure 3.14).
22 Figure 3.3 – POs with NULL values in the Contract variable
Source: Author
Then, the POs were analysed considering the new variable RiskFactor (Figure 3.4), that is the target variable of this study.
Figure 3.4 – Total number of POs distributed by the variable RiskFactor Source: Author
Regarding the new variable created, RiskFactor, the most part of the POs follows a normal process of purchase, where this variable has the value 0, representing about 53% of the all dataset. On the other hand, only 2 POs are alerts of level 3 considering the risk of fraud. The next analysis performed was the total number of POs per region, considering that all the POs are related to suppliers with location in Portugal.
633
6141
0 1000 2000 3000 4000 5000 6000 7000 Contract Number
NULL
Contract (Class Variable) - POs with NULL values
3610 2064 1098 2 0 500 1000 1500 2000 2500 3000 3500 4000 0 1 2 3
23 Figure 3.5 – Total number of POs per region
Source: Author
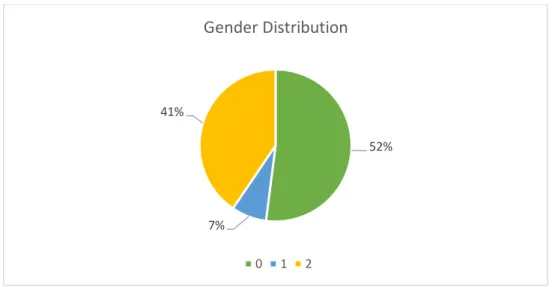
As it is possible to observe in the map presented above (Figure 3.5), the region with the higher number of POs is Guarda followed by Viana do Castelo, with totals of 1.075 and 922, respectively. On the other hand, the regions with lesser number of POs are Portalegre and Beja, both with a total of 60 POs.
Then, the analysis performed was regarding the gender of the final approvers (Figure 3.6). It is possible to observe that the most part of the final approvers are men, with a representation of 52%, while women are the less representative part, with only 7%, this means that only approximately 500 POs are approved by women.