POTENTIAL DETERMINANTS OF RMB EXCHANGE RATE
Jingwen Liu
Project submitted as partial requirement for the conferral of Master in Finance
Supervisor:
Prof. Paulo Viegas de Carvalho, Invited Assistant Professor, ISCTE Business School Department of Finance
Resumo
Com a maior economia emergente no mundo, a China e a sua economia têm atraído muitas atenções a nível mundial. Como tal, a análise do comportamento da taxa de câmbio do renminbi (RMB) é de elevada relevância. Com efeito, as instituições financeiras e outros investidores de uma forma geral podem gerir de forma mais eficaz o risco que assumem com a volatilidade da taxa de câmbio do RMB, se conhecerem de forma rigorosa os efeitos dos fatores relevantes sobre esta taxa de câmbio. Este trabalho apresenta uma análise empírica dos determinantes da taxa de câmbio do RMB, o que ajuda a identificar os principais motores que explicam as alterações nesta taxa de câmbio. Os resultados mostram que os diferenciais de taxas de inflação, das balanças comerciais, e das taxas de crescimento do PIB entre a China e os EUA estão positivamente relacionados com a taxa de câmbio do RMB face ao USD. Por seu turno, os diferenciais de taxas de juro entre a China e os EUA, as reservas cambiais da China, bem como a reforma financeira ocorrida na China em 2005, estão negativamente relacionados com a taxa de câmbio do RMB face ao USD.
Classificações JEL: F31, G17
Palavras-chave: Taxas de câmbio; Paridade do Poder de Compra; Análise empírica; Método dos Mínimos Quadrados Ordinários
Abstract
With the largest emerging economy in the world, China and its economy have been raising great attention worldwide. In this respect, analyzing the behavior of RMB exchange rate is of crucial significance. In fact, financial institutions and investors in general can manage effectively the risk they take due to the volatility of the RMB exchange rate against the USD, by knowing accurately the effects of the relevant factors on the foreign exchange rates. This work comprises an empirical analysis of determinants of the RMB exchange rate, which helps to identify the most relevant drivers that explain the changes of the RMB exchange rate. The results show that the differentials of inflation rates, trade balance, and GDP growth between China and US are positively related to the RMB exchange rate. In turn, interest rates differential between China and US, foreign exchange reserve of China, and the financial reform of China in 2005 are negatively related to RMB exchange rate against the USD.
JEL Classification: F31, G17
Keywords: Exchange Rates; Foreign Exchange; PPP; Empirical analysis; Ordinary Least Square method
Acknowledgments
I would like to express my greatest gratitude to my supervisor, Professor Paulo Viegas de Carvalho, for supporting me through the whole process of the thesis writing. I am very grateful for his useful guidance, constant encouragements and patience. He guided me through all the stages of writing and helped me to solve the difficulties I had faced. He spent much time reading and revising each draft and provided me with inspiring advice. This thesis cannot be finished without his insightful instruction, consistent guidance and patients.
I would also like to thank all the professors who have taught us for their teaching and enlightening lectures. Their hardworking equipped me with useful knowledge on finance.
Last, my thanks would go to my beloved family for their great support and love, and to my classmates who gave me help and happiness during the precious study life.
Index
1. Introduction ... 1
2. Background ... 5
2.1 An overview of the evolution of RMB exchange rate (USD/RMB) ... 5
2.2 A brief overview of the Chinese exchange rate policy ... 6
3. Literature review ... 11
3.1 Related theories of the study ... 11
3.1.1 Purchasing Power Parity ... 11
3.1.2 Interest Rate Parity ... 13
3.1.3 Other theories ... 14
3.2 Factors that affect the RMB exchange rate ... 16
4. Data and definition of variables ... 23
5. Methodology ... 24
6. Empirical findings ... 26
6.1 Stationarity ... 26
6.2 The determinants of RMB exchange rate ... 28
6.3 Pearson Correlations ... 29
7. Conclusion ... 31
Bibliography ... 33
Figures and tables index
Figure 1 - RMB to US Dollar exchange rate...5
Table 1 - Evolution of Chinese exchange rate policy (1948-2014)...7
Table 2 - Variables and symbols...26
Table 3 - Augmented Dickey-Fuller test and KPSS test for the level of series...27
Table 4 - Augmented Dickey-Fuller test and KPSS test for the first difference...27
Table 5 - Augmented Dickey-Fuller test and KPSS test for the second difference...28
Table 6 - Multiple linear regression (Dependent: DLNS; Method: Least squares)…. 28 Table 7 - Pearson Correlation...30
Acronyms
ADF - Augmented Dickey-Fuller test APPP - Absolute PPP
ARFIMA - Autoregressive Fractionally Integrated Moving Average BPNN - Back-propagation Neural Network
BSH - Balassa - Samuelson Hypothesis
CFETS - China Foreign Exchange Trading System FX – Foreign Exchange
GDP – Gross Domestic Product
KPSS - Kwiatkowski-Phillips-Schmidt-Shin test LOOP - Law of One Price
PBOC - People's Bank of China PPP - Purchasing Power Parity RMB – Renminbi
SPFE - Shadow Price of Foreign Exchange SVM - Support Vector Machine
1. Introduction
Globalization brings about changes in dynamic interactions of currencies, especially in the exchange rate. In an open economy, the exchange rate is a core issue which has a great impact on economic growth. As the second largest national economy in the world, China has achieved rapid development in recent years. The RMB exchange rate has become a heated issue as the Chinese economy exerts great impact on the world’s economy. The reform of RMB exchange rate, the trend of RMB exchange rate and the issue of RMB appreciation have deserved a growing global attention.
There are a substantial number of debates on the value of RMB and the Chinese exchange rate policy in recent years. However, only a few researches comprehensively evaluate the RMB exchange rate in relation to the special characteristics of the Chinese economy. An exchange rate theory is of significant importance to analyze the economic behavior of exchange rate. This thesis analyzes the influencing factors of RMB exchange rate based on some of the most relevant theories that explain foreign exchange rate movements, such as the theories of Purchasing Power Parity and Interest Rate Parity. Other relevant theories are also considered, taking into account the real situation in China.
Although there are a number of different methodologies to assess equilibrium exchange rates, the purchasing power parity (PPP) hypothesis is one of the most studied in determining exchange rates in the economic literature (Gidis et al., 2015). When a country establishes or adjusts an exchange rate peg, it generally relies on some type of quantitative framework, such as the PPP formula, to help access the appropriate level for the new parity (Isard, 1995).
This thesis uses the RMB/USD exchange rate as the benchmark to illuminate the determinants of RMB exchange rate. The majority of empirical studies use data from the industrial developed countries, with the dollar exchange rate being the most common rate analyzed (Gidis et al., 2015). Therefore, using USD as the reference
currency seems appropriate.
In attempting to understand the behaviors of exchange rates, economists have focused historically on three classes of potential explanatory variables: national price levels, interest rates, and the balance of payments (Isard, 1995). In this thesis, data about the RMB/USD exchange rate, yearly exchange rate inflation rates, interest rates, GDP of both China and the United State and foreign exchange reserve, as well as international balance of payments of China, are obtained to analyze potential determinants of RMB exchange rate. In this thesis, a multiple linear regression model will be employed to analyze the relationships between the selected factors and the RMB exchange rate. The results indicate that inflation rates differential between China and US, the interest rates differential between the two countries, as well as the financial reform of China, in 2005, have an impact on the RMB exchange rate. On one hand, inflation rates differential between China and US are positively related to the RMB exchange rate. On the other hand, interest rates differential between China and US and the financial reform of China, in 2005, are negatively related to RMB exchange rate.
So far, there is only a few empirical studies to analyze the determinants of RMB exchange rate. Gidis et al. (2015) apply a bilateral real exchange rate to test purchasing power parity for US and China for the period 2000-2012. They point out that the long-run PPP holds under a system of fixed exchange rates and that the managed float of China versus US dollar has created a deviation from the PPP path of exchange rate. Frankel and Wei (2007) stress on the heated debate of RMB exchange rate manipulation, testing two competing sets of hypothesized determinants of the US Treasury decisions and evaluate the type of exchange rate regime China has actually been following. Yi and Fan (1997) do a research on the determinants of RMB exchange rate based on purchasing power parity, interest rate parity, international balance of payment and central bank monetary policy. They conclude that in an economic takeoff stage, developing countries may have relatively high inflation rate and that the exchange rate will depreciate disproportionately, because price increases
in terms of non-tradable goods are higher than those of tradable goods. When analyzing the exchange rate of developing countries, these authors also point out that purchasing power parity needs to be improved and modified, while interest rate parity may have stronger interpretation and forecasting ability.
Chou and Shih (1998) estimate the equilibrium exchange rates of RMB with PPP model and the shadow price of foreign exchange (SPFE) model, and find that the official exchange rates lying between the PPP rates and the SPFEs implied that the Chinese government adopted an exchange rate policy that maintains official exchange rates close to equilibrium levels. Tian and Chen (2013) employ the STARTZ1 model to examine the new RMB exchange rate regime and investigate the RMB nominal effective exchange rate behavior from mid-2006 to mid-2008. The authors find some peculiar attributes of the RMB nominal effective exchange rate, including small conditional variance and stronger effects from government interventions in foreign exchange markets. Xie, Mao and Wang (2014) build a nonlinear combination model of the autoregressive fractionally integrated moving average (ARFIMA) model, the support vector machine (SVM) model, and the back-propagation neural network (BPNN) model to forecast the RMB exchange rate.
Compared with the studies mentioned above, this thesis aims to analyze the determinants of RMB exchange rate by establishing a multiple linear regression model. Based on the PPP theory and Interest rate parity, this thesis attempts to include more variables which may have an impact on RMB exchange rate. Selected variables include inflation rates differential between China and US, interest rates differential between China and US, trade balance differential between China and US, GDP growth differential between China and US, foreign exchange reserves of China and the financial reform of China in 2005. The result of the study provides a more
1 The STARTZ model, developed by Lundbergh and Terasvirta (2006), is a discrete-time model that
enables the investigator to characterize the dynamic behavior of an exchange rate fluctuating within a target zone and evaluate the validity of the assumptions of Krugman's model. Its central feature is that the model can jointly model the dynamic behavior of the conditional mean and variance of the exchange rate in a target zone. (Tian and Chen, 2013)
comprehensive way to understand the behavior of RMB exchange rate.
The thesis is structured in distinct sections. First, it provides a general overview of the evolution of RMB exchange rate in recent years. Second, it makes a brief introduction of the Chinese exchange rate policy. In addition, it reviews the main theories and methodologies concerning foreign exchange rates. It also assesses the factors that shaped the evolution of the RMB exchange rate in recent years. Then, the thesis uses a multiple linear regression model to test the related factors. Next, we present an empirical result of the determinants of RMB exchange rate based on the previous analysis. The last section concludes.
2. Background
2.1 An overview of the evolution of RMB exchange rate (USD/RMB)
Over the second half of the 20th century, the RMB/USD exchange rate went through the following stages: stability in the 1950s and 1960s, a trend of appreciation in the 1970s, depreciation in the 1980s and in the beginning of 1990s, and stability again in the end of 1990s to the beginning of the 21st century.
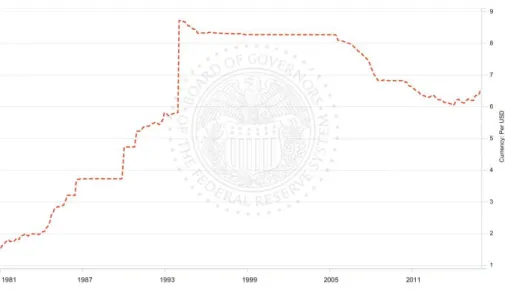
Figure 1: RMB to US Dollar exchange rate
The previous figure describes the evolution of RMB to US Dollar exchange rate from 1981 to 2016. From January 1981 to December 1984, China adopted the internal settlement price for trading foreign exchange. At that time, $1 equaled 1.5 RMB. Since 1985, China carried an economic reform and the exchange rate policy changed a lot. RMB exchange rate no longer pegged to the RMB/USD exchange rate, but adjusted according to the economic dynamics. In 1986, the RMB/USD exchange rate changed from 3.2 RMB per USD to 3.7. Since 1991, that exchange rate had been adjusted in a small range.
and a single managed floating exchange rate policy was established based on the market supply and demand. In 1994, the official foreign exchange rate and the adjusted exchange rate were unified. Since the unification of exchange rate, the RMB/USD exchange rate quickly depreciated, resulting in 1 USD to 8.70 RMB. From 1994 and for almost a decade, the RMB exchange rate had been kept stable.
In 2005, a floating exchange rate policy was established and the RMB exchange rate no longer pegged to the USD. During that period, the Chinese currency appreciated between 2.1% and 2.56%.
Three years later, in 2008, the financial crisis broke out and the price of stock market and the bulk commodity dropped sharply. China’s financial strategy against the financial crisis was to let the RMB follow the USD closely and maintained the USD/RMB exchange rate within the range of 6.89 to 6.80. In the first half of 2016, the USD/RMB exchange rate fluctuated between 6.45 and 6.60.
2.2 A brief overview of the Chinese exchange rate policy
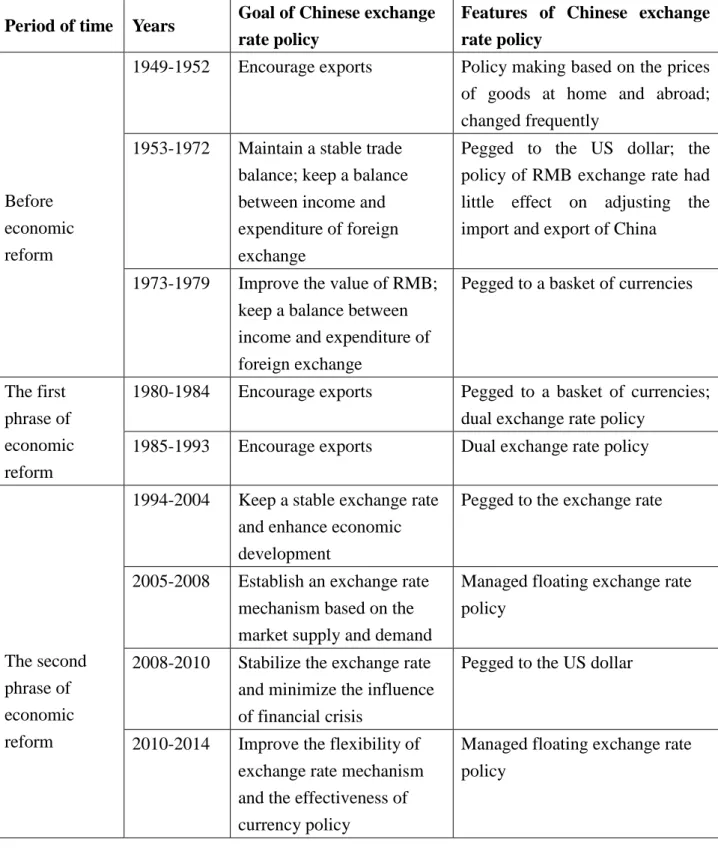
In order to understand the changes the RMB has gone through in the last decades, Table 1 highlights the main features and goals of the Chinese exchange rate policy since the second half of the twentieth century.
In order to enhance international economic exchanges, the Chinese government tried to find a suitable exchange rate policy to accommodate the changing economic climate. Before 1978, China’s exchange rate policy was mostly determined by the nation’s strategic interests, and was formed in the context of the tense, inhospitable climate of the Cold War that the new Republic’s leaders faced (Wang et al., 2007).
Table 1 - Evolution of Chinese exchange rate policy (1948-2014) Period of time Years Goal of Chinese exchange
rate policy
Features of Chinese exchange rate policy
Before economic reform
1949-1952 Encourage exports Policy making based on the prices of goods at home and abroad; changed frequently
1953-1972 Maintain a stable trade balance; keep a balance between income and expenditure of foreign exchange
Pegged to the US dollar; the policy of RMB exchange rate had little effect on adjusting the import and export of China
1973-1979 Improve the value of RMB; keep a balance between income and expenditure of foreign exchange
Pegged to a basket of currencies
The first phrase of economic reform
1980-1984 Encourage exports Pegged to a basket of currencies; dual exchange rate policy
1985-1993 Encourage exports Dual exchange rate policy
The second phrase of economic reform
1994-2004 Keep a stable exchange rate and enhance economic development
Pegged to the exchange rate
2005-2008 Establish an exchange rate mechanism based on the market supply and demand
Managed floating exchange rate policy
2008-2010 Stabilize the exchange rate and minimize the influence of financial crisis
Pegged to the US dollar
2010-2014 Improve the flexibility of exchange rate mechanism and the effectiveness of currency policy
Managed floating exchange rate policy
From 1949 to 1952, the adjustment of RMB nominal exchange rate was mostly dominated by the Central Bank of China and the related national policies. During this period, the RMB nominal exchange rate was adjusted for 52 times, of which 49
correspond to depreciations because of the severe inflation in China (Wang, 2012). From 1950 to 1952, China carried out a policy of encouraging exports, and adjusted the RMB nominal exchange rate accordingly. In general, during the period of China’s economic recovery, the RMB exchange rate was flexible in accordance with the development of economic growth and trade.
After that period, between 1953 and 1972, China implemented the planned economic policy, the commodity prices of China became stable, and the state owned economy dominated the Chinese foreign trade market. During this period, the RMB nominal exchange rate no longer only had the function of adjusting to imports and exports because most of the foreign trade was dominated by the state. In this period, the prices of imports and exports were regulated by the state, and the balance of trade was computed by the state’s treasury department. Therefore, the policy of RMB exchange rate had little effect on adjusting imports and exports of China.
From 1973 to 1979, China carried out an adjusted RMB exchange rate policy. Chinese exchange rate policy took the exchange rate variance of international currency market as a reference. At that time, RMB was pegged to a basket of currencies which belonged to China’s main trading partners.
During the period between 1980 and 1984, China carried out the economic reform and opening up, and implemented the dual exchange rate policy. With the beginning of economic reforms in China, the functions of the market were increasingly valued by policy makers, and from 1981 a dual exchange rate system emerged, whereby the official fixed exchange rate was complemented with market-determined exchange rate in the swap centers (Wang, et al., 2007). Dual exchange rate policy means the trading exchange rate coexists with the non-trading exchange rate. The dual exchange rate policy largely motivated the export business in China and effectively avoided the loss of foreign currencies in the non-trading field, thus increasing the foreign exchange reserve of China. However, the dual exchange rate policy has an apparent problem.
Because the dual exchange rate cannot reflect the real RMB exchange rate straightly, as well as the line between trading and non-trading filed was blurred, there appeared a large room for rent-seeking (Li, 2007).
At first, RMB was pegged to a basket of currencies. Then, in the later 1980s, China moved to a managed floating exchange regime as a part of its overall financial reform (Xu, 2008). From 1985 to 1993, a pegged exchange rate system was carried out and the RMB nominal exchange rate was able to adjust flexibly and reasonably according to the variation of currencies from home and abroad. With the adjustment of RMB nominal exchange rate, China’s foreign trade business prospered during this period. The pegged exchange rate regime provided the Chinese government with an anchor to resist unrestrained monetary expansion, and this was especially important after periods of zealous construction and uncontrolled growth in the 1980s which led to inflation and instability (Xu, 2008).
In 1994, China carried on an exchange rate reform and established a managed floating exchange rate policy based on the market supply and demand. The Chinese foreign exchange market is centered on the China Foreign Exchange Trading System (CFETS). Founded in April 1994, the CFETS is an institution that is under the direct control of China's central bank, the People's Bank of China (PBOC) (Zhang et al., 2013). By pegging its currency to the US dollar, the Chinese government established its credibility in controlling inflation and maintaining economic stability in the country, and thus promotes the necessary foreign investment and long-term economic growth (Xu, 2008). However, the pegged exchange rate system has some limitations. With the pegged exchange rate regime, the value of RMB changed along with the value of US dollar. By pegging its currency to the US dollar, the Chinese government loses its ability to conduct an independent monetary policy (Xu, 2008).
From 21 July, 2005, China established a managed floating exchange rate regime with a financial reform. The RMB exchange rate reform, which switched from a USD peg
to a “managed float” against a basket of currencies, has been based on the principles of “independent initiative, controllability, and gradual progress”, despite of having gone through various phases of faster or slower appreciations (Liu et al., 2012). The basket of currencies are chosen based on the economic development needs of China, which include US dollar, Euro, Japanese Yen and Korean Won. The Chinese currency, Renminbi or Yuan (RMB or CNY), had been appreciating at a gradual pace against the US dollar since the exchange rate reform on the 21st of July 2005 (Liu et al., 2012).
In general terms, the Chinese exchange rate policy has the following characteristics. First, the RMB exchange rate is based on the market supply and demand. The RMB exchange rate has a close connection with the current trade balance, the inflation rate, the inflow and outflow of capital and other related economic factors. The development of foreign exchange market has largely improved the marketability of the RMB exchange rate. The RMB nominal exchange rate plays a more important role in price leverage and distribution of resources. Second, the exchanged rate is managed in its adjustment range. The Chinese government monitors the behavior of RMB exchange rate through foreign exchange market. A macro-economic control system is established to regulate the exchange rate. Third, the exchange rate policy is adjusted referring to the basket of currencies. The purpose of taking the basket of currencies as reference is to keep the RMB exchange rate in a proper floating range, and help to stabilize the international balance of payments so as to maintain the healthy development of the financial market. Since 2010, People’s Bank of China has kept improving the mechanism of RMB exchange rate according to the financial situation at home and abroad, and the international balance of payments.
3. Literature review
3.1 Related theories of the study
3.1.1 Purchasing Power Parity
The theory of Purchasing Power Parity (PPP) was put forward by the Swedish economist Cassel in 1922. The law of one price (LOOP) is the foundation of Purchasing Power Parity. According to the law of one price, the same kind of good should sell for the same price both in the home country and in foreign countries, without considering the transportation cost and tariffs. When a country establishes or adjusts an exchange rate peg, it generally relies on some type of quantitative framework, such as the PPP formula, to help access the appropriate level for the new parity (Isard, 1995). PPP is an important benchmark for the analysis of exchange rate movements, particularly insofar as they impinge on international competitiveness (Copeland, 2008). If the general level of prices is a reasonably accurate index of the cost of production in a country (and this is almost certain to be the case), then the ratio of price levels for any two countries will serve as a measure of relative competitiveness (Copeland, 2008).
Absolute PPP (APPP) says that a country’s nominal exchange rate is determined as the ratio of the overall price levels in the home and foreign country. So, a country with a relatively high price level will have a depreciated exchange rate relative to its trading partners (MacDonald, 2007). The equation of absolute purchasing power parity can be defined as:
* i t t i t SP P (3.1)
where Pi denotes the price of the homogeneous good i, S is the nominal exchange rate (home currency price of one unit of foreign currency) and as before, an asterisk
denotes a foreign magnitude (MacDonald, 2007). The mechanism that forces the LOOP condition is arbitrage. Thus, if the domestic price level is greater than the quotient of the foreign price level and the exchange rate, it would be profitable to ship the good from the foreign to the home country (MacDonald, 2007). But the price will be adjusted right after the arbitrage opportunity occurs, and the law of one price will eventually be restored.
An alternative version of PPP, referred to as relative PPP, is obtained by expressing the variables in terms of changes:
* t t t p p s (3.2) where Δ denotes a first difference operator. Relative PPP indicates that countries with
relatively high inflation will have a depreciating currency. Compared to absolute PPP, this variant of PPP is relatively uncontroversial (MacDonald, 2007).
Purchasing Power Parity has the following rationality. First, after the collapse of the gold standard system, it points out that an exchange rate should be analyzed from the basic function of a currency (purchasing power), which is reasonable. Second, it indicates that the depreciation of currency in the domestic market will lead to the depreciation in the foreign exchange market. It is convincing especially in years of high inflation rate.
Even if PPP is not valid as hypothesis about short-run behavior, the forces of international competition may generate convergence over time in the common-currency prices of similar tradable goods. Rejection of the law of one price in the short run is not sufficient to dismiss the proposition that real exchange rates fluctuate around time-invariant means or equilibrium values over the long run (Isard, 1995).
3.1.2 Interest Rate Parity
The Interest Rate Parity was put forward by British economist Keynes in 1923, and was later improved by other western scholars in the 1920s. This theory analyzes the relationship between the exchange rate and the interest rate in the aspect of financial sector. It indicates that in the presence of free capital flow market, capital will flow to the country with the highest interest rates to make a profit, whenever there is a differential between the exchange rates of the two countries. Currencies are exchanged in the process of capital flow from one country to another. If the exchange rate of between the currencies of both countries is stable and does not evolve according to capital flows, investors will profit from arbitrage. If the exchange rate of a country with high interest rates declines sharply, it is likely that investors will not make a profit from the arbitrage process or even face losses in their investment. In order to avoid losses, when arbitragers exchange the currency of the country with low interest rate to that of high inflation, they sell the currency of the country with high interest rate and buy the currency of the county with low interest rate in the forward exchange market at the same time.
In this case, the supply of the currency of the country with high interest rates will increase and the demand of the currency of the country with low interest rates will decrease. Thus, the forward exchange rate of the country with high interest rates will decline and that of the country with low interest rates will rise. Only when the differential of exchange rates of both countries becomes equal to the gap in their interest rates, the arbitrage opportunity will disappear. Therefore, the theory of Interest Rate Parity concludes that the forward exchange rate of two currencies is determined by the differential of interest rates of these two countries.
The Interest Rate Parity theory may be subdivided in the Covered Interest Rate Parity and Uncovered Interest Rate Parity. The equation of the Covered Interest Rate Parity can be defined as follows:
S F r r) (1 ) 1 ( * (3.3)
In the equation, r denotes the interest rate of home country, r* denotes the interest rate of the foreign country, S refers to the spot exchange rate and F refers to the forward exchange rate. The expression says that when the interest rate of the home country is higher than that of the foreign country, the forward exchange rate will decrease, otherwise, it will increase.
According to the Uncovered Interest Rate Parity, the domestic interest rate must be higher (lower) than the foreign interest rate by an amount equal to the expected depreciation (appreciation) of the domestic currency (Copeland, 2008). The equation of Uncovered Interest Rate Parity can be defined as follows:
S E r r) (1 ) f 1 ( * (3.4)
In the equation, r, r*and S have the same meaning as before. Ef refers to the
expected forward exchange rate. The forward exchange rate is therefore determined by the differential of interest rate of two countries. If the interest rate of the home country is higher than that of the foreign country, the forward price of the home currency will decline.
3.1.3 Other theories
A country’s or monetary zone balance of payment is also an important macroeconomic variable to the value of its currency. The theory underlying the influence of the balance of payments on the foreign exchange rate is based on macro economy theory, which can be traced back to the Theory of International Indebtedness in the period of gold standard system.
The Theory of International Indebtedness was put forward by the British scholar George Goschen in 1861. This theory indicates that foreign exchange rate are determined by the supply and demand of the national currency relative to other currencies. Since the supply and demand of currencies are generated by international indebtedness, this is the main factor that influences the exchange rate. International indebtedness consists of fixed indebtedness and floating indebtedness. Goschen believed that only floating indebtedness affects the supply and demand of currencies. If a country has higher wealth than debt, then the demand of its domestic currency will be higher, which leads to the appreciation of FX rate.
The theory related to the gold standard system points out that the imbalance of international payments is the main cause of variations in the exchange rate. However, it does not show what determines the exchange rate and it cannot explain why the change of currency volume will affect the exchange rate. More recently, the Keynesian school developed the theory of Elasticities Approach and Absorption Approach, which introduce the effect of national intervention on the variation of exchange rate.
The theory of international balance of payments has the following points. First, when the national income increases, imports increase, thus increasing the demand of foreign exchange. In this case, the foreign currency will appreciate while the domestic currency will depreciate. Second, the rising level of domestic price will lead to the appreciation of domestic currency, which reduces exports of the home country. On the other hand, when exports decrease, the domestic current account will deteriorate, which leads to the depreciation of the domestic currency. In this case, the real exchange rate will be balanced again. Third, the increase of interest rate of the home country will attract more capital inflows, thus the capital account of the home country will be optimized. In such circumstance, the currency of the home country will appreciate.
The theory of international balance of payments developed a new perspective of analyzing the determinants of exchange rate. However, this theory does not consider the complexity and uncertainty of the exchange rate, which is influenced by the interaction of different determinants (Li, 2005).
3.2 Factors that affect the RMB exchange rate
Considering the theories outlined in the previous subsection, we may now list some of the main factors that potentially influence the exchange rate, as detailed in the following paragraphs.
The international balance of payment and the foreign exchange reserves
If the income of a country is higher than its spending, there will be a surplus, otherwise, a deficit will emerge, thus influencing the behavior of the exchange rate. If a country has a surplus of international payments, the demand for the domestic currency will be high when compared to foreign currencies, and thus the domestic currency will appreciate; otherwise, it will depreciate.
China is an exports oriented country and processes large amount of low cost labor force. The exchange rate reform in 1994 led to a drastic depreciation of RMB, which accelerated the rapid growth of exports. Foreign invested enterprises established processing trade partnership with China, taking the advantages of China’s cheap labor force and land. A lot of goods with competitive prices produced in China are exported to America and Europe. In this case, China’s international trade kept a surplus, which lead to an increase of foreign exchange supply and RMB demand, thus the RMB has appreciated. In addition, China exerted a strong attraction of foreign investment because of the favorable conditions it provides and because of its rapid economic growth. Therefore, foreign capital flow into China increased rapidly in terms of
foreign direct investment and international securities investment. China’s capital and financial account has often showed a surplus and as consequence RMB has continued to appreciate.
Foreign exchange reserves are the main measure of the current international reserve system. International reserves is the asset which a country possesses to pay international balance of payment and intervene in the foreign exchange market. Foreign exchange reserves help to improve the international liquidity capability of a country. When the country possesses more foreign exchange reserves, it has more power to intervene in the foreign exchange market. On the contrary, it affects the confidence of the foreign exchange market of the home country to stabilize its own currency. If the exchange rate of a country is too high in the short term, it means that the demand of foreign currency exceeds the supply. In this case, the central bank can purchase foreign currencies and sell its own currency, which makes a balance of the supply and demand of the foreign currency and the domestic currency.
Since the economic reform and opening up its economy, China registered a rapid economic growth and its scale of foreign investment utilization enlarged. China’s international trade has been keeping a surplus, and its foreign exchange reserves have been accumulating.
The interest rate differential
The interest rate of a country reflects the borrowing and lending conditions of that country, which has an important impact on the exchange rate. Interest rate differentials affect the international capital flow. Capital tends to flow into the countries which have high interest rates, and flow out of the ones with low interest rates. Such capital flows affect the value of the foreign exchange rate. The international flow of hot money is a vital factor which affects the performance of exchange rates. The level of the interest rates of a country affects the attractiveness to
financial assets.
If interest rates of one country rise and maintain a certain gap relative to those of other countries, there will be a large amount of hot money flow from countries with low interest rates to countries with high interest rates, so as to exploit profitable investment opportunities. In this case, the demand of currencies of countries with high interest rate will stimulate the appreciation of their domestic currency. On the contrary, if a country’s interest rate is lower than that of others’, its currency will depreciate. In general, if a country’s interest rate increases, its currency will appreciate; on the contrary, it will depreciate. Arbitrage is the process of buying or selling something in order to exploit a price differential, so as to make a riskless profit (Copeland, 2008).
Inflation
Inflation is a long term and regular factor which influences the exchange rate. If a country issues excess currency, and the amount of currency circulating exceeds the actual demand, inflation will tend to occur. Generally speaking, increasing the inflation rate of a country will cause depreciation of its currency, and the ease of inflation will make its currency appreciate. Inflation affects the value and the purchasing power of a currency. When a currency’s exchange rate rises, exports tend to reduce, whereas imports are stimulated.
Inflation will influence the competitiveness of the goods of one country by the price change. When the inflation rate of a country is high, its commodity and labor price will rise, which reduces exports and increases imports. In addition, inflation influences the demand and supply in the foreign exchange market as well as the foreign exchange rate. When a country’s inflation rate is higher than that of another country, its real exchange rate will decrease, which reduces the return of investments. In this case, capital will flow out and affect the demand and supply of foreign exchange market. If large amounts of capital flow out, the country’s currency will
depreciate. Besides, the rise in a currency’s exchange rate will affect the psychology of foreign exchange market and the international status of this currency.
The relative purchasing power parity indicates that the variance of exchange rate is determined by the inflation differential rate of two countries. The relative purchasing power parity hypothesis states that: one country’s inflation rate can only be higher (lower) than another’s to the extent that its exchange rate depreciates (appreciates) (Copeland, 2008).
The home country’s inflation rate, dp, will be equal to the sum of the foreign inflation rate, dp , and the rate of the currency depreciation, ds (Copeland, 2008). *
The equation is as follows:
ds dp
dp * (3.5)
which says that the domestic country can only run a higher rate of inflation than the foreign country if its exchange rate falls pro rata (Copeland, 2008). One way of interpreting this relationship is simply as an extension of the familiar idea that when prices rise, the value of money falls (Copeland, 2008).
GDP growth rates differential
Economic power is a fundamental factor which impacts the long term development of exchange rates. The economic growth of one country increases the demand of foreign goods and labor force. Therefore, the demand of foreign currencies will also increase, leading to the appreciation of foreign currency. If a country has strong economic power and keeps a rapid economic growth and low inflation rate, the market will have more confidence on its currency, thus keeping its exchange rate on a relatively high level. Productivity of a country has a close relationship with its exchange rate. When the productivity of a country improves, with other things being equal, the price level
declines and the currency’s exchange rate appreciates.
However, Balassa (1964) and Samuelson (1964) put forward another perspective: the Balassa - Samuelson Hypothesis (BSH). BSH establishes the internal relation of one country’s economic growth and its actual exchange rate. The model of Balassa (1964) and Samuelson (1964) indicates that in a small open economic, the national economy is divided into traded goods sector and non-traded goods. Prices of tradable goods are determined by the international market, while prices of non-tradable goods are determined by domestic market. The hypothesis indicates that when the productivity of the non-traded sector improves greatly, the domestic currency will tend to depreciate; on the contrary, when the productivity of the traded sector improves greatly, the domestic currency will tend to appreciate. Their analysis is based on the observation that, at least in the industrialized world, productivity increases are far more rapid in the traded than in the non-traded goods sectors of the economy (Copeland, 2008).
In any case, if this observation is correct, the implication is that wages in the traded goods sector will tend to rise more rapidly than in the non-traded goods sector, as employers seek to exploit the benefits of higher productivity per worker by expanding output, in the process competing for labor and driving up the wage rate. If there is an integrated labor market, then, in the long run at least, wages will be up to the same level in the services sector, even though productivity growth has been slower. This in turn means that prices in the services sector will have to rise relative to those in the traded goods sector, so as to maintain profitability, with other things being equal (Copeland, 2008).
Developing countries usually adopt export-oriented strategies, promoted by low costs of production and encouraging foreign investment. China’s rapid economic growth stimulated the appreciation of RMB. As an exported oriented country, China’s economic growth is boosted by the increasing productivity of tradable goods. The
economic growth comes often along with the growth of exports. The range of growth of exports is often larger than that of imports, which leads to a lower supply of RMB than its demand and consequently to the rise of the RMB exchange rate. Whenever domestic investors and foreign investors believe that the rapid growth of the Chinese economy will benefit their returns, the RMB exchange rate rises.
Intervention of economic policy
Foreign exchange rate has a close relationship with the international balance of payments, exports and imports, capital flows as well as domestic productivity, investment and market prices. However, in the foreign exchange market, inefficient situations may occur. Therefore, in order to allocate resources reasonably and to maintain a balanced market environment, the government and the central bank take measures to intervene in market operations.
In fact, the central bank of China has set up exchange rate policies to manage the foreign exchange rate. The central bank may use foreign exchange reserves to sell and purchase foreign and domestic currencies, so as to influence the supply and demand of foreign exchange rate, thus benefitting the domestic economic activity. The main purpose of central bank’s interventions is to keep the exchange rate fluctuation in a reasonable range, so as to avoid potential negative effects.
The fiscal and monetary policies made by the country which aims to stabilize commodity prices, the international balance of payments and the economic growth may also affect the exchange rate. Loose fiscal and monetary policies will stimulate the total social demand and increase imports, thus leading to a deficit of the current account of international trade. In this case, the demand for foreign currencies increases and the domestic currency depreciates. Besides, loose monetary policy reduces the real interest rate of the home country and causes an outflow of capital in the short term. On the contrary, restrictive fiscal and monetary policies raise the
exchange rate. It is worth noting that the adjustment of the economic policy has a great impact on the market expectation and leads to a rapid reaction of the supply and demand of currencies.
4. Data and definition of variables
The data of the thesis covers the period between 2000-2014, which includes the monthly data of RMB/USD exchange rate, inflation rates of both China and the US, interest rates of both China and the US, yearly figures of GDP of both China and the US, as well yearly data relative to the international balance of payments and foreign exchange reserves of China.
The data is from acknowledged and well-established international organizations, which contributes to the reliability of the data obtained. The monthly data of RMB/USD exchange rate is retrieved from Federal Reserve of the United States, monthly inflation rates and GDP growth rates of both China and the US from the World Bank, US Dollar LIBOR interest rate from the Global Rates website, one year interest rate from the People’s Bank of China, trade balance of both China and US from the Organization for Economic Cooperation and Development, and foreign exchange reserve of China from State Administration of Foreign Exchange of China. In what concerns the information about the policies in China, the information has been obtained through official announcements provided by various Chinese authorities on their web pages, such as the People’s Bank of China (PBC) and economic analysis provided by non-Chinese sources. In general, the use of reliable sources is a main focus in all parts of the thesis, to secure a valid and sound foundation for the analyses performed, thereby allowing a qualified answer to the problem being analyzed.
5. Methodology
The thesis combines qualitative and quantitative methods to analyze the mechanism of determinants of RMB exchange rate, and employs econometric models to test the significance of the related variables. After defining the variables that potentially influence the RMB exchange rate, a multiple linear regression model is used to test the significance of such variables and to find out the main factors that have the greater impacts on the RMB exchange rate. Following previous related literature about the potential determinants of the foreign exchange rate, our independent variables include the inflation rate differential between China and the US, the interest rate differential between China and the US, foreign exchange reserves of China, GDP differential between China and the US and the international balance of payments of both China and the US. The research results are presented taking into account the Chinese exchange rate policy and the current situation, which provides a more comprehensive analysis of the RMB exchange rate.
The main purpose of this research is to examine the determinants of RMB exchange rate. Accordingly, the study bases the analysis on the ordinary least squares regression method.
First, it is necessary to detect that all data is stationary. To inspect that data are
stationary, the Augmented Dickey-Fuller test and the
Kwiatkowski-Phillips-Schmidt-Shin (KPSS) test are applied. If test results find that data is indeed stationary, the ordinary least squares regression for the determination of the relationship between each independent variables and the RMB exchange rate change can be used.
After that, the correlation between each independent variable is tested by using the Pearon's Correlation Coefficient.
is as follows: t t t dif dif dif dif t P R TB GDP FER S t t t t 1 2 3 4 5 6Reform 4 (5.1) where:
S = RMB/USD FX spot rate
= the intercept of the regression equation
dif
P = Inflation rates differential between China and US
dif
R = Interest rates differential between China and US
dif
TB = Trade balance differential between China and US
dif
GDP = GDP growth differential between China and US
FER = Foreign exchange reserves of China
Reform = Exchange rate reform dummy (1 = after the financial reform of China in 2005; 0 = before the financial reform of China in 2005)
6. Empirical findings
6.1 Stationarity
Since the thesis employs time series data, it is necessary to check the stationarity of each variable before approaching a multiple linear regression analysis. Stationarity helps to prevent the occurrence of a spurious regression. If the time series data is stationary, a multiple linear regression can be used; if not, a differential test or cointegration test should be used alternatively.
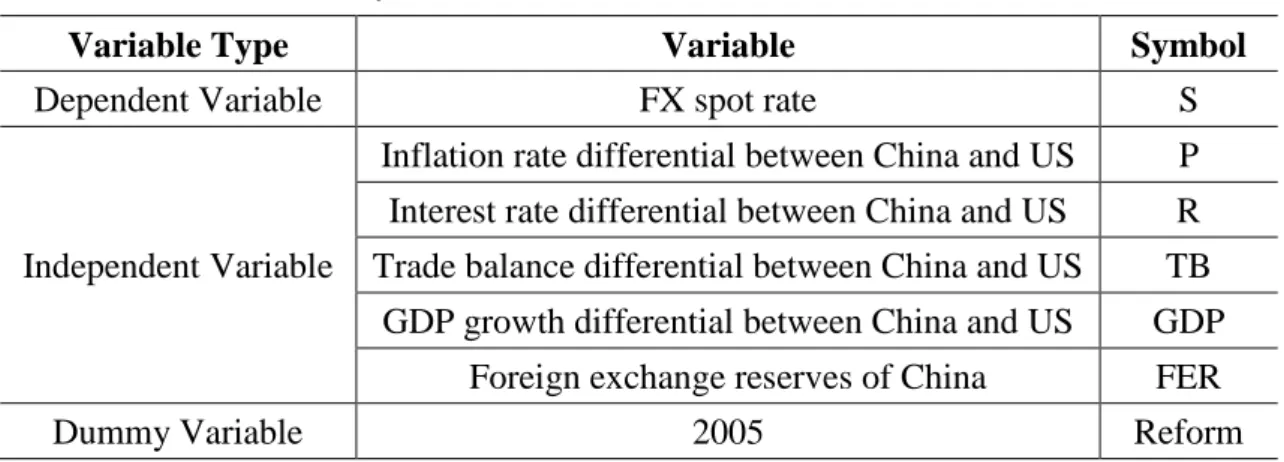
In order to verify the stationarity of the selected variables, two tests are employed: the Augmented Dickey-Fuller (ADF) test, with the null of non-stationarity, and the Kwiatkowski-Phillips-Schmidt-Shin (KPSS) test, with the null hypothesis being the existence of stationarity. The variables in the tests are as follows.
Table 2 - Variables and symbols
Variable Type Variable Symbol
Dependent Variable FX spot rate S
Independent Variable
Inflation rate differential between China and US P Interest rate differential between China and US R Trade balance differential between China and US TB
GDP growth differential between China and US GDP
Foreign exchange reserves of China FER
Dummy Variable 2005 Reform
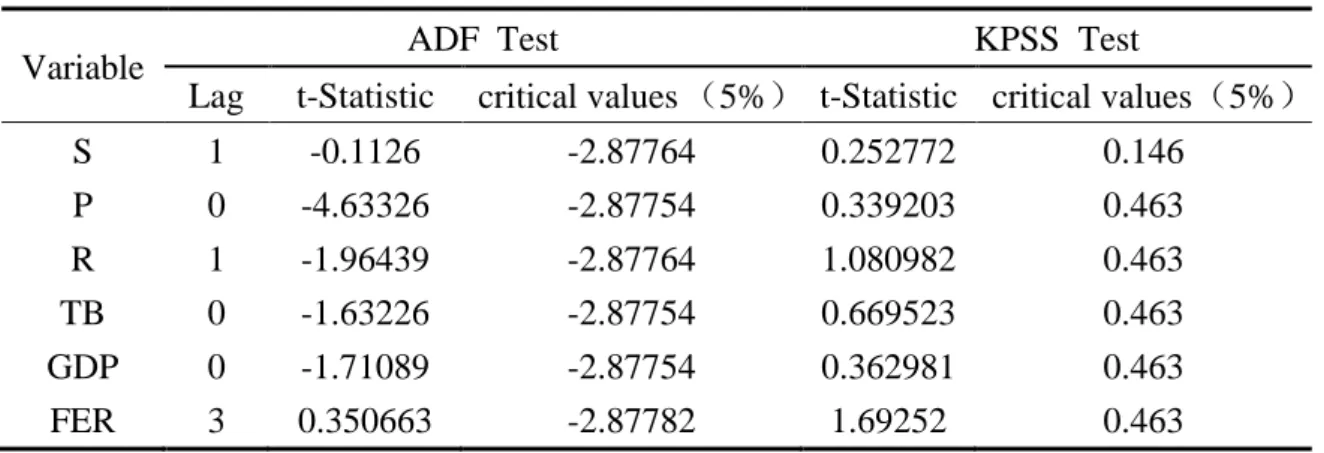
Lag intervals for endogenous are used here to find out the stationary stage of each variable. According to the result of ADF test, as shown in Table 3, the t-statistic of S is -0.1126, which is over the critical value of 5% (-2.87764), so we did not reject the null of non-stationarity of S. Besides, we can find that R, TB, GDP, FER and Reform are all non-stationary. Since the t-statistic of P is -4.63326, which is less than -2.87754 (the critical level), P is stationary. On the other hand, judging from the result of KPSS test, t-statistics of both P and GDP are less than 5%, and that of other variables are larger than 5%. Thus, based on the ADF and KPSS tests, we conclude that P is
stationary, and S, R, TB, GDP, FER and Reform are non-stationary.
Table 3 - Augmented Dickey-Fuller test and KPSS test for the level of series
Variable ADF Test KPSS Test
Lag t-Statistic critical values (5%) t-Statistic critical values (5%)
S 1 -0.1126 -2.87764 0.252772 0.146 P 0 -4.63326 -2.87754 0.339203 0.463 R 1 -1.96439 -2.87764 1.080982 0.463 TB 0 -1.63226 -2.87754 0.669523 0.463 GDP 0 -1.71089 -2.87754 0.362981 0.463 FER 3 0.350663 -2.87782 1.69252 0.463
Since the regression involves non-stationary series, a spurious regression may occur. Therefore, the first differences of the series should be considered.
Table 4 - Augmented Dickey-Fuller test and KPSS test for the first difference
Variable ADF Test KPSS Test
Lag t-Statistic critical values (5%) t-Statistic critical values (5%)
DLNS 0 -6.5275 -2.87764 0.293524 0.463
DR 0 -6.57396 -2.87764 0.088231 0.463
DLNTB 0 -13.3455 -2.87764 0.241816 0.463
DLNGDP 0 -13.2685 -2.87764 0.381038 0.463
DLNFER 2 -4.1122 -2.87782 0.271646 0.146
DLNS: the log difference of FX spot rate of RMB/USD; DR: the difference of interest rate differential between China and US; DLNTB: the log difference of trade balance differential between China and US; DLNGDP: the log difference of GDP growth differential between China and US; DLNFER: the log difference of foreign exchange reserve of China; DReform: dummy for the difference of reform.
According to the result of ADF test, the t-statistics of all variables are less than the critical level of 5%. However, based on the KPSS test, DLNFER is still non-stationary. Thus, we reject the null of a unit root in the first difference of series LNS, R, LNTB, LNGDP, DReform. Since the first difference of LNFER is not stationary, a test of second difference of LNFER should be applied.
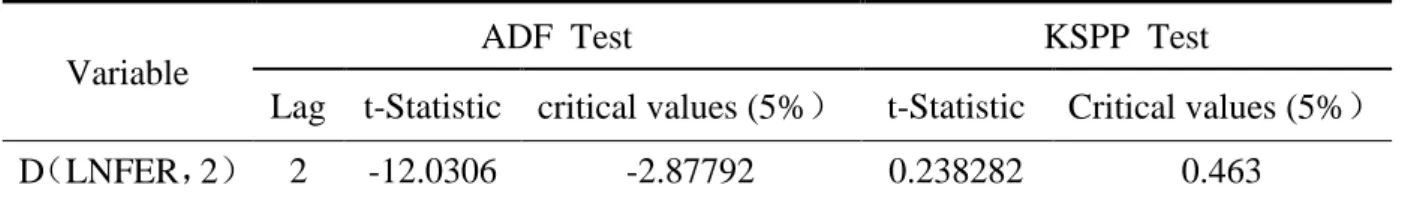
Table 5 - Augmented Dickey-Fuller test and KPSS test for the second difference
Variable
ADF Test KSPP Test
Lag t-Statistic critical values (5%) t-Statistic Critical values (5%)
D(LNFER,2) 2 -12.0306 -2.87792 0.238282 0.463
According to the results above, series P is stationary, series LNS, R, LNTB, LNGDP, Dreform are non-stationary, and the second difference of LNFER is stationary. Therefore, whenever needed, we will use differences for the non-stationary series.
6.2 The determinants of RMB exchange rate
Since the transformed variables are stationary, we can estimate an OLS model for the series, using the first or the second differences whenever needed.
t t t dif dif dif dif t P R TB GDP FER S t t t t 1 2 3 4 5 6Reform 4 (6.1)
Table 6 - Multiple linear regression (Dependent: DLNS; Method: Least squares)
According to the result above, the F-statistic of the model is 8.574137, and the P value is 0.00000 (lower than the significant level of 5%). Therefore, we reject the null hypothesis of the existence of zero coefficients. The model is statistically significant, which indicates that there is at least one explanatory variable that explain the changes
Variable Coefficient t-Statistic Prob.
C 0.001525 2.399422 0.0175 P 0.000496 2.745867 0.0067 DR -0.00577 -4.56189 0 DLNTB 0.00464 1.019848 0.3092 DLNGDP 0.004125 1.080189 0.2816 DLNFER2 -0.01799 -1.19156 0.2351 REFORM -0.00281 -5.06744 0 R-squared 0.23127 F-statistic 8.574137
of the dependent variable. Based on the R-squared (0.23127) and the adjusted R-squared (0.204297), it shows that the model can explain the relationship of variables well.
The P value of P, DR, and REFORM is lower than 5%, which shows that their coefficients are statistically significant. On the other hand, the P value of DLNTB, DLNGDP, and DLNFER2 is larger than 5%, which means their coefficients are not statistically significant. According to the results of the multiple linear regression model, there is a positive linear correlation between P and DLNS. When P increases by 1, DLNS will increase by 0.000496. And there is a negative linear correlation between DR and DLNS. When LNDR increases by 1, LNS will decrease by 0.00577. The coefficient of REFORM is -0.00281, which indicates that the reform in 2005 had a negative impact on LNS. The coefficient of REFORM is negative, which indicates that after the financial reform in 2005, the RMB/USD tended to decline.
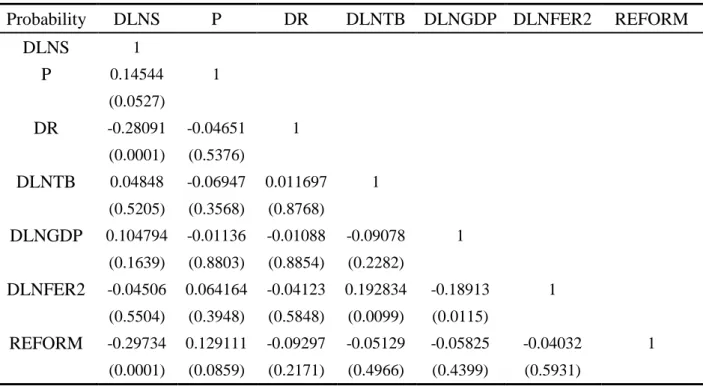
6.3 Pearson Correlations
According to the result of Pearson Correlation, the coefficient of DLNS and P is 0.14544, and the p value is 0.0527, which is lower than the significant level (10%). The result of the correlation test proves the existence of a positive linear regression between the FX spot rate and inflation rate differential of China and US, which confirms that the increase of inflation rates differential will contribute to the rise of RMB/USD exchange rate. The coefficient of DLNS and DR is -0.28091, and the p value is 0.0001, which is lower than the significant level (5%).
A negative linear regression between the FX spot rate and the interest rate differential of China and US shows that the increase of interest rate differential will lead to the decline of RMB/USD exchange rate. The coefficient of DLNS and LNTB is 0.04848, and the p value is 0.5205, which is higher than the significant level (10%). The coefficient of DLNS and DLNGDP is 0.104794, and the p value is 0.1639, which is
higher than the significant level (10%). Thus, there is a positive relationship between the FX spot rate and both trade balance differential and GDP growth differential of China and US. The coefficient of DLNS and DLNFER2 is -0.04506, and the p value is 0.5504, which is higher than the significant level (10%). The coefficient of DLNS and DREFORM is -0.29734, and the p value is 0.0001, which is lower than the significant level (5%). Therefore, there is a negative relationship between the FX spot rate and both foreign exchange reserve and reform. The results below are coherent with the conclusion of multiple linear regression test.
Table 7 - Pearson Correlations (p values in brackets)
Probability DLNS P DR DLNTB DLNGDP DLNFER2 REFORM
DLNS 1 P 0.14544 1 (0.0527) DR -0.28091 -0.04651 1 (0.0001) (0.5376) DLNTB 0.04848 -0.06947 0.011697 1 (0.5205) (0.3568) (0.8768) DLNGDP 0.104794 -0.01136 -0.01088 -0.09078 1 (0.1639) (0.8803) (0.8854) (0.2282) DLNFER2 -0.04506 0.064164 -0.04123 0.192834 -0.18913 1 (0.5504) (0.3948) (0.5848) (0.0099) (0.0115) REFORM -0.29734 0.129111 -0.09297 -0.05129 -0.05825 -0.04032 1 (0.0001) (0.0859) (0.2171) (0.4966) (0.4399) (0.5931)
7. Conclusion
This thesis reports the findings of an empirical analysis of potential determinants of RMB exchange rate. The analysis allows us to understand the behavior of the RMB exchange rate and the main drivers that explain the changes of this exchange rate.
Ordinary linear regression model was employed in the thesis. The results indicate that inflation rates differential between China and US, interest rates differential between China and US, trade balance differential between China and US, GDP growth differential between China and US, foreign exchange reserves of China and the financial reform of China in 2005 have an impact on the RMB exchange rate. Inflation rates differential, trade balance differential, and GDP growth differential between China and US are positively related to RMB exchange rate. Interest rate differential between China and US, foreign exchange reserves of China, and the financial reform of China in 2005 are negatively related to RMB exchange rate. Chinese government can maintain the stability of RMB exchange rate by adjusting the domestic interest rate and foreign exchange reserve. Financial institutions and investors can make appropriate respond to reduce the losses caused by RMB exchange rate through the changes of the relevant factors mentioned in the thesis. The result of the study can help investors to predict the changes of RMB exchange rate and make related decisions in their investment.
Some limitations of the study exist. First, the research focus mainly on RMB/USD exchange rate without mentioning other currencies. Since the United States is a super power in the world, its currency has caught great attention in the financial sector. Thus, the US dollar is the currency selected for the study. It is recommended to include other main currencies in the world, such as the Euro, the Yen, and the Pound. Second, the study mainly focuses on a number of macroeconomic factors, which are limited despite being relevant. Some factors like money supply, government spending, investors' expectations may also have an impact on the exchange rate. Future related
studies, may include additional economic factors. Third, the determinants of RMB exchange rate cannot be completely explained by linear regression analysis alone. Therefore, a number of alternative methods could be used to get a more accurate result.
In conclusion, the thesis contributes to a greater perception of the factors that influence RMB exchange rate. Understanding the behavior of RMB exchange rate may help governments, financial institutions and investors to make accurate and effective responses to the changes in the foreign exchange markets.
Bibliography
Balassa, B. (1964). The purchasing power parity: a reappraisal. Journal of Political Economy, 72(6), 584-584.
Chou, W. L., & Shih, Y. C. (1998). The equilibrium exchange rate of the Chinese Renminbi. Journal of Comparative Economics, 26(1), 165-174.
Copeland, L. S. (2008). Exchange rates and international finance. Pearson Education.
Frankel, J. A., & Wei, S. J. (2007). Assessing China's exchange rate regime. Economic Policy, 22(51), 576-627.
Gidis, M., Mangir, F., Ertugrul, H. M., & Sawhney, B. (2015). Purchasing power parity (PPP) between Chine and the US: An empirical comparative case study. Journal of Business Economics and Finance, 4(1).
Isard, P. (1995). Exchange rate economics. Cambridge University Press. 57
Li, F. Y. (2005). Parallel currency: theory, function and practice in the regional currency cooperation. Financial Research. 1, 65-73.
Li, Z. G. (2007). Political analysis on the change of RMB exchange rate policy. Northeast Normal University Press.
Liu, L. G., & Pauwels, L. L. (2012). Do external political pressures affect the Renminbi exchange rate?. Journal of International Money and Finance, 31(6), 1800-1818.
MacDonald, R. (2007). Exchange rate economics: theories and evidence. Psychology Press.
& Statistics, 46(2), 145-154.
Tian, L., & Chen, L. (2013). A reinvestigation of the new RMB exchange rate regime. China Economic Review, 24, 16-25.
Wang, K. (2012). Research on RMB exchange rate. Northwestern Polytechnical University Press.
Wang, Y., Hui, X., & Soofi, A. S. (2007). Estimating renminbi (RMB) equilibrium exchange rate. Journal of Policy Modeling, 29(3), 417-429.
Xie, C., Mao, Z., & Wang, G. J. (2014). Forecasting RMB Exchange Rate Based on a Nonlinear Combination Model of ARFIMA, SVM, and BPNN. Mathematical Problems in Engineering.
Xu, Z. (2008). China's exchange rate policy and its trade balance with the US. Review of Development Economics, 12(4), 714-727.
Yi, G. & Fan, M. (1997). Analysis of determinants and trends of RMB exchange rate. Economic Research, 10, 26-35.
Appendices
Table 8-OLS test
Dependent variable: DLNS Method: Least squares