Conversion of land use and cover in northwest Amazon (Brazil)
1Carlos Antonio da Silva Junior2, Marcos Rafael Nanni2,
Anderson Antonio da Silva2, Everson Cezar2, Franciele Romagnoli2
INTRODUCTION
The increasing exploitation of natural resources in a disorderly way has been demanding constant monitoring of its status and occupation mode by inspection and ecologic-economic zoning (Duarte et al. 1999). Currently, a focused area for these procedures is the Amazon, described by Becker
ABSTRACT
RESUMO
(2005) as the largest existing portion of tropical forest in the world. This biome has been suffering intense modification since 1970, due to rural occupations which modified the landscape with the deforestation of millions of hectares for pastures, colonization projects and agrarian reform (Alves et al. 2001), so that, in 2004, it was recorded the second highest rate of deforestation, with 26,130 km2 (Barreto et al. 2005).
1. Article received in Aug./2013 and accepted for publication in May/2014 (Registration number: PAT 26210). 2. Universidade Estadual de Maringá (UEM), Departamento de Agronomia, Maringá, PR, Brasil.
E-mails: [email protected], [email protected], [email protected], [email protected], The increasing use of natural resources in a disor-derly way has been demanding constant monitoring and ecological-economic zoning. The knowledge on land use and cover allows that measures that guarantee the preservation, maintenance of the environment and space management be appropriate to the reality, since through these factors it is possible to follow the probable environmental impacts and the socioeconomic development of a place in several contexts. The Geographical Information System (GIS) and remote sensing techniques have been applied to land use and land cover mapping. This study aimed to analyze the conversion of land use from different perspectives, concerning geoprocessing techniques, in the southeastern of Roraima State, Brazil, in two distinct periods. In order to verify the land use and cover, two analyses were conducted, using the Spring and TerraView softwares. Great part of the cultivated areas was converted into capoeira, what probably denotes an ending of profitable agriculture, as well as its abandonment caused by the nutritional deficiency of the soil, that became inappropriate for cultivation in the subsequent years. A fuzzy logic would possibly fit well to the types of data analyzed, because the attribute query is overly complex.
KEY-WORDS: Geoprocessing; remote sensing; Geographic Information System (GIS); human settlements.
Conversão de uso e cobertura do solo no noroeste da Amazônia (Brasil)
O crescente aproveitamento dos recursos naturais de forma desordenada tem demandando constante acompanhamento, por meio
de fiscalização e zoneamento ecológico-econômico. O conhecimento
do uso e cobertura do solo permite que as medidas que garantem a
preservação, manutenção do meio ambiente e gestão do espaço sejam
adequadas à realidade, já que, por meio destes fatores, é possível acompanhar os prováveis impactos ambientais e o desenvolvimento socioeconômico de um local, nos mais diversos contextos. As técnicas de geoprocessamento e sensoriamento remoto, aliadas
ao Sistema de Informação Geográfica (SIG), vêm sendo aplicadas
em mapeamento de uso e cobertura do solo. Este estudo objetivou
analisar a conversão do uso de ocupação do solo de diferentes
ângulos, no que diz respeito às técnicas de geoprocessamento, em
duas datas distintas, na porção sudeste do Estado de Roraima. Com
o auxílio dos programas computacionais Spring e TerraView, foram
realizadas duas análises, para verificação do uso e ocupação do solo.
Grande parte das áreas cultivadas foi convertida em capoeira, o que, provavelmente, denota uma não continuidade da agricultura com
fins lucrativos, bem como o seu abandono, causado pela deficiência nutricional do solo, que se tornou impróprio para o cultivo, nos anos posteriores. Possivelmente, uma lógica nebulosa (fuzzy) se adequaria bem aos tipos de dados analisados, pois a consulta por atributo apresenta exagerada rigidez de análise.
PALAVRAS-CHAVE: Geoprocessamento; sensoriamento
remoto; Sistema de Informação Geográfica (SIG); assentamentos
As a result of the deforestation in the Amazon region, several modifications have occurred (Soares-Filho et al. 2005), due to several factors, including socioeconomic, physical and cultural factors that determine types of land use and cover, resulting in different spatial and temporal patterns (Machado 1998). For this, the land use change found in this region can be attributed to land use differentiation and property structure (Castro 2005).
The knowledge on land use allows the implementation of measures that will supervise the preservation and maintenance of the environment and ensure that the space management is appropriated to the reality, since through these factors it is possible to monitor the probable environmental impacts and socio-economic development of a place, concerning global and municipal scales (Montebelo et al. 2005, Schlindwein et al. 2007).
The geoprocessing and remote sensing techniques, combined with the Geographic Information System (GIS), have been applied in land cover and land use mapping. According to Batistella (2005), these techniques play a fundamental role in understanding current and future changes on the landscape.
The use of multiple criteria, such as administra-tive boundaries, regular cells, micro-regions, irregular polygons, geomorphological sectors or homogeneous areas, as the basic territorial unit, established in the ecologic-economic zoning based on concepts of landscape units (Ab’Saber 1989, Kaimowitz et al. 2002, Laurance et al. 2002), can be used to point out regional differences and to understand their geographic distribution.
The space segmentation can be performed using time-series data from satellite images, which make possible to monitor the development of land cover and identify different processes of its transformation (Escada 2003).
This study aimed to analyze the conversion of land use and cover from different perspectives, regarding techniques of geoprocessing and remote sensing, in two different periods, in the southeastern of Roraima State, in the northwest Amazon, Brazil.
MATERIAL AND METHODS
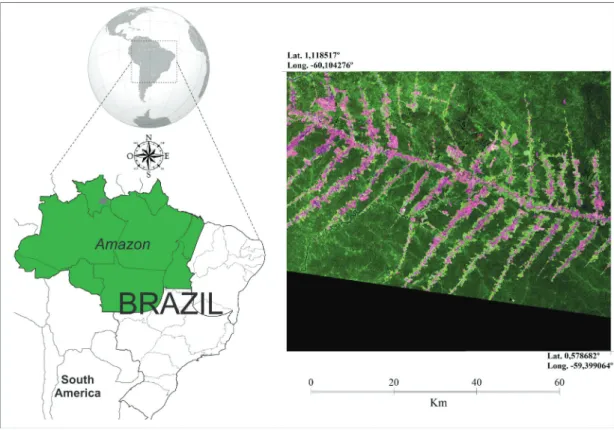
The study area is located in the southeastern of Roraima State (Figure 1), where the predominant
Figure 1. Study area in gray on the map of Brazil magnified by the image sensor TM onboard Landsat-5 and constituted false-color
vegetation is represented by a dense submontane rain forest. This forest type occupies the strongly dissected area of Guyanese Complex (Domain Structural Anauá-Jatapu). The topography of the area varies from flat to undulating, predominating the gently undulating areas (IBGE 2005b). According to the Köppen-Geiger classification, the climate of this region is Am, characterized by a dry season, which coincides with the boreal winter, presenting less than 60 mm rainfall a month.
The area is divided into four soil groups: Ultisol dystrophic, Oxisol dystrophic, Ultisol dystrophic plinthic and Litholic with rocky outcrops (IBGE 2005a), being a great part composed by Oxisols and Ultisols.
To perform the image classification, Novo (2010) and Jensen’s (2009) procedures were adopted, which can be summarized in three main steps: a) pre-processing; b) highlight; c) classification. The GIS used in this step was the Georeferenced Information Processing System (SPRING 5.2), developed by the National Institute for Space Research (INPE) (Câmara et al. 1996).
The images were classified as forest, capoeira, clear pasture, dirty pasture and agriculture, using the Bhattacharya algorithm (equation bellow), as described in Silva Junior & Bacani (2011), with similarity thresholds of 10, area of 20, and acceptance of 99.9% (Xaud et al. 2011):
(
)
∑
(
)
∑
∑
∑
− + − − = 2 1 2 1 T j i m j m i ln 2 1 mj) (mi m 2 m 1 2 1 pj) B(pi,where B = Bhattacharya distance; pi and pj = pixels in classes i and j; mi and mj = averages of classes i and j; T = transposed matrix; ln = natural logarithm; i and j = classes in context.
The images were obtained using the thematic mapper (TM) sensor classification (orbit 231, point 59), with a spatial resolution of 30 m x 30 m (bands 1, 2, 3, 4, 5 and 7), aboard the Landsat-5, in 2004 and 2010.
To start, the scenes were duly registered before classification, obtained from the NASA website and orthorectified with datum and projection UTM-WGS1984 (GLCF 2004), using the first-degree polynomial and nearest neighbor interpolation. The root mean square (RMS) was less than 0.5 pixels (Dai & Khorram 1998).
Secondly, buffers were conducted with distances of 0-2 km, 2-4 km and 4-8 km, in rivers,
urban areas and highways, using data from the Ecological and Economic Zoning (ZEE-RR), in order to verify the occurrence of land cover change. Then, a cross-tabulation (intersection) was performed between the thematic maps of 2004 and 2010.
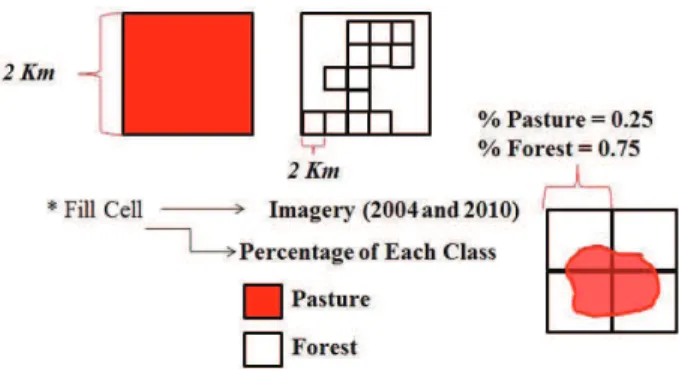
Finally, after the previous analyzes and the images properly classified, based on the dimensions and spatial arrangements of features of interest, thematic maps of 2 km x 2 km were created (Gavlak et al. 2011), using TerraView 4.2.0 (INPE 2010) (Figure 2).
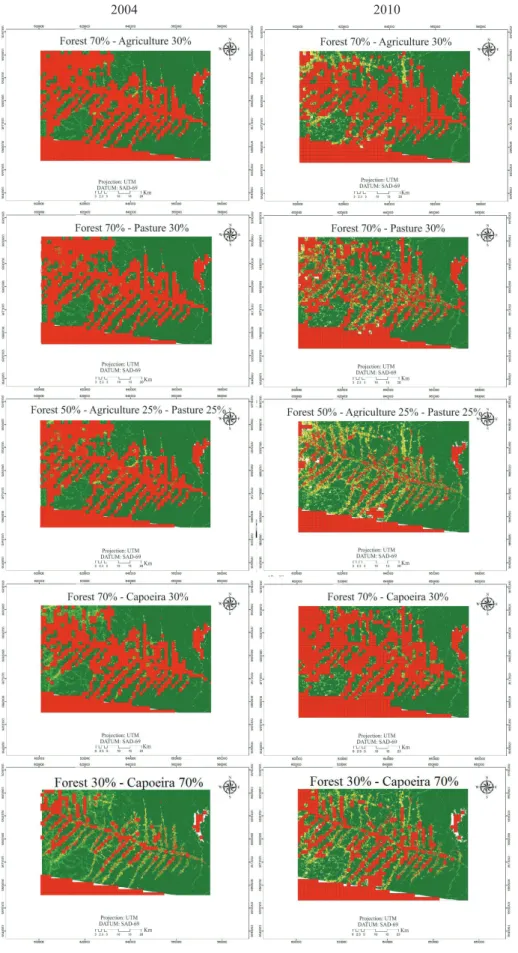
By using descriptive statistics and frequency distribution histograms analysis for the mentioned classes (FAO 2000), thematic maps were created through consultation by attributes, characterized as: a) Type I : 70% forest and 30% agriculture; b) Type II: 70% forest and 30% clear and dirty pasture; c) Type III: 50% forest, 25% agriculture and 25% clear and dirty pasture; d) Type IV: 70% forest and 30% capoeira; e) Type V: 70% capoeira and 30% forest. For this, the plugin fill the cell TerraView 4.2.0 was used, enabling to calculate the values for each class of table associated with the PI’s cell type. The processes of grid cell analyzes are shown in Figure 3.
Figure 2. Grid cell method applied to the percentage analysis of each class studied.
Figure 3. Procedure for analysis by grid cell depending on the type of converted classes.
RESULTS AND DISCUSSION
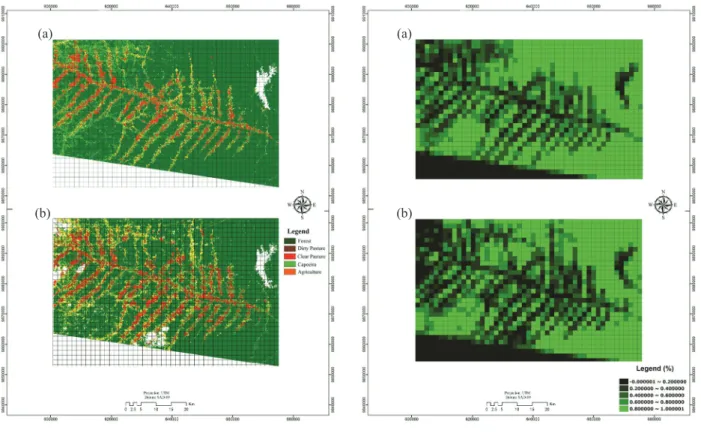
The area was classified in a total of 133,751.16 ha in 2004 (Kappa 0.78) and 158,337.63 ha in 2010 (Kappa 0.63), and the disposition is shown in the grid cell (Figure 4). After the creation of the grid cells, one cluster analysis was performed (each cell ranging between 0 and 1) (Figure 4).
For 2010, the visual analysis of the area allowed us to conclude that there was an increase of capoeira and agricultural areas along the “fishbone”, characteristically formed by deforestation, due to rural occupation and its development.
It is possible to observe that there was no increase in forest class, mainly along the “fishbone”. Between the years 2004 and 2010 (Figure 4), an increase was noticed in forest areas, mainly where there was already an increase of deforestation and forest areas, in some cells in the upper left of the area under study.
Figure 5 shows information on land use of the study area, for both years. It should be pointed out that there was deforestation during this six years period, falling from 68% to 62% and from 12% to 9%, in areas known as capoeira. The opposite occurred in
grazing areas and agriculture, with an increase of 1% and 8%, respectively.
In some regions, it is notable the agricultural growth between 2004 and 2010, with a magnitude of 32,185.44 ha. In areas of dirty pasture practically no changes occurred over the years, and possibly part of the agricultural growth replaced capoeira areas (Figure 5).
Figure 4. Study area classified by the algorithm Battacharya and grid cell in 2004 (a) and 2010 (b).
Figure 5. Area of classes (ha) and its conversion, from 2004 to 2010.
(a) (a)
The result from the cross-tabulation, in terms of the classes analyzed (Table 1), indicates the reduction of capoeira areas, mostly replaced by dirty pastures and agriculture. Most of the farmland turned into capoeira, what probably demonstrates a continuation of non-profit agriculture and its abandonment, caused by nutritional deficiency of the soil and thus becoming unfit for cultivation in subsequent years.
The decrease of 6% in forest areas (Figure 5) is related to the conversion of those areas, primarily
to capoeira and agriculture, what demonstrates abandonment after deforestation for family farming and logging without practices of soil conservation. According to the results presented in Table 1, there was a decrease of dirty pasture and capoeira areas near urban centers and forest areas, possibly in function of advancing urbanization in their surroundings.
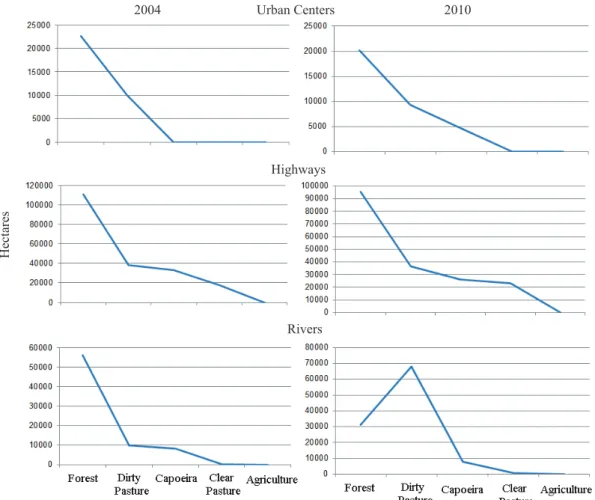
The forest areas decreased due to highways, and dirty pasture remained constant over the years (Figure 6). Those deforestation areas were
2004
Forest Dirty pasture Clear pasture Capoeira Agriculture
2010
Forest 236,361.69 81.54 633.15 13,922.01 1,591.47
Dirty pasture 5,932.89 8,465.04 16,906.05 5,852.52 4,353.66
Clear pasture 3,511.80 6,508.98 9,957.42 3,649.05 2,537.64
Capoeira 12,670.92 1,485.72 6,797.16 10,054.26 5,115.42
Agriculture 21,394.26 1,545.93 6,372.63 16,279.56 7,833.33
Table 1. Cross-tabulation for the class conversion functions (ha), from 2004 to 2010.
Figure 6. Urban centers, highways and rivers buffer areas (ha) (8 km) depending on the land use and conversion in the Amazon region. Urban Centers
2004 2010
Hectares
mainly converted into capoeira, maybe due to the construction and expansion of asphalt, as it is possible to observe next to the roads. Construction was a huge issue to this area, so that after the abandonment of the adjacent areas the capoeira arrived.
It was observed a decrease of forest areas close to the rivers, which was already expected, due to the conservation of riparian forests. However, the increase of dirty pasture showed the presence of cattle ranching, maybe caused by the need of animals having to refresh and quench the thirst, that probably would not be removed by lack of water resources (Figure 6).
The theme maps generated as a result of Type I (2004 and 2010) are shown in Figure 7. Note that, in 2010, there was a decrease of 70% of cells, with an increase in forest and agriculture classes. This was detected by the Type II (Figure 7), where there was 30% of pastures in the cell. For 2010, scattering of cells was observed for this characteristic, which, for the year 2004, followed the “fishbone” pattern.
Through the analyses of the absolute and relative frequency of each class found in each cell, in 2004 and 2010, respectively, class forest near zero was identified in almost 300 cells, in both periods. Cells around one occurred in approximately 250 cells, in 2004, and also around 250 cells, in 2010. In the other classes, the predominance of frequency was near zero, and only the clean and dirty pastures were highlighted in more than 1,000 cells.
The Type III (Figure 7) showed a considerable conversion of land use between 2004 and 2010, where, in the last year, there were almost no cells with 50% of forest with pasture and agriculture. There was an increase of forested areas predominantly with capoeira, in 2010, which can be seen in the left part of the thematic map, corroborating the results of Figure 7.
In Type V (Figure 7), there were only a few numbers of cells with 30% of the forest class, but with an increasing, in 2010, still prevailing in the upper right portion of the thematic map.
CONCLUSIONS
1. The methodology applied proved to be useful for monitoring land use and land use change. 2. There was a considerable increase in land use and
occupation for agriculture and clear pasture. 3. A decrease in capoeira areas was observed, as well
as a decrease of approximately 6% in forest areas,
which were mainly converted into agriculture and new capoeira areas.
4. There was an increase of capoeira areas near urban centers and a decrease near highways and rivers. 5. The cell filling by percentage of class proved to be
useful in defining areas with different land uses and occupations, mainly in small proportions.
6. A fuzzy logic would possibly fit well to the types of data analyzed, because the attribute query is overly complex.
ACKNOWLEDGEMENTS
The authors thank the Conselho Nacional de Desenvolvimento Científico e Tecnológico (CNPq) and Coordenação de Aperfeiçoamento de Pessoal de Nível Superior (Capes) by research grants awarded, and Reviewers and Editors for their valuable comments and contributions to improve the manuscript.
REFERENCES
AB’SABER, A. Zoneamento ecológico e econômico
da Amazônia: questões de escala e método. Estudos Avançados, São Paulo, v. 3, n. 5, p. 4-20, 1989.
ALVES, D. S. et al. O processo de desflorestamento na
Amazônia. Parcerias Estratégicas, Brasília, DF, v. 12, n. 1, p. 259-275, 2001.
BARRETO, P. et al. Pressão humana no bioma Amazônia. Belém: Imazon, 2005.
BATISTELLA, M. Contribuições para a classificação e
monitoramento do uso e cobertura das terras na Amazônia. In: SIMPÓSIO BRASILEIRO DE SENSORIAMENTO REMOTO, 12., 2005, Goiânia. Anais... São José dos Campos: INPE, 2005. p. 2859-2861.
BECKER, B. K. Geopolítica da Amazônia. Estudos Avançados, São Paulo, v. 19, n. 53, p. 71-86, 2005.
CÂMARA, G. et al. SPRING: integrating remote sensing and GIS by object-oriented data modelling. Computers & Graphics, New York, v. 20, n. 3, p. 395-403, 1996.
CASTRO, E. M. R. Dinâmica socioeconocômica e desmatamento na Amazônia. Novos cadernos NAEA, Belém, v. 8, n. 2, p. 5-39, 2005.
Figure 7. Grid cell in 2004 and 2010 for the five typologies used for the verification of the land use and conversion activities in
the region.
DUARTE, V. et al. Metodologia para a criação de dados
digitais da Amazônia - Projeto BADDAM. São José dos
Campos: INPE, 1999.
ESCADA, M. I. S. Evolução de padrões de uso e cobertura
da terra na região centro-norte de Rondônia. 2003.
264 f. Tese (Doutorado em Sensoriamento Remoto) - Instituto Nacional de Pesquisas Espaciais, São José dos Campos, 2003.
FOOD AND AGRICULTURE ORGANIZATION OF THE UNITED NATIONS (FAO). Land cover classification system (LCCS): classification concepts and user manual. Version 1.0. Rome: FAO, 2000.
GAVLAK, A. A. et al. Padrões de mudança de cobertura da terra e dinâmica populacional no Distrito Florestal
Sustentável da BR-163: população, espaço e ambiente.
2011. 155 f. Dissertação (Mestrado em Sensoriamento
Remoto) - Instituto Nacional de Pesquisas Espaciais, São José dos Campos, 2011.
GLOBAL LAND COVER FACILITY (GLCF). Geocover technical guide. Maryland: University of Maryland, 2004.
INSTITUTO BRASILEIRO DE GEOGRAFIA E ESTATÍSTICA (IBGE). Mapa exploratório de solos. 2005a. 1 mapa. Escala: 1:1.000.000. Available at: <http:// www.ibge.gov.br/mapas_ibge/tem_solos.php>. Acess on: 15 May 2012.
INSTITUTO BRASILEIRO DE GEOGRAFIA E ESTATÍSTICA (IBGE). Mapa de vegetação. 2005b. 1 mapa. Escala: 1:1.000.000. Available at: <http://www. ibge.gov.br/mapas_ibge/tem_vegetacao.php>. Acess on: 15 May 2012.
INSTITUTO NACIONAL DE PESQUISAS ESPACIAIS (INPE). TerraView 4.2.0. São José dos Campos: INPE, 2010.
JENSEN, J. R. Remote sensing of the environment: an earth resource perspective. 2. ed. New Jersey: Prentice Hall, 2009.
KAIMOVITZ, D. et al. Spatial regression analysis of deforestation in Santa Cruz, Bolivia. In: WOOD, C. H.; PORRO, R. (Eds.). Deforestation and land use in the Amazon. Gainesville: University Press of Florida, 2002. p. 41-56.
LAURANCE, F. W. et al. Predictors of deforestation in the Brazilian Amazon.Journal of Biogeography, Oxford, v. 29, n. 5-6, p. 737-748, 2002.
MACHADO, L. A fronteira agrícola na Amazônia. In: BECKER, B. K. et al. (Eds.). Geografia e meio ambiente no Brasil. São Paulo: BK Becker, 1998. p. 181-217.
MONTEBELO, L. A. et al. Relação entre uso e cobertura do solo e risco de erosão nas áreas de preservação permanente
na bacia do Ribeirão dos Marins, Piracicaba - SP. In: SIMPÓSIO BRASILEIRO DE SENSORIAMENTO REMOTO, 12., 2005, Goiânia. Anais... São José dos Campos: INPE, 2005. p. 3829-3836.
N AT I O N A L A E R O N A U T I C S A N D S PA C E ADMINISTRATION (NASA). Global land cover facility. 2012. Available at: <http://glcf.umiacs.umd.edu/index. shtml>. Acess on: 12 Apr. 2012.
NOVO, E. M. L. M. Sensoriamento remoto: princípios e
aplicações. 4. ed. São Paulo: Blucher, 2010.
SCHLINDWEIN, J. R. et al. Mapeamento do uso e cobertura do solo do município de Caxias do Sul (RS) através de imagens do satélite CBERS. In: SIMPÓSIO BRASILEIRO DE SENSORIAMENTO REMOTO, 13.,
2007, Florianópolis. Anais... São José dos Campos: INPE, 2007. p. 1103-1107.
SILVA JUNIOR, C. A.; BACANI, V. M. Aplicação de diferentes métodos de classificação supervisionada de imagem Landsat-5/TM na identificação de cana-de-açúcar.
In: SIMPÓSIO BRASILEIRO DE SENSORIAMENTO REMOTO, 15., 2011, Curitiba. Anais... São José dos Campos: INPE, 2011. p. 85-92.
SOARES-FILHO, B. S. et al. Cenários de desmatamento para a Amazônia. Estudos Avançados, São Paulo, v. 19, n. 54, p. 138-152, 2005.
XAUD, M. R.; EPIPHANIO, J. C. N.; XAUD, H.
A. M. Análise das mudanças de uso e cobertura da