Arq. Bras. Med. Vet. Zootec., v.63, n.5, p.1272-1276, 2011
Communication
[
Comunicação]
Milk composition during duodenal infusion of conjugated linoleic acid in dairy goats fed diets with different C18:2/C18:1 ratios
[Composição do leite durante a infusão duodenal de ácido linoléico conjugado em cabras leiteiras alimentadas com rações com diferentes proporções de C18:2/C18:1]
Ph. Schmidely1 and P.V.D. Andrade2
1
INRA-AgroParisTech UMR PNA, Physiologie de la nutrition et alimentation 16, rue Claude Bernard, 75231 Paris Cedex 05 - France
2
Former PhD student in the UMR Physiologie de la nutrition et alimentation
Conjugated linoleic acid (CLA) refers to a collective term for a group of different positional and geometric isomers of octadecadienoic acid that contain a pair of double bonds in a conjugated configuration. CLA is a natural component of food products derived from ruminants and some of its isomers have beneficial effects on human health. Thus, increasing the CLA content of milk fat may enhance the nutritive value of dairy products. However, in dairy cows, the t10,c12-C18:2 isomer of CLA is a potent inhibitor of milk fat synthesis (Baumgard et al., 2000). In the mammary gland of cows, the t10,c12-C18:2 inhibits the lipid metabolism, specially the de novo fatty acids (FA) synthesis, as the reduction in the percentage of C4:0 to C16:0 may account for up to 78 % of the reduction in milk fat content (MFC) (Baumgard et al., 2000; 2002).
In dairy goats, a duodenal infusion of a 2g-dose of t10,c12-C18:2 during three days did not reduce milk fat synthesis (Andrade and Schmidely, 2006), but it reduced the delta9-desaturase activity in the mammary gland, as observed in dairy cows (de Veth et al., 2004). The response of milk FA composition and delta9 -desaturase activity in the mammary gland of dairy goats to t10,c12-C18:2 infusion was not affected by dietary treatments inducing different levels of c9-C18:1 intake and similar intakes of c9,c12-C18:2 (Andrade and Schmidely, 2006). Studies with dairy cows showed that the
Recebido em 20 de julho de 2010 Aceito em 2 de agosto de 2011
Autor para correspondência (corresponding author) E-mail: andrade.pvd@gmail.com
response to t10,c12-C18:2 infusion was not affected by the intake of c9-C18:1 or c9,c12-C18:2 despite the differences in milk composition observed when feeding diets rich in oleic or linoleic acids (Loor et al., 2002). However, goats and cows responded differently to lipid supplementation (Chilliard and Ferlay, 2004) and results obtained in cows do not necessarily reflect what is observed in goats. Consequently, the hypothesis of this research was that the response of milk FA composition to t10,c12-C18:2 infusion in goats could be affected by the ratio between c9,c12-C18:2 and c9-C18:1 intakes because the biohydrogenation of this FA produces different trans and CLA, altering the pool of FA arriving in the mammary gland. Thus, it was evaluated the effect of a duodenal infusion of t10,c12-C18:2 on milk FA composition and delta9-desaturase index in the mammary gland of goats fed different combinations of high- vs low- percentage of concentrate and extruded soybeans vs rolled canola seeds.
was c9-C18:1 when CS was fed (L-CS: 33.0%, H-CS: 45.0% of total FA) and c9,c12-C18:2 when SB was fed (L-SB: 39.6%, H-SB: 47.8%). Ratios of intake for c9,c12-C18:2 to c9-C18:1 were 0.58, 0.76, 2.30, and 2.50 for H-CS, L-CS, H-SB, and L-SB diets, respectively. Forage part of the total mixed diet (TMD) was grass hay and dehydrated alfalfa in a 1:3 ratio. The TMD were formulated to meet or exceed nutrient requirements (Ruminant..., 1989). The diets with the same percentage of concentrate were iso-nitrogenous and iso-energetic. The goats were fed their experimental TMD (2 goats/diet) for 7 wk prior to the infusion periods.
The infusion procedure, the preparation of the emulsions, and the milk FA analysis were detailed by Andrade and Schmidely (2006). Briefly, the infusions were carried out for 2 wk, with four goats (one goat/diet) infused each wk. The infusion of t10,c12-C18:2 emulsion (2g of free FA with purity>98%) in skim milk was given during three consecutive days and followed by a 2d-infusion of skim milk alone (no t10,c12-C18:2, SM). The duration of each infusion was 10h per day, starting 1h after the morning feeding. The dry matter intake (DMI) was recorded daily. Individual milk sampling (30mL per milking) started in the evening before the first day (Basal) of t10,c12-C18:2 infusion and ended in the morning following the last day of SM infusion. Two aliquots of milk were collected. The first aliquot containing Bronopol was stored at 4°C until analysis of fat, protein, and lactose by IR analysis (Milkoscan; Foss Electric, Hillerød, Denmark). The second aliquot without conservative was stored at -20 °C until analysis of milk FA profile. Milk FA were extracted with ethanol/12 N HCl/hexane and they were methylated at room temperature with a methanolic boron trifluoride solution. Samples of methyl-esters were injected into a gas chromatograph (Varian Chromopack CP 3800; Varian SA, Les Ulis, France) equipped with a flame ionization detector and a 100mx0.25mm i.d. fused silica capillary column (CP Sil-88). The carrier gas was ultrapure helium. The initial temperature was 50°C (for 1 min), increased 10°C/min to 170°C (for 78min), and increased 5°C/min to 220°C (for 15 min). Individual FA were identified by comparison with retention time to those of pure standards (Supelco Inc, Bellefonte, USA).
Data for DMI, milk yield, and composition obtained during the last two days of t10,c12-C18:2 infusion were averaged by goat, as well as the data obtained during the second day of SM infusion. Data obtained before starting the infusions (basal), and during the t10,c12-C18:2 and the SM infusion were analyzed as a factorial design with repeated measures using the MIXED Procedure of Statistical... (2000) as described by Andrade and Schmidely (2006). The effects of infusion were associated with the effect of time (repeated measures for a same goat, with time=0 for basal, time=1 for t10,c12-C18:2 infusion, and time=2 for SM infusion). The relevant comparison for the effect of t10,c12-C18:2 infusion was time=1 vs time=0, whereas the comparison between time=1 vs time=2 determined eventual carry-over effects of t10,c12-C18:2 during SM infusion.
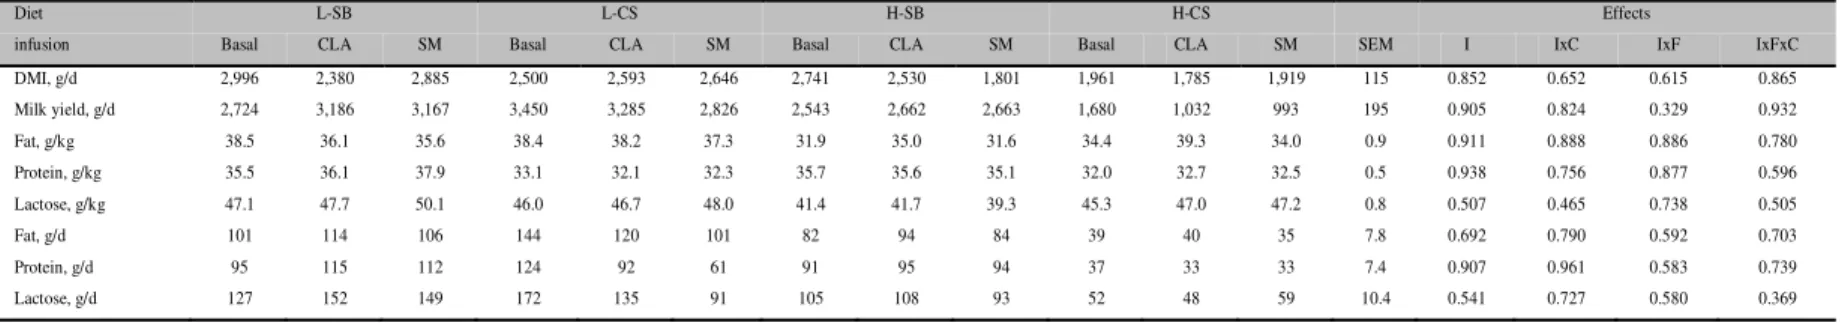
Before the infusion (basal), goats fed H diets, especially H-CS, had lower (P<0.05) DMI and lower milk, fat, protein, and lactose yields (Table 1) than those fed the L diets. This was due to one goat fed the H-CS diet that had a very low DMI and milk yield from the beginning of the trial. Experimental diets had no significant effect on the milk contents of fat and lactose, and feeding SB slightly increased (P<0.01) milk protein content. The percentage of short-chain FA (C4:0 to C8:0) was similar among groups. Feeding CS reduced (P<0.05) the content of medium-chain (C10:0 to C15:0) and C16:0 and increased the content of c9-C18:1, total trans-C18:1, and t10-C18:1 in milk fat. Feeding SB increased (P<0.05) the content of t11-C18:1, c9,t11-C18:2, and c9,c12-C18:2. Overall, these results agree with data obtained in dairy cows (Loor and Herbein, 2003). Feeding H diet increased the content of total trans-C18:1 and t10-C18:1 as observed in dairy goats (Calderon et al., 1984) and cows (Piperova et al., 2002).
Schmidely and Andrade
1274
Arq. Bras. Med. Vet. Zootec., v.63, n.5, p.1272-1276, 2011 of short-chain, medium-chain, C16:0, orc9-C16:1 (Table 2), which may explain the lack of MFC depression. These results are in line with Andrade and Schmidely (2006), and they confirm that lipid synthesis in goat is not very sensitive to t10,c12-C18:2. In dairy goats, a reduction in the MFC (up to 5%) was reported, but only when they were fed larger amounts (10 to 15g of t10c12-C18:2) of CLA supplements (Lock et al., 2008). Major reductions in goat milk fat yield (20 to 49 %) and content (16 to -36 %) were only obtained when fed very high doses (up to 30g of t10,c12-C18:2) of ruminal-protected supplements of CLA during several days (Lock et al., 2008; Shingfield et al., 2009). This shows that milk fat synthesis in goats is responsive to t10,c12-C18:2, but, comparing to cows, a larger amount of these FA and/or a extended period of supplementation is need to provoke a significant reduction in MFC. The composition of the diet may also influence in the response of the goats and the differences between cows and goats (Shingfield et al., 2009). In dairy goats, feeding high concentrate diets and/or diets rich in lipids may enhance MFC while in cows this type of diet often cause a depression in the MFC (Chilliard and Ferlay, 2004). The reasons for the differences between fat metabolism in cows and goats are not fully understood. After the infusion (Table 2) or the feed supplementation (Lock et al., 2008) the t10,c12-C18:2 is transferred to milk indicating that the difference between cows and goats is probably due to differences in the post-absorptive metabolism of this CLA isomer rather than to the uptake and the incorporation of this FA in milk fat (Andrade and Schmidely, 2006; Lock et al., 2008).
However, in dairy goats, as in dairy cows, the infusion of t10,c12-CLA reduced the percentage of c9,t11-C18:2 in milk fat and it tended to increase that of t11-C18:1. It also reduced the
c9-C18:1 and it was accompanied by an increase in C18:0, reflecting in a reduction in the proxy of mammary delta9-desaturase activity. The c9,c12-C18:2 was also reduced during the CLA infusion.
Contrary to this research hypothesis, the response of milk FA to the t10,c12-C18:2 infusion was independent of the diet (interaction infusion x dietary factors: P>0.10, excepting for t10c12-C18:2 in milk fat). There was no significant effect of the interaction between the infusion of t10,c12-C18:2 and the dietary treatments on the proxy of the delta9-desaturase activity estimated by the ratio c9,t11-C18:2/c9-C18:1 or c9-c9,t11-C18:2/c9-C18:1/C18:0. This is in line with data obtained during the infusion of t10,c12-C18:2 in dairy cows fed oleic or linoleic acids (Loor and Herbein, 2003). These data indicate that goats and cows respond similarly for the decrease of delta9-desaturase activity to t10,c12-C18:2, and that response is independent of the dietary FA profile.
In conclusion, the duodenal infusion of t10,c12-C18:2 (2g, i.e. 0.08% of DMI or 0.03g/kg of body weight) did not affect the milk fat content or the fat yield of dairy goats, despite the high content of this FA in milk fat. This was related to the lack of inhibition of de novo FA synthesis in the mammary gland, independently of the FA profile of diet. The results of this research confirmed that lipid synthesis in goats mammary gland was not very sensitive to t10,c12-C18:2, contrary to data in cows. However, inhibition of delta9-desaturase activity of mammary gland was similar between goats and cows, and this response was independent of the FA profile of the diet.
Milk co
mpositio
n during duodenal...
Zootec.
, v
.63, n.5
,
p.1272-1276, 2011
1275
rolled canola seeds (CS) before (basal) and during duodenal infusion of t10,c12-C18:2 emulsion (CLA) or skim milk (SM)
I: infusion effect; IxF: interaction between effect of infusion and fat addition; IxC: interaction between effect of infusion and percentage of concentrate; IxFxC: interaction of infusion effect, fat addition, and percentage of concentrate. DMI: dry matter intake, SEM: standard error of mean.
Table 2. Milk fatty acid profile of mid-lactation dairy goats fed low (L) or high (H) percentages of concentrate diets with extruded soybeans (SB) or rolled canola seeds (CS) before (basal) and during duodenal infusion of t10,c12-C18:2 emulsion (CLA) or skim milk (SM)
Diet L-SB L-CS H-SB H-CS Effects
infusion Basal CLA SM Basal CLA SM Basal CLA SM Basal CLA SM SEM I IxC IxF IxFxC
Fatty acid % of total fatty acids
C4:0 to C8:0 6.76 8.23 7.06 5.95 7.44 5.16 6.82 7.88 6.79 6.36 6.71 5.38 0.28 0.141 0.858 0.767 0.947 C10:0 to C15:0 29.96 31.11 28.71 27.87 30.70 23.12 32.27 32.79 31.34 28.36 27.99 24.66 0.82 0.196 0.794 0.629 0.909
C16:0 28.70 29.03 26.97 26.37 26.00 26.48 31.12 28.57 28.47 24.18 22.07 22.12 0.65 0.387 0.603 0.874 0.814
c9-C16:1 0.42 0.41 0.68 0.55 0.46 0.56 0.57 0.45 0.49 0.49 0.39 0.45 0.02 0.125 0.244 0.445 0.663
C18:0 11.51 12.69 13.27 8.22 12.28 10.61 5.94 9.47 8.81 10.45 16.72 16.13 0.73 0.024 0.604 0.807 0.550
total trans-C18:1 1.71 1.87 1.76 1.79 1.73 1.82 1.66 2.01 2.07 2.21 2.57 2.23 0.06 0.115 0.273 0.554 0.278
t10-C18:1 0.26 0.33 0.29 0.21 0.34 0.27 0.23 0.34 0.32 0.37 0.49 0.38 0.02 0.000 0.925 0.304 0.288
t11-C18:1 0.76 0.79 0.81 0.95 1.04 0.94 0.80 1.05 1.02 0.83 1.02 0.86 0.03 0.073 0.369 0.824 0.406
c9-C18:1 16.29 10.84 15.14 16.29 10.84 15.14 13.34 10.74 13.34 19.67 15.49 21.02 0.82 0.004 0.590 0.316 0.757
c9,c12-C18:2 1.90 1.64 2.35 2.99 2.55 2.93 2.78 2.71 3.05 1.94 1.52 1.72 0.12 0.030 0.621 0.933 0.231
c9,t11-C18:2 0.19 0.12 0.19 0.37 0.19 0.25 0.42 0.27 0.33 0.37 0.21 0.23 0.02 0.008 0.789 0.767 0.446
t10,c12-C18:2 ND 0.34 0.04 ND 0.39 0.05 ND 0.22 0.04 ND 0.41 0.10 0.03 0.001 0.181 0.155 0.012
c9,c12,c15-C18:3 0.64 0.57 0.64 0.65 0.55 0.63 0.34 0.34 0.35 0.37 0.32 0.33 0.03 0.089 0.395 0.932 0.686
c9-C18:1/ C18:0 1.45 0.82 1.14 1.95 0.87 1.41 2.33 1.13 1.51 1.88 0.93 1.30 0.10 0.000 0.356 0.372 0.856
c9,t11-C18:2/t11-C18:1 0.25 0.15 0.23 0.39 0.18 0.27 0.53 0.26 0.32 0.45 0.21 0.27 0.02 0.002 0.238 0.577 0.717
Diet L-SB L-CS H-SB H-CS Effects
infusion Basal CLA SM Basal CLA SM Basal CLA SM Basal CLA SM SEM I IxC IxF IxFxC DMI, g/d 2,996 2,380 2,885 2,500 2,593 2,646 2,741 2,530 1,801 1,961 1,785 1,919 115 0.852 0.652 0.615 0.865 Milk yield, g/d 2,724 3,186 3,167 3,450 3,285 2,826 2,543 2,662 2,663 1,680 1,032 993 195 0.905 0.824 0.329 0.932 Fat, g/kg 38.5 36.1 35.6 38.4 38.2 37.3 31.9 35.0 31.6 34.4 39.3 34.0 0.9 0.911 0.888 0.886 0.780 Protein, g/kg 35.5 36.1 37.9 33.1 32.1 32.3 35.7 35.6 35.1 32.0 32.7 32.5 0.5 0.938 0.756 0.877 0.596 Lactose, g/kg 47.1 47.7 50.1 46.0 46.7 48.0 41.4 41.7 39.3 45.3 47.0 47.2 0.8 0.507 0.465 0.738 0.505
Fat, g/d 101 114 106 144 120 101 82 94 84 39 40 35 7.8 0.692 0.790 0.592 0.703
Protein, g/d 95 115 112 124 92 61 91 95 94 37 33 33 7.4 0.907 0.961 0.583 0.739
Schmidely and Andrade
1276
Arq. Bras. Med. Vet. Zootec., v.63, n.5, p.1272-1276, 2011RESUMO
O efeito do t10,c12-C18:2 na produção de leite e no perfil em ácidos graxos (AG) da gordura do leite foi estudado em oito cabras que receberam t10,c12-C18:2 por infusão duodenal (ácido linoléico conjugado - CLA, 2g/10 h) durante três dias, seguido por dois dias de infusão de leite desnatado (SM). As cabras foram distribuídas em quatro grupos em um delineamento fatorial 2x2: duas porcentagens de concentrado da dieta – L, baixa 45% ou H, alta 65% – e dois tipos de gordura adicionada para modificar a relação c9,c12-C18:2/c9-C18:1 da dieta – grãos de soja ou de canola. Amostras de leite foram coletadas antes (basal) e durante a infusão de CLA e de leite desnatado. Ingestão de matéria seca, teor e produção de gordura, de proteína e de lactose foram semelhantes antes do início e durante a infusão de CLA. A proporção de AG saturados com 4 a 8C ou 10 a 15C não foi alterada durante a infusão de CLA. Independentemente da alimentação das cabras, a infusão de CLA aumentou as proporções de C18:0, t10- e t11-C18:1 e diminuiu as de c9-C18:1 e c9,t11-C18:2 na gordura do leite. O CLA diminuiu as relações c9-C18:1/C18:0 e c9,t11-C18:2/t11-C18:1 no leite dos quatro grupos experimentais. Os resultados mostraram que a lipogênese mamária em cabras leiteiras não foi alterada por 2g/d de t10,c12-C18:2, contudo, a desaturação de AG de cadeia longa parece ser diminuída da mesma maneira que em vacas. Produção de leite e perfil dos AG do leite não foram influenciados pela relação c9,c12-C18:2/c9-C18:1 da fração lipídica da dieta das cabras.
Palavras-chave: cabra, ácidos graxos do leite, t10,c12-C18:2
REFERENCES
ANDRADE, P.V.D.; SCHMIDELY, P. Effect of duodenal infusion of trans10,cis12-CLA on milk performance and milk fatty acid profile in dairy goats fed high or low concentrate diet in combination with rolled canola seed. Reprod. Nutr. Dev., v.46, p 31-48, 2006.
BAUMGARD, L.H.; CORL, B.A.; DWYER, D.A. et al. Identification of the conjugated linoleic acid isomer that inhibits milk fat synthesis. Am. J. Physiol., v.278, p.R179-R184, 2000.
BAUMGARD, L.H; MATITASHVILLI, E.; CORL, B.A. et al. Trans-10,cis-12 conjugated linoleic acid decreases lipogenic rates and expression of genes involved in milk lipid synthesis in dairy cows. J. Dairy Sci., v.85, p.2155-2163, 2002.
CALDERON, I.; DE PETERS, E.J.; SMITH, N.E. et al. Composition of goat’s milk: changes within milking and effects of a high concentrate diets. J. Dairy Sci., v.67, p.1905-1911, 1984.
CHILLIARD, Y.; FERLAY, A. Dietary lipid and forage interactions on cow and goat milk fatty acid composition and sensory properties. Reprod. Nutr. Dev., v.44, p.467-492, 2004.
de VETH, M.J.; GRINARII, J.M.; PFEIFFER, A.M. et al. Effect of CLA on milk fat synthesis in dairy cows: comparison of inhibition by methyl esters and free fatty acids, and relationships among studies. Lipids,
v.39, p.365-372, 2004.
LOCK, A.L.; ROVAI, M.; GIPSON, T.A. et al. A conjugated linoleic acid supplement containing trans-10, cis-12 conjugated linoleic acid reduces milk fat synthesis in lactating goats. J. Dairy Sci., v.91, p.3291-3299, 2008.
LOOR J.J.; FERLAY, A.; DOREAU, M. et al. Intestinal supply of trans10,cis12-C18:2 lowers milk fat output in Holstein cows fed a high- or low-fiber diet with two levels of linseed oil. J. Dairy Sci., v.85, suppl.1, p.297, 2002.
LOOR J.J.; HERBEIN, J.H. Reduced fatty acid synthesis and desaturation due to exogenous trans10,c12-CLA in cows fed oleic or linoleic oil. J. Dairy Sci., v.86, p.1354-1369, 2003.
PIPEROVA, L.S.; SAMPUGNA, J.; TETER, B.B. et al. Duodenal and milk trans octadecenoic acid and conjugated linoleic acid (CLA) isomers indicate that postabsorptive synthesis is the predominant source of cis-9-containing CLA in lactating dairy cows. J. Nutr.,
v.132, p.1235-1241, 2002.
RUMINANT nutrition. recommended allowance and feed table. R. Jarrige, ed. Inst. National. Rec. Agron., 1989.
STATISTICAL analysis system: user's guide SAS.release.8.ed. Cary, NC: SAS Institute, 2000.