Chiara Barros Secco1, Raquel Gonçalves2, Domingos Guilherme Pelegrino Cerri3,
Érica Caroline Vasques4, Fernando Augusto Franco Batista5
(received: September 17, 2010; accepted: March 30, 2012)
ABSTRACT: This work aimed to analyze the pattern of variation in wave lengths in presence of wood holes and to develop a model capable of describing the process. To attain that end, wood pieces were used from species pequiá (Aspidosperma desmanthum), on which circular and linear artificial holes were made and gradually enlarged. Ultrasonic tests were performed using USLab equipment and 45 kHz transducers. Measurements were taken first on the intact piece and then after each stage of artificial hole enlargement. Results demonstrated that propagation velocities of ultrasonic waves are affected by presence of holes and also that reduction in velocity is caused by changes in wave path, since waves tend to deviate from empty space and travel through matter. The circular hole type had a slightly stronger influence on velocity reduction than the linear hole type. Variation in velocity as a function of increasing percentage of hollow space relative to the intact piece can be represented by a linear model.
Key words: Pequiá (Aspidosperma desmanthum), wave length, acoustic method, forest sector.
COMPORTAMENTO DE ONDAS DE ULTRASSOM NA PRESENÇA DE OCOS NA MADEIRA
RESUMO: Neste trabalho, objetivou-se estudar o comportamento da variação do percurso da onda em presença de oco na madeira bem como elaborar um modelo que o descrevesse. Para atingir esse objetivo, foram utilizadas peças de madeira da espécie pequiá (Aspidosperma desmanthum) nos quais foram confeccionados orifícios artificiais (circular e linear). Esses orifícios foram sendo aumentados gradualmente. Os ensaios de ultrassom foram realizados utilizando equipamento da marca USLab e transdutores de 45 kHz. As medições foram realizadas na peça íntegra e após cada fase de confecção do oco artificial. Os resultados permitiram confirmar que as velocidades de propagação de ondas de ultrassom são afetadas pela presença de ocos e que a redução da velocidade é provocada pela mudança de percurso da onda, que tende a se desviar do vazio e percorrer o material. O oco do tipo circular teve influência levemente superior na redução da velocidade do que o oco do tipo linear. A variação da velocidade com o aumento da porcentagem de oco em relação à peça integra pode ser representada por um modelo linear.
Palavras-chave: Pequiá (Aspidosperma desmanthum), percurso da onda, método acústico, setor florestal.
1Architect, Professor MSc in Agricultural Engineering – Universidade Estadual de Campinas/UNICAMP – Faculdade de Engenharia agrícola/FEAGRI – Laboratório de Ensaios Não Destrutivos – 13083-875 – Campinas, SP, Brasil – chiara.barros@feagri.unicamp.br
2Civil Engineer, Professor PhD in Civil Engineering – Universidade Estadual de Campinas/UNICAMP – Faculdade de Engenharia agrícola/FEAGRI – Laboratório de Ensaios Não Destrutivos – 13083-875 – Campinas, SP, Brasil – raquel@agr.unicamp.br
3Agronomist, Postdoctoral Researcher – Universidade Estadual de Campinas/UNICAMP – Faculdade de Engenharia agrícola/FEAGRI – Laboratório de Ensaios Não Destrutivos – 13083-875 – Campinas, SP, Brasil – dgpcerri@terra.com.br
4Bachelor’s Degree Candidate in Agricultural Engineering – Universidade Estadual de Campinas/UNICAMP – Faculdade de Engenharia agrícola/FEAGRI – Laboratório de Ensaios Não Destrutivos – 13083-875 – Campinas, SP, Brasil – erica.vasques@feagri.unicamp.br
5Architect, MSc in Agricultural Engineering – Universidade Estadual de Campinas/UNICAMP – Faculdade de Engenharia agrícola/FEAGRI – Laboratório de Ensaios Não Destrutivos – 13083-875 – Campinas, SP, Brasil – f.batista@msn.com
1 INTRODUCTION
One major problem entrepreneurs are faced with in sustainable forest management is the losses that come with tree selection, whether related to low quality or to low yield of wood. Where trees are rated as having low commercial value for one of the above reasons, they should still be preserved. Preserving unwanted trees would prevent waste, as trees in such condition are often abandoned in forests or in log yards for having no commercial value. Furthermore, if preserved, unwanted trees are important sources of food and shelter for animals, becoming part
of the group of remnant trees. One of the reasons for low yield is presence of holes in wood. Some species with commercial or strategic value are naturally hollowed, yet holes can also be provoked, in any species, by action of fungi and bacteria or else by natural causes. Where holes are large, use of the relevant trunk by the lumber industry may become economically unfeasible.
In Brazil, three methods are currently in use to
This process is very invasive and may cause permanent damage to trees. Another technique is to hit the trunk with a hammer and assess the sound produced. This type of assessment is very subjective and conditional on operator’s experience, being thus susceptible to major inaccuracies. A third technique is to evaluate any symptoms indicative of hole presence, including traces of termite presence or dark secretions along the trunk. Apolinário and Martius (2004) analyzed 110 trees from the experimental station of
tropical silviculture (INPA), situated around 90 km away
from Manaus, and found that 37.7% had large cavities along the center portion of the trunk. Out of the total of 110 trees, 21% were internally infested with termites, accounting for 57.5% of hollowed trees found.
Acoustic methods have been used successfully throughout the world in forest assessments and are even replacing or complementing visual assessments, given that in many cases tree pathologies are not visible to the naked eye, as is the case with the large majority of hollow spaces in trees. Wang et al. (2004) argue that different arrangements in measurements of wave propagation enable detection of different minimum sizes of internal defects. These authors concluded that measuring wave propagation time along the stem in the radial direction allows accurate determination of the internal condition of a tree. According to these authors, the velocity of wave propagation in defective solids will decrease because waves surround the defect, increasing the length traveled
and, consequently, the propagation time. Deflorio, Fink
and Schwarze (2007) used wave propagation to detect deterioration by six types of fungus in wood from Douglas Fir (Pseudotsuga manziessi), Beech (Fagus grandifolia), Oak (Quercus robur) and Sycamore (Populus tremuloides) following artificial inoculation, and observed data for
2, 16 and 27 months. Besides variation in velocity, the authors also evaluated weight loss and density reduction in order to compare results. They concluded that wave propagation was capable of detecting deterioration by fungi from the start. Weight loss, density reduction and
velocity reduction were detected for all fungus-host combinations. Najafi, Shalbafan and Ebrahimi (2009)
performed tests using ultrasonic waves in order to detect hollow spaces in Beech (Fagus orientalis). To obtain improved contrasts, disks were removed from different sections of the trunk of sound trees, then holes (representing internal decay) were manually created and
progressively enlarged. These artificial holes included two
types, circular and linear. Velocities of ultrasonic waves
were measured on intact disks and on the disks with linear and circular holes, in different positions. Results revealed
that ultrasonic velocities significantly decreased with
increased hole size. The relative position of holes did not
influence the magnitude nor the tendency to reduction in
velocity. A comparison between linear and circular holes showed that linear holes had less effect on the decrease
in ultrasound velocities. Najafi, Shalbafan and Ebrahimi (2009) concluded that the propagation velocity decreases
because waves surround holes, similarly to the conclusion drawn by Wang et al. (2007).
To evaluate ultrasonic wave behavior in presence of
hollow spaces, Lin et al. (2008) artificially made circular
holes, centralized and decentralized, in wood disks from species Japanese cedar (Cryptomeria japonica) measuring 300 mm and 350 mm in diameter and 100 mm in thickness. For the study, the authors used Sylvatest equipment with 22 kHz frequency transducers. They established correlations between the propagation velocity of ultrasonic waves and the relative residual diameter, using initial diameter and hole diameter as factors.
In this context, this work was developed to evaluate
variation in the propagation velocity of ultrasonic waves in presence of holes of known size, looking to determine a representative model of this type of variation for circular and linear holes in wood from pequiá (Aspidosperma desmanthum).
2 MATERIAL AND METHODS 2.1 Material and equipment
To perform tests, two massive wood pieces from pequiá (Aspidosperma desmanthum) were used, 390 mm x 390 mm x 50 mm in nominal size. This particular species
was selected due to its susceptibility to formation of holes and due to its great commercial interest. The wood pieces
were donated by TORA BRASIL.
The ultrasound equipment used was USLab,
developed by staff at the nondestructive testing laboratory
(LabEND) of the Agricultural Engineering College (FEAGRI) of Campinas state university (UNICAMP), in partnership with AGRICEF Soluções Tecnológicas, a technology-based company. The tests were performed using flat-face transducers and 45 kHz frequencies.
In order to make artificial holes, a CNC (Computer Numeric Control) machine was used, from a SENAI unit located in Itatiba. The reason for selecting this type of
determination of a variation model of wave propagation as a function of increased hollow size.
2.2 Measurement methodology
Two types of artificial hole were created in each
wood piece, namely linear and circular, which were gradually enlarged (Figure 1). Figure 1 also depicts the measurement grid with a 30 mm x 30 mm line pattern drawn in perpendicular directions and labeled X and
Y. In each grid band (X1, X2, ... etc. , Y1, Y2, ... etc.),
measurements were taken of the times of ultrasonic wave
propagation (t). Initially, the intact pieces (no holes) were
subjected to ultrasonic measurement to determine times of
wave propagation (t). The piece with a circular hole was termed P1 and the piece with a linear hole was termed P2. To assess variations in travel time as a function of hole size, the pieces were progressively enlarged at the following rates: 5%, 10%, 15%, 20%, 25%, 35% and 55% in the case of the circular hole and 10%, 20%, 30%, 40%, 50%, 60%,
70% and 80% in the case of the linear hole. After each
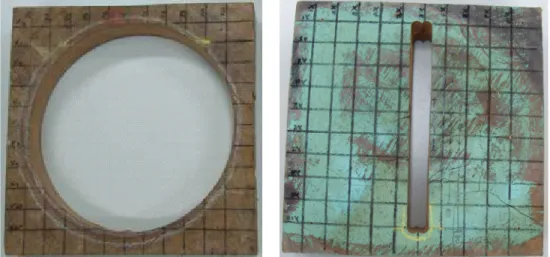
incision, the pieces were again subjected to measurements using the ultrasonic wave grid. Figure 2 illustrates the hollowed pieces up to the maximum percentages.
Results of wave propagation velocity for each hole size were statistically analyzed using software Statgraphics Centurion.
Figure 1 – Illustration of artificially cut circular and linear holes, increasingly enlarged in percentage relative to the sound piece. Figura 1 – Esquema da produção de ocos artificiais - circular e linear - com aumento percentual da dimensão em relação à parte sã.
Figure 2 – Artificially hollowed pieces of pequiá up to maximum percentages (55% for the circular hole and 80% for the linear hole). Figura 2 – Peças de pequiá com oco artificial circular máximo (55%) e com oco artificial linear máximo (80%).
5% 10% 20% 35%
15% 25%
55%
Y1 Y3 Y5 Y7 Y9 Y11
Y2 Y4 Y6 Y8 Y10 Y12
Y12
Y10 Y11
Y9
Y7
Y5 Y8
Y6
Y4 Y3
Y1 Y2
X6
10% 20%
40%
60% 30%
50%
70% 80% X12
X10 X11
X9
X7
X5 X8
X6
X4 X3
3 RESULTS AND DISCUSSION
Table 1 provides mean results and variability in velocity of wave propagation as obtained in both measurement directions (X and Y), for the two intact pieces (P1 – circular hole and P2 – linear hole). Results are given as velocity because the two pieces differ slightly in size, preventing direct comparison of wave propagation times. For each point of the measurement grid, velocity was calculated as the ratio of length traveled to propagation time.
Figures 3, 4, 5 and 6 provide graphs illustrating the behavior of wave propagation times at different points of the grid, for different hole sizes, circular and linear respectively.
Table 1 – Mean results for propagation velocities of ultrasonic waves in yet intact pieces of pequiá.
Tabela 1 – Resultados de médias das velocidades de propagação de ondas de ultrassom nas peças de Pequiá ainda integras.
Grid direction Mean velocity (m.s-1) CV (%)
Piece P1 (on which a circular hole was cut)
X 1841 3.7
Y 1803 6.3
Mean 1822 5.1
Piece P2 (on which a linear hole was cut)
X 1708 5.18
Y 1760 6.07
Mean 1734 5.7
Overall mean 1778 3.5
Figure 3 – Behavior of wave propagation time as a function of position in the measurement grid for the piece with a circular hole, X direction.
Figura 3 – Comportamento do tempo de propagação da onda em função da posição na malha de medição na direção X para a peça com oco circular.
Figure 4 – Behavior of wave propagation time as a function of position in the measurement grid for the piece with a circular hole, Y direction.
Figura 4 – Comportamento do tempo de propagação da onda em função da posição na malha de medição na direção Y para a peça com oco circular.
The mean velocity in piece P1 was 5% higher than in piece P2. After using all X and Y measurements on the grid of each piece, it was demonstrated that the means were statistically similar. This result suggests that, independently, the pieces show little variation in velocity, which indicates absence of defects or less resistant areas affected for instance by small cracks etc. Despite being
both from the same species, the coefficient of variation for
velocities in pieces P1 and P2 was low (3.5%), considering
the inherent variability of wood. According to NBR 7190 (ASSOCIAÇÃO BRASILEIRA DE NORMAS TÉCNICAS - ABNT, 1997), coefficients of variation
for wood properties in one lot of the same species are
considered normal if up to 18%. For propagation velocity
of ultrasonic waves in a single species, Bucur (2006)
reported coefficients of variation ranging from 3.69% to 7.51%. Lin et al. (2008) obtained velocities in the order
of 1600 m.s-1 while studying yet intact pieces from species
Cryptomeria japonica.
In both pieces, measurements were taken in hole-affected positions only. In the case of the linear hole, X
direction, there is indication of one measuring point only (X6) as the others are inapplicable. The reason for adopting propagation time rather than propagation velocity was that, if velocity had been used, the length traveled by the wave would have been automatically established, yet the aim in this study was more exactly to study the length traveled by the wave in presence of empty space.
0.0 100.0 200.0 300.0 400.0 500.0 600.0
0 10 20 30 40 50 60
W
ave propagation time (microseconds)
Percentage of hollowness in relation to intact piece (%) Y6 Y5 Y7 Y4 Y8 0.0
100.0 200.0 300.0 400.0 500.0 600.0
0 10 20 30 40 50 60
W
ave propagation time (microseconds)
In both types of hole, greater variations in
propagation time were found in positions closer to center portion of the hole, against minor variations in positions away from the center. The graphs also reveal two levels of time variation. Regarding the circular hole, one level of time variation is noted up until 35% of hollowness, followed by another with greater variations from that point onward. For the linear hole, time variations are greater for hollowness values above 60%. These greater variations in more central positions seem to corroborate conclusions
drawn by Najafi, Shalbafan and Ebrahimi (2009) and Wang
et al. (2004), in that a wave diverts from empty space and, in doing so, the length traveled will increase and so will time consequently.
Figures 7 and 8 provide graphs of relative variation
in the length traveled (DLR) obtained by Equation 1, as a function of the measurement position, considering the highest proportion of hollowness being analyzed (55% for
the circular hole and 80% for the linear hole).
DLR = [(LReference – Llength)/ (LReference)]*100 (1)
Where: LReferene is the length traveled by the wave on the intact piece and Llength is the length obtained using the
velocity on the intact piece and the time measured on the hollowed piece.
Figure 5 – Behavior of wave propagation time as a function of position in the measurement grid for the piece with a linear hole, X direction.
Figura 5 – Comportamento do tempo de propagação da onda em função da posição na malha de medição na direção X para a peça com oco linear.
Figure 6 – Behavior of wave propagation time as a function of position in the measurement grid for the piece with a linear hole, Y direction.
Figura 6 – Comportamento do tempo de propagação da onda em função da posição na malha de medição na direção Y para a peça com oco linear.
Figure 7 – Relative variation in length traveled as a function of measurement position. Circular hole.
Figura 7 – Variação relativa do comprimento de percurso em função da posição de medição. Oco circular.
Figure 8 – Relative variation in length traveled as a function of measurement position. Linear hole.
Figura 8 – Variação relativa do comprimento de percurso em função da posição de medição. Oco linear.
0.0 100.0 200.0 300.0 400.0 500.0 600.0
0 20 40 60 80 100
W
ave propagation time (microseconds)
Percentage of hollowness in relation to intact piece (%) X6
Y4 Y5 Y6 Y7 Y1
0.0 100.0 200.0 300.0 400.0 500.0 600.0
0 20 30
W
ave propagation time (microseconds)
Percentage of hollowness in relation to intact piece (%)
10 40 50 60 70 80 90
0 20 40 60 80 100 120 140 160
0 1 2 3 4 5 6 7 8 9 10 11
Relative variation in length
traveled (%)
Measurement position (grid)
80% Y Direction
0 20 40 60 80 100 120 140 160
0 1 2 3 4 5 6 7 8 9 10 11 12
Relative variation in length
traveled (%)
Measurement position (grid)
55% X Direction
These graphs reveal longer lengths in reading position 6, the reason being that in this case propagation is closer to the center portion of the hole, in both hole types. The more removed propagation is from the center portion of the hole, the smaller the increase in the length traveled, as the path traveled in order to deviate from the hole is shorter. Another way to explain variation in the propagation velocity of ultrasonic waves in wood as a function of hollowness is to consider that velocity decreases because waves pass through two different mediums, wood matter (intact piece) and air (hollow space). Considering
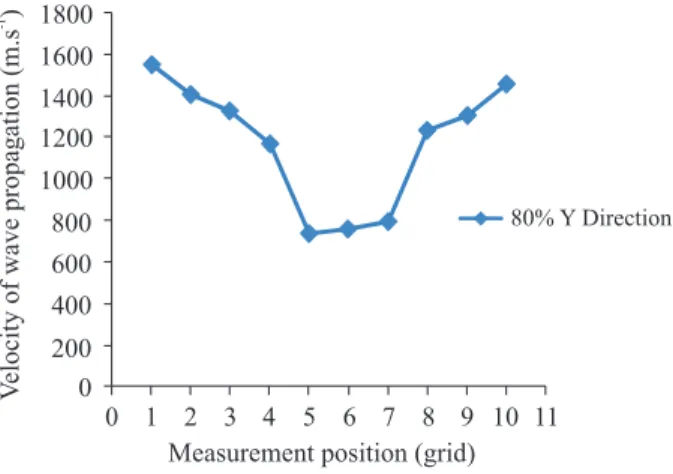
that in intact wood velocity is about 1800 m.s-1 whereas in air velocity is about 300 m.s-1, a reduction in this velocity could be a function of the proportion between the propagation mediums. Yet, in the case of the linear hole, with propagation in the Y direction (perpendicular to the hole), the proportions of wood and air would be the same in any measurement point passing through the hole. Consequently, one would expect velocities to be virtually the same, regardless of the measurement position in the Y
direction, although not the case (Figure 9).
around 700 m.s-1 in the center position, which confirms the hypothesis that a wave seeks matter to propagate as opposed to empty space, diverting its path. This variation
in velocities was very close to values found by Lin et al. (2008), whose results ranged from 1600 m.s-1 to 600 m.s-1.
In order to evaluate the materiality of a correlation
model between variation in propagation velocity and increased proportion of hollowness, in the case of species pequiá, mean velocities (X and Y) were used as obtained in measurement position 6, the reason being that position 6 was the centermost portion of the hole and consequently the most suitable, as far as rates of hollowness to intact
piece are concerned. In the remaining positions, such
correlations could be obtained by considering the linear size of the hole through which the wave propagated rather than its proportion relative to the intact piece. Figure 10 provides a graph to illustrate the behavior of velocity variation with increased percentage of hollowness and the regression equation for circular and linear hole.
Figure 9 – Variation in propagation velocity as a function of measurement position Y. Linear hole at a proportion of 80% relative to the piece.
Figura 9 – Variação da velocidade de propagação em função da posição de medição Y. Oco linear com proporção de 80% em relação à peça.
Figure 10 – Variation of velocity as a function of rate of hollowness to intact piece (circular and linear holes), considering measurement position 6 (centermost portion).
Figura 10 – Variação entre velocidade e porcentagem de oco em relação à parte sã das peças com oco (circular e linear) considerando a posição de medição 6 (mais centralizada em relação ao oco).
Additionally, if propagation did occur through hollowness, the obtained mean velocity, considering the length traveled in wood (355 mm) and the length traveled in air (30 mm), would be approximately 1600 m.s-1, yet this
value was only observed in edge positions (1 and 10). In
the remaining cases, velocity was always lower, reaching
Tables 2 and 3 provide results of the analysis of variance of the regression for circular and linear holes
respectively. With the P-values found in the ANOVA
tables being less than 0.05, for both the circular hole (Table 2) and the linear hole (Table 3), the correlation between propagation velocity and variation in hollowness
percentage is indeed statistically significant at the 95% confidence level.
0 200 400 600 800 1000 1200 1400 1600
0 1 2 3 4 5 6 7 8 9 10 11
V
elocity of wave propagation (m.s
)
-1
Measurement position (grid)
80% Y Direction 1800
Velocity (circular hole) = -16,23 (%hollowness) + 1760 R = -0.96
600 800 1000 1200 1400 1600 1800 2000 2200
0 10 20 30 40 50 60 70 80 90
V
elocity of wave propagation (m.s
)
-1
Percentage of hollowness in relation to sound piece (%) Velocity (linear hole) = -13,55 (%hollowness) + 1975
In the case of the circular hole, the model explains 92.2% of variability in velocity and there is a strong
correlation between the variables velocity and hollowness
percentage (R = 0.96). As regards the linear hole, the model explains 80.7% of variability in velocity and
the correlation, despite weaker, can also be considered
significant (R = 0.89). The slope coefficients of the
regression models indicate that the velocity with which waves propagate is more influenced by the circular hole than by the linear hole. For every 10% increase in hollowness, the variation in velocity is about 160 m.s-1 for the circular hole and about 130 m.s-1 for the linear hole.
A similar result was obtained by Najafi, Shalbafan and Ebrahimi (2009), despite less, as for every 10% increase
in hollowness these authors found a velocity variation of about 110 m.s-1 for the circular hole and 70m.s-1 for the linear hole.
Another method to evaluate which type of hole has
greater influence on velocity is to use the relative variation in velocity (RVC) as adopted by Najafi, Shalbafan and Ebrahimi (2009) which is represented by Equation 2.
RVC = [(Vreference – Vmeasured)/(Vreference)] * 100 (2)
Where Vreference is the velocity through the intact piece and Vmeasured is the measured velocity in the hollowed piece.
Figure 11 provides a graph to illustrate the behavior of RVC variation for both types of hole being analyzed.
Results were similar to those found by Najafi, Shalbafan and Ebrahimi (2009), who found greater variations for the
circular hole and a tendency toward increasing differences the greater the percentage of hollowness.
Table 2 – Analysis of Variance (ANOVA table) of the regression between velocity and hollowness percentage, for the piece with a circular hole.
Tabela 2 – Análise de Variância (Tabela de ANOVA) da regressão entre velocidade e porcentagem de oco para a peça com oco circular.
Source Sum of squares Df
Mean
squares F-Ratio P-Value
Model 585379. 1 585379.
71.04 0.0002 Residual 49437.8 6 8239.63
Total (Corr.) 634817. 7
Table 3 – Analysis of Variance (ANOVA table) of the regression between velocity and hollowness percentage, for the piece with a linear hole.
Tabela 3 – Análise de Variância (Tabela de ANOVA) da regressão entre velocidade e porcentagem de oco para a peça com oco linear.
Source Sum of
squares Df
Mean
squares F-Ratio P-Value Model 1.10107E6 1 1.10107E-6
Residual 263069 7 37581.3 29.30 0.0010 Total (Corr.) 1.36414E6 8
Figure 11 – Variation in relative velocity (RVC) for circular hole and linear hole.
Figura 11 – Variação da velocidade relativa (RVC) para peças com oco circular e linear.
4 CONCLUSIONS
The propagation velocities of ultrasonic waves are affected by presence of holes, whether linear or circular, and the reduction in velocity is caused by a diversion in the wave path, as waves tend to divert from empty space and travel through matter. The circular hole type had greater
influence on reduction in velocity than the linear hole type.
Variation in velocity as a function of increased percentage of hollowness can be represented by a linear model. The model will be used by the team on a later occasion in order to construct imagery using ultrasonic tomography.
5 ACKNOWLEDGEMENTS
The authors wish to thank CNPq and FAPESP for providing financial support, TORA BRASIL for providing wood samples, SENAI-Itatiba’s technician Antônio Paulo
Variation in velocity (circular hole) = 1,05x - 7.9 R = 0.97
Variation in velocity (linear hole) = 0,84x - 8.3 R² = 0.96
0 10 20 30 40 50 60 70 80
0 10 20 30 40 50 60 70 80 90
V
ariation in relative velocity (%)
Percentage of hollowness in relation to intact piece (%)
Circular hole
for helping with wood cutting, and SENAI-Itatiba for providing the CNC machine.
6 REFERENCES
APOLINÁRIO, F. E.; MARTIUS, C. Ecological role of térmites (Insecta, Isoptera) in tree truncks in central Amazonian rain forests. Forest Ecology and Management, Amsterdam, v. 194, p. 23-28, 2004.
ASSOCIAÇÃO BRASILEIRA DE NORMAS TÉCNICAS. NBR 7190: projeto de estruturas de madeira. Rio de Janeiro, 1997. 107 p.
BUCUR, V. Acoustics of wood. Berlin: Springer-Verlag, 2006. 303 p.
DEFLORIO, G.; FINK, S.; SCHWARZE, F. W. M. R. Detection of incipient decay in tree stems with sonic tomography after wounding and fungal inoculation. Wood
Science and Technology, New York, v. 42, p. 117-132, 2007.
LIN, C. J. et al. Application of an ultrasonic tomographic technique for detecting defects in standing trees. International Biodeterioration & Biodegradation, Birmingham, v. 62, p. 432-441, 2008.
NAJAFI, S. K.; SHALBAFAN, A.; EBRAHIMI, G. Internal decay assessment in standing beech trees using ultrasonic velocity measurement. European Journal of Forest Research, Oxford, v. 48, n. 1, p. 1-6, 2009.