Rev Saúde Pública 2005;39(1) www.fsp.usp.br/rsp
Impact of influenza vaccination on mortality
by respiratory diseases among Brazilian
elderly persons
Priscila M aria Stolses Bergamo Franciscoa, M aria Rita de Camargo Donalisioa and M aria
do Rosário Dias de Oliveira Lattorreb
aDepartamento de Medicina Preventiva e Social. Faculdade de Ciências Médicas. Universidade
Estadual de Campinas. Campinas, SP, Brasil. bDepartamento de Epidemiologia. Faculdade de Saúde
Pública. Universidade de São Paulo. São Paulo, SP, Brasil
Correspondence to:
Priscila Maria Stolses Bergamo Francisco Caixa Postal 6111
13083-970 Campinas, SP, Brasil E-mail: [email protected] E-mail:[email protected]
Based on the Master’s dissertation presented at the Faculdade de Ciências Médicas da Universidade Estadual de Campinas in 2002.
Received on 3/2/2004. Approved on 8/6/2004.
Keywords
Aged. Aging health. Respiratory tract diseases, mortality. Influenza vaccine. Mortality, trends.
Abstract
Objective
Respiratory diseases, especially infectious ones, are becoming increasingly representative in the morbidity and mortality patterns of elderly persons. The aim of the present study was to analyze trends in the mortality by respiratory diseases and to observe the impact of influenza vaccination on mortality rates.
Methods
The study was carried out between 1980 and 2000. Subjects were elderly persons living in the State of São Paulo, and mortality data were obtained from the Mortality Information System of the Brazilian Ministry of Health. This is an ecological time-series study. We analyzed the time trends of standardized mortality rates by infectious diseases, according to age group (60-64, 65-69, 70-74, 75-79, and 80+ years) and sex, using polynomial regression. We estimated confidence intervals for the mean expected response in the years following the intervention.
Results
Rates increased for both sexes among the elderly population. After the intervention, we observed a declining trend with respect to mortality indicators. For older males, the mean rate in the 1980-1998 period was 5.08 deaths per thousand men, with a linear, non-constant increase of 0.13 per year; in 2000, the rate observed was 4.72 deaths per thousand men. The mean annual rate among women over 60 years was 3.18 deaths per thousand women, with a non-constant increase of 0.08 per year; in 2000, the rate observed was 2.99 deaths per thousand women. There was also a significant reduction in mortality rates in all age groups.
Conclusions
Data indicate the importance of respiratory diseases among the elderly population and suggest that specific protection against influenza has a positive effect on the prevention of mortality due to these diseases.
INTRODUCTION
Respiratory tract diseases, infectious ones espe-cially, are an important cause of morbidity and
mor-tality among the elderly population worldwide.4,7,10
In Brazil, data from the Sistema de Informações
sobre Mortalidade (Mortality Information System) indicates the growing importance of hospital
admis-sions and deaths due to respiratory diseases among the elderly, even considering the ageing of the
popu-lation.6 In 1995, in São Paulo State, the proportional
rate of mortality due to pneumonia among persons older than 70 years was 9%, with a specific mortality of 594.03 per 100,000 population. In the 60-70 years age group, 1,676 deaths were registered, with a pro-portional mortality of 4.75% and a specific rate of
Rev Saúde Pública 2005;39(1) www.fsp.usp.br/rsp Influenza vaccination and mortality among the elderly
Francisco PMSB et al
We calculated the annual ratio between standard-ized male/female rates and evaluated changes in this relationship throughout the years using simple lin-ear regression models. We considered p-values above 0.05 as indicative of an absence of change in this
ratio within the studied period.11
Initially, we built scatter plots opposing mortality rates and calendar years in order to better visualize the function that might better express the relation-ship between these variables. Based on the functional relationship observed, we estimated polynomial re-gression models, which, in addition to being
statisti-cally powerful, are easy to elaborate and interpret.12,15
During the modeling process, we considered the rates of mortality due to selected diagnoses as the dependent variable (Y) and calendar years as the in-dependent variable (X). The transformation of
vari-able year into variable centralized year (year minus
the midpoint of the time series) was required, since, in polynomial regression models, the terms in the
equation are often self-correlated.15
As a measure of the model’s precision, we used the
coefficient of determination (r2). We verified
adher-ence to normal distribution using the Kolmogorov-Smirnov test; all series were normally distributed. Residual analysis conf irmed the assumed
homocedasticity of the model.11,15
We tested the simple linear regression model (Υ=β0+β1Χ) and then second degree (Υ=β0+β1Χ+β2Χ2), third degree (Υ=β0+β1Χ+β2Χ2+β3Χ3), and exponential (Υ=eβ0+β1Χ) models. In light of the statistical similarity of two of the models, we chose that of lower degree. We considered as significant trends whose estimated
mod-els obtained p-values below 0.05.11
In these models, β0is the mean yearly rate, b1is the
linear effect coefficient (speed), and b2 is the
quad-ratic effect coefficient (acceleration). We considered 1989 as the midpoint of the time series.
For some of the age groups, variations in the series were smoothed using a moving average centered on three terms. In this process, the smoothed rate of year i
(Yai) corresponds to the arithmetic mean of the
coeffi-cients of the previous year (i-1), of the year itself (i) and of the following year (i+1):
*Information obtained online from URL: <http://www.datasus.gov.br/cgi/ibge/popmao.htm>
3
1
1 +
- + +
= i i i
ai
Y Y Y Y Influenza epidemics happen more frequently
dur-ing winter. Such epidemics account for a mean 20,000
yearly deaths in the United States.21 Influenza
out-breaks are associated with increases in hospital ad-missions and deaths, mostly due to complications of
the disease and to chronic subjacent ilnesses.2,3
Vaccination has been the major method for prevent-ing influenza and its more severe complications. When vaccine composition coincides with circulating viral strains, vaccine efficacy can be as high as 70-90% in healthy adults. Among persons older than 60 years,
however, efficacy falls to the 30-40% range.2,8,10
Even considering the greater physiological and im-munological susceptibility of elderly persons to in-fection, influenza vaccination has a positive effect on the prevention of severe influenza, pneumonia, and mortality in this risk group.4,8-10,17
The aim of the present study is to analyze trends in mortality by respiratory diseases among elderly per-sons and to observe the impact of influenza vaccina-tion on mortality indicators.
METHODS
This is an ecological time-series study, based on the
mortality records of the Sistema de Informações sobre
Mortalidade do SUS (Mortality Information System of the Brazilian Unified Healthcare System - SIM/SUS) for São Paulo State, between the years 1980 and 2000. Es-timates of the elderly population living in the State were
obtained from the Instituto Brasileiro de Geografia e
Estatística (Brazilian Institute for Geography and Sta-tistics - IBGE).* Elderly persons were divided into five age groups: 60 to 64 years, 65 to 69 years, 70 to 74 years, 75 to 79 years, and 80 years and older.
We analyzed diagnoses referring to pneumonias and influenza (until 1997, ICD-9 classifications 480-483 and 485-487 were used), bronchitis (490 and 491) and chronic airway obstruction (496). For 1998, ICD-10 classifications were used (JICD-10 to J15, J18, J22, J40 to J42, and J44). These classifications have been used by a number of authors attempting to measure the
impact of influenza on the community.7,17,22 We chose
to include chronic obstructive pulmonary disease (COPD) in light of its intimate relationship with
pul-monary infection among the elderly.22
We calculated standardized mortality rates using the harmonic mean of the populations in the
!
Rev Saúde Pública 2005;39(1) www.fsp.usp.br/rsp
Influenza vaccination and mortality among the elderly Francisco PMSB et al
Based upon the models we estimated us-ing data from the 1980-98 period, we calcu-lated confidence intervals for the mean ex-pected response, i.e., the mortality rates ref-erent to the two subsequent years (1999 and 2000). In addition to models and confidence intervals, we also present the rates obtained after vaccination.
We calculated mortality rates and gener-ated graphs using Microsoft Excel (Version 7.0 for Windows 95) spreadsheets. We per-formed trend analyses using SAS (Statistical Analysis System) Version 8.0 software.
RESU LTS
Standardized mortality rates by selected res-piratory diseases increased among the popula-tion 60 years and older in São Paulo State be-tween 1980 and 1998. This was true for both men and women (Figure 1). Among men, the mean rate in the period was 5.08 deaths per thousand men, with a linear non-constant in-crease of 0.13 per year. Among women, the mean annual rate was 3.18 deaths per thousand women, with a non-constant increase of 0.08 per year. The male to female standardized mor-tality rate ratio did not change with time (p=0.338). This ratio remained in average 1.55 men for each woman, showing the greater im-portance of respiratory diseases among men.
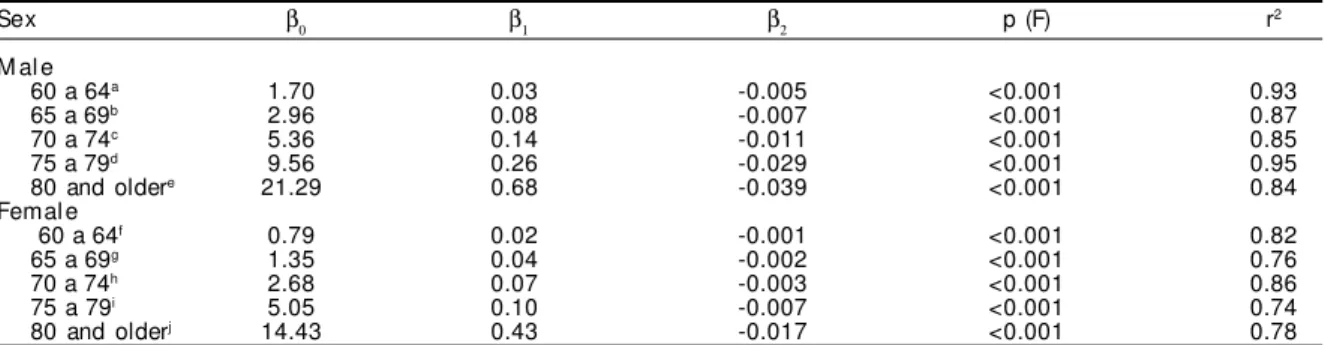
An analysis of trends in separate age groups showed that, for men and women alike (Table 1, Figure 2), the older the age group, the greater the magnitude of the annual increment.
The annual linear non-constant increase (β1) was
greater among older males. In the 75-79 years age group, this increase was as much as three times that of the fe-male population in the same age group. In both sexes, the population 80 years and older is distinguished by
the magnitude of the mean annual rate (β0) (Table 1).
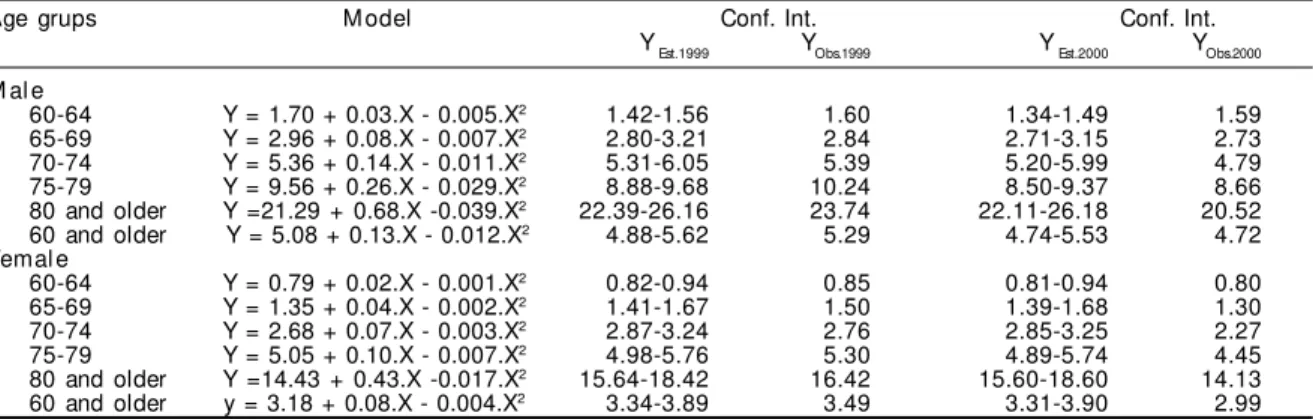
An analysis of mortality rates after the vaccine in-tervention shows that, in 1999, there was a signifi-cant reduction in these rates among women in the 70-74 years age group. In 2000, there was a steep decline in rates among men in the 70-74 and 80+ years groups, along with a significant reduction in rates among the female population in all age groups (Table 2).
For the population over 60 years as a whole,
with-Figure 1 - Standardized mortality rates by selected respiratory diseases (‰ pop.) among the elderly population, according to sex. Sao Paulo State, 1980 to 1998.
0.00 2.00 4.00 6.00 8.00
1980 1982 1984 1986 1988 1990 1992 1994 1996 1998
Years
Rate/1.000 pop
Male Female
Model
Male Female
Trend Increasing (p<0.001; r2=0.85) Increasing (p<0.001; r2=0.79)
Y = 5.08 + 0.13.(year - 1989) - 0.012.(year - 1989)2 Y = 3.18 + 0.08.(year - 1989) - 0.004.(year - 1989)2
Figure 2 - Mortality rates by selected respiratory diseases (‰ pop.) among the elderly population, according to sex and age group. Sao Paulo State, 1980 to 1998.
Male population Female population
0.00 4.00 8.00 12.00 16.00 20.00 24.00 28.00
1978 1982 1986 1990 1994 1998 2002
60-64 65-69 70-74 75-79 80 and older
0.00 4.00 8.00 12.00 16.00 20.00 24.00 28.00
1978 1982 1986 1990 1994 1998 2002
Table 1 - Regression coefficients and statistical significance of trends in mortality rates by selected respiratory diseases, according to sex and age groups. São Paulo State, 1980 to 2000.
Sex β0 β1 β2 p (F) r2
M al e
60 a 64a 1.70 0.03 -0.005 <0.001 0.93
65 a 69b 2.96 0.08 -0.007 <0.001 0.87
70 a 74c 5.36 0.14 -0.011 <0.001 0.85
75 a 79d 9.56 0.26 -0.029 <0.001 0.95
80 and oldere 21.29 0.68 -0.039 <0.001 0.84
Femal e
60 a 64f 0.79 0.02 -0.001 <0.001 0.82
65 a 69g 1.35 0.04 -0.002 <0.001 0.76
70 a 74h 2.68 0.07 -0.003 <0.001 0.86
75 a 79i 5.05 0.10 -0.007 <0.001 0.74
80 and olderj 14.43 0.43 -0.017 <0.001 0.78
" Rev Saúde Pública 2005;39(1) www.fsp.usp.br/rsp Influenza vaccination and mortality among the elderly
Francisco PMSB et al
out distinction of age group, standardized mean mor-tality rates by selected respiratory diseases fell within the expected interval for both male and female popu-lations in 1999. In 2000, however, there was a signifi-cant reduction in rates, i.e., rates fell below the lower limit of the confidence interval (Table 2, Figure 3).
Among the male population, the absence of impact of vaccination in the years following the intervention was observed only in the 60-64 years group, whereas the remaining groups showed a decreasing trend. In the fe-male population, the decreasing trend is clearer, espe-cially among the 70-74 and 75-79 age groups (Table 2).
DISCUSSION
Mortality information registries cover the vast ma-jority (95%) of deaths in São Paulo State, and thus have sufficient explanatory power for the
construc-tion of satisfactorily reliable mortality indicators.18
Ecological studies of time series are capable of show-ing the evolution of disease rates in a given geo-graphically defined population, as well as of evalu-ating the impact of healthcare interventions, being, therefore, an adequate design for examining trends in mortality rates with time.5,11,14
In the present study, we found that the trends in mortality by selected respiratory diseases showed a real increase between 1980 and 1998 in São Paulo State, even after con-trolling for the age composition in the pe-riod by using standardized rates. However, the increase in such indicators was asymmet-ric with respect to sex and age groups, with a greater annual increase among males and older groups. Respiratory diseases were con-firmed as an important cause of death among the elderly, corroborating the findings of other authors.6,7,19
Generally speaking, mortality rates by selected res-piratory diseases usually differ between the sexes in the age groups studied, but behave similarly in terms of trends throughout the period.
The peaks in mortality in 1988, 1990, and 1994/ 95, seen in Figures 1 and 2, could not be explained by the present study. Some hypotheses can be offered for later investigation, including the greater circula-tion of virulent strains, the circulacircula-tion of other etio-logical agents, and climactic factors.
The reduction in mortality rates following vaccine implementation may be due to reductions in the number of cases or in the incidence of more severe cases after vaccination, to the greater sensitivity of healthcare services in the early diagnosis of severe pulmonary conditions, or to an improvement in the specific treatments administered.
When evaluating the impact of influenza vaccina-tion, one must consider also that virus and bacteria of different etiologies may be involved in respiratory conditions leading to the hospitalization and death
of elderly persons,2,3 especially during cold and dry
seasons, this being a worldwide phenomenon.1
Figure 3 - Confidence intervals and standardized mortality rates by selected respiratory diseases (‰ pop.) among the elderly population, according to sex. Sao Paulo State, 1980 to 2000.
Male population Female population
1.00 2.00 3.00 4.00 5.00 6.00
1980 1984 1988 1992 1996 2000 1.00 2.00 3.00 4.00 5.00 6.00
1980 1984 1988 1992 1996 2000
Table 2 - Regression models and confidence intervals of mortality rates by selected respiratory diseases, according to sex and age groups. Sao Paulo State.
Age grups M odel Conf. Int. Conf. Int.
YEst.1999 YObs.1999 Y Est.2000 YObs.2000
M al e
60-64 Y = 1.70 + 0.03.X - 0.005.X2 1.42-1.56 1.60 1.34-1.49 1.59
65-69 Y = 2.96 + 0.08.X - 0.007.X2 2.80-3.21 2.84 2.71-3.15 2.73
70-74 Y = 5.36 + 0.14.X - 0.011.X2 5.31-6.05 5.39 5.20-5.99 4.79
75-79 Y = 9.56 + 0.26.X - 0.029.X2 8.88-9.68 10.24 8.50-9.37 8.66
80 and older Y =21.29 + 0.68.X -0.039.X2 22.39-26.16 23.74 22.11-26.18 20.52
60 and older Y = 5.08 + 0.13.X - 0.012.X2 4.88-5.62 5.29 4.74-5.53 4.72
Femal e
60-64 Y = 0.79 + 0.02.X - 0.001.X2 0.82-0.94 0.85 0.81-0.94 0.80
65-69 Y = 1.35 + 0.04.X - 0.002.X2 1.41-1.67 1.50 1.39-1.68 1.30
70-74 Y = 2.68 + 0.07.X - 0.003.X2 2.87-3.24 2.76 2.85-3.25 2.27
75-79 Y = 5.05 + 0.10.X - 0.007.X2 4.98-5.76 5.30 4.89-5.74 4.45
80 and older Y =14.43 + 0.43.X -0.017.X2 15.64-18.42 16.42 15.60-18.60 14.13
60 and older y = 3.18 + 0.08.X - 0.004.X2 3.34-3.89 3.49 3.31-3.90 2.99
#
Rev Saúde Pública 2005;39(1) www.fsp.usp.br/rsp
Influenza vaccination and mortality among the elderly Francisco PMSB et al
Our data show that mortality rates in São Paulo State were lower in 2000 for both sexes. Repeated yearly vaccination is associated with greater levels of im-munological protection and with reduced mortality
compared to the first immunization.1,2 Even
consid-ering the weak immune response of elderly persons to vaccination, a perspective study conducted in the
Netherlands in 19948 showed that vaccination can
reduce clinical and serological influenza by one-half in non-institutionalized elderly persons.
Nichol et al16 (1994), in a cohort study carried out
in the United States between 1990 and 1993 with 25 thousand subjects aged 65 years and older, found an impact on the prevention of hospital admissions due to pneumonia and influenza (48% to 57%) and to all acute and chronic respiratory conditions (27% to
39%). In a meta-analysis study, Gross et al9 (1995)
confirmed the reduction in respiratory diseases, hos-pital admissions, and death among institutionalized elderly persons following vaccination.
The results of the present study also indicate a re-duction in mortality by selected respiratory diseases,
varying according to sex and between different age groups. Nevertheless, a number of factors must be considered when evaluating the protective effect of influenza vaccination, including vaccine immuno-genicity, the agreement between the vaccine’s
anti-gen content and circulating viral strains,8,9 the
preva-lence of chronic diseases in the community, and pre-vious exposure to the Influenza virus. These factors vary between the seasons, as well as between differ-ent regions.
Apart from these considerations, it is likely that the investments in healthcare directed towards specific anti-influenza immunization of elderly persons in the State of São Paulo are having a positive effect on this populational segment.
In the present study, we sought to draw a general picture of the behavior of mortality due to respira-tory tract diseases among elderly persons in the last decades. Continuous evaluation of this trend in years to come may provide more consistent evidence of the impact of successive wide-coverage vaccination cam-paigns on the Brazilian elderly population.
REFERÊN CIAS
1. Ahmed AH, Nicholson KG, Nguyen-Van-Tam JS. Reduction in mortality associated with influenza vaccine during 1989-90 epidemic. Lancet 1995;346:591-5.
2. Centers for Disease Control and Prevention [CDC]. Prevention and control of influenza:
recommendations of the Advisory Committee on Immunization Practices (ACIP). MMWR Morb Mortal Wkly Rep 2000;49(RR-3):1-38.
3. Chien JW, Johnson JL. Viral pneumonias. Epidemic respiratory viruses. Postgrad Med 2000;107:41-52.
4. Dodet B. Immunity in the elderly. Vaccine 2000;18:1565.
5. França Júnior I, Monteiro CA. Estudo da tendência secular de indicadores de saúde como estratégia de investigação epidemiológica. Rev Saúde Pública 2000;34 Supl 6:57.
6. Francisco PMSB, Donalisio MRC, Latorre MRDO. Tendência da mortalidade por doenças respiratórias em idosos do Estado de São Paulo, 1980 a 1998. Rev Saúde Pública 2003;37:191-6.
7. Glezen WP, Greenberg SB, Atmar RL, Pietra PA, Couch RB. Impact of respiratory virus infections on persons with chronic underlying conditions. JAMA 2000;283:499-505.
8. Govaert TME, Thijs CTMCN, Masurel N, Sprenger MJW, Dinant GJ, Knottnerus J A. The efficacy of influenza vaccination in elderly individuals - A randomized double-blind placebo-controlled trial. JAMA 1994;272:1661-5.
9. Gross PA, Hermogenes AW, Sacks HS, Lau J, Levandowski RA. The efficacy of influenza vaccine in elderly persons. A meta-analysis and review if the literature. Ann Intern Med 1995;123:517-28.
10. Kaiser L, Couch RB, Galasso GJ, Glezen WP, Webster RG, WriIght PF, Hayden FG. First international symposium on influenza and other respiratory viruses: summary and overview. Antiviral Res 1999;42:149-76.
11. Latorre MRDO. A mortalidade por câncer de estômago no Brasil: análise do período de 1977 a 1989. Cad Saúde Pública 1997;13 Supl 1:67-78.
12. Latorre MRDO, Cardoso MRA. Análise de séries temporais em epidemiologia: uma introdução sobre os aspectos metodológicos. Rev Bras Epidemiol 2001;4:145-52.
13. Laurenti R, Mello Jorge MHP, Lebrão ML, Gotlieb, SL. Estatísticas de saúde. São Paulo: EPU; 1987.
14. Morgenstern, H. Ecologic studies. In: Rothman KJ, Greenland S. 2nd ed. Modern epidemiology.
$ Rev Saúde Pública 2005;39(1) www.fsp.usp.br/rsp Influenza vaccination and mortality among the elderly
Francisco PMSB et al
15. Neter J, Wasserman W, Kutner MH. Polynomial regression. In: Neter J, Wasserman W, Kutner MH. Applied linear statistical models. Boston: Irwin; 1990. p. 315-41.
16. Nichol KL, Margolis KL, Wuorenma J, Von Sternberg T. The efficacy and cost effectiveness of vaccination against influenza among elderly persons in the community. N Engl J Med 1994;331:778-84.
17. Nichol KL, Baken L, Nelson A. Relation between influenza vaccination and outpatient visits, hospitalization, and mortality in elderly persons with chronic lung disease. Ann Intern Med 1999;130:397-403.
18. Paes NA, Albuquerque MEE. Avaliação da qualidade dos dados populacionais e cobertura de registros de óbitos para as regiões brasileiras. Rev Saúde Pública 1999;33:33-43.
19. Ruiz T. Estudo da mortalidade e dos seus preditores na população idosa do município de Botucatu, SP [tese de doutorado]. Campinas: Faculdade de Ciências Médicas da Unicamp; 1996.
20. Secretaria da Saúde. Centro de Vigilância Sanitária. Campanha Nacional de Vacinação para o Idoso. São Paulo; 1999. [Informe Técnico]
21. Simonsen L, Schonberger LB, Stroup DF, Arden NH, Cox, NJ. The impact of influenza on mortality in the USA. In: Brown LE, Hampson AW, Webster RG. Options for the control of influenza III. Amsterdam: Elsevier Science; 1996.