Risk and protection factors for self-reported hypertension
and diabetes in João Pessoa, Brazil. The VIGITEL survey, 2014.
A cross-sectional study
Ana Paula Leite Moreira
I, Deborah Carvalho Malta
II, Rodrigo Pinheiro de Toledo Vianna
III, Patrícia Vasconcelos Leitão Moreira
III,
Alice Teles de Carvalho
IIIUniversidade Federal da Paraíba (UFPB), João Pessoa (PB), Brazil
ABSTRACT
CONTEXT AND OBJECTIVE: Chronic diseases are the main cause of death among adults and are respon-sible for most outpatient and hospital care expenses in Brazil. The objective here was to determine the prevalence of hypertension and diabetes and to analyze the associations with risk and protection factors among adults.
DESIGN AND LOCAL: Cross-sectional study in a state capital in northeastern Brazil.
METHODS: Data on adults of both sexes aged ≥ 45 years who were interviewed in the Vigitel telephone survey in 2014 were analyzed. Prevalence ratios were estimated using Poisson regression, to identify as-sociated factors.
RESULTS: Among women, the prevalence of hypertension was 48.4% and of diabetes, 12.7%; among men, the prevalences were 41.9% and 13.8%, respectively. Multivariate analysis showed that for women, age group ≥ 65 years, overweight, self-assessed poor health and dyslipidemia remained associated with higher prevalence of hypertension. For men, overweight and self-assessed poor health remained associated with higher prevalence of hypertension. Regarding diabetes, in the multivariate model for women, age group 55-64 years, schooling level between zero and four years and no regular consumption of beans remained associated with higher prevalence. For men, age groups 55-64 years and ≥ 65 years and being married or in a stable partnership were associated with higher prevalence of diabetes.
CONCLUSIONS: The results indicated that the prevalences of hypertension and diabetes were high and that preventable factors were associated with this situation, thus providing support for public policies aimed towards coping with this.
IMSc. Nutritionist, Universidade Federal da
Paraíba (UFPB), João Pessoa (PB), Brazil.
IIPhD. Associate Professor, Nursing School,
Universidade Federal de Minas Gerais (UFMG), Minas Gerais (MG), Brazil.
IIIPhD. Associate Professor, Department of
Nutrition, Universidade Federal da Paraíba (UFPB), João Pessoa (PB), Brazil.
KEY WORDS:
Chronic disease. Hypertension. Diabetes mellitus. Risk factors. Cross-sectional studies.
INTRODUCTION
he four major noncommunicable diseases are cardiovascular diseases, diabetes, neoplasms and chronic respiratory diseases. hese diseases have several common risk factors, which can be classiied as modiiable and non-modiiable. he modiiable risk factors include smoking, abu-sive consumption of alcoholic beverages, excess body weight, unhealthy eating habits, sedentary lifestyle and metabolic abnormalities such as dyslipidemias. he non-modiiable risk factors are heredity, race, sex and age.1 he Global Burden of Disease (GBD)2 study, coordinated by the
Institute of Metrics and Health Assessment (IHME) of the University of Washington (United States) showed that in Brazil, between 1990 and 2010, there were changes in the rankings among the ten leading causes of death. Among these causes of years of life lost due to premature death (YLLs), diabetes and hypertension increased by more than 40% over this period. he ive lead-ing causes of years of life lost due to death or disability (DALYs) among women were depression, ischemic heart disease, low back pain, cerebrovascular disease and diabetes; and among men, homicide, ischemic heart disease, car accidents, low back pain and cerebrovascular disease. Also according to this study,2 the risk factors that most contributed towards premature death and loss
of health among men and women in Brazil in 2010 were inadequate diet, high blood pressure, overweight and altered fasting glycemia.
(DATASUS)3 showed that diseases of the circulatory and endocrine
systems and nutritional and metabolic diseases corresponded, respectively, to proportions of deaths of 27.56% and 7.52%, in com-parison with the total number of deaths from all causes. In João Pessoa, the state capital of Paraíba, which was the subject of the present study, data from 2014 also reported by DATASUS3 showed
that diseases of the circulatory and endocrine systems and nutri-tional and metabolic diseases corresponded, respectively, to pro-portions of deaths of 27.48% and 6.67%, in comparison with the total number of deaths from all causes.
Diabetes is a highly incapacitating disease that can cause dia-betic retinopathy, amputations, nephropathies, cardiovascular and encephalic complications, among other conditions. It can impair individuals’ functional capacity, autonomy and quality of life, thus resulting in high social and inancial costs for society and for these individuals and their families.4
Hypertension is considered to be both a chronic disease and a risk factor for other diseases and chronic conditions, such as chronic kidney disease and diabetes, among others. his gives it greater prominence as these individuals’ health conditions worsen, thus contributing towards loss of quality of life, early lethality of diseases and high costs for social and healthcare systems. It has a multifac-torial nature, with an asymptomatic course in many cases, which means that this diagnosis is neglected and, consequently, so is treat-ment. In addition, hypertension is highly prevalent in Brazil and in the world, thus representing a great challenge for public health.5,6
A study carried out on the adult population of Campinas,7
state of São Paulo, showed that there were signiicant diferences in the prevalences of risk and protection factors for chronic diseases according to gender. he prevalences of smoking, former smokers, alcohol abuse, overweight, obesity and free-time physical activity were higher among men; among women, healthier eating habits and dyslipidemia were more prevalent.
Chronic diseases are responsible for the greatest proportion of the burden of diseases diagnosed in Brazil and present signiicant modiiable risk factors. he impact of these diseases and their risk factors varies according to gender and the level of development of the diferent regions of the country. Moreover, chronic diseases are highly prevalent among people aged 45 years and over.
Because very few studies on hypertension and diabetes have been conducted in João Pessoa, the aims of the present study were to ascertain the prevalence of these diseases and to identify and measure the independent efects of risk and protection factors relating to the presence of previous medical diagnoses of these diseases, as reported by adults in this municipality.
OBJECTIVE
he objectives of this study were to ascertain the prevalence of hypertension and diabetes and to identify the relationships
of sociodemographic and behavioral characteristics, food con-sumption characteristics and health indicators towards the pres-ence of previous medical diagnoses of these two chronic diseases, as reported by adults, stratiied according to sex, in a state capital in northeastern Brazil.
METHODS
his was a cross-sectional, population-based, epidemiological study that used data from the Surveillance of Risk and Protec-tion Factors for Chronic Diseases by Telephone (Vigitel) survey. he project for implementing Vigitel was approved by the National Ethics Committee for Research on Human Beings (CONEP) of the National Health Council (CNS), Ministry of Health, under report no. 355.590, of June 26, 2013, and under the certiicate of presen-tation for ethics assessment (CAAE) no. 16202813.2.0000.0008. Since the project related to telephone interviews, the free and informed consent document was replaced by verbal consent that was obtained by the Ministry of Health at the time of the inter-view. To conduct the present study, the coordination oice for non-transmissible diseases and health hazards of the Secretariat for Health Surveillance, Department of Health Situation Analysis, Ministry of Health, made data from Vigitel 2014 relating to João Pessoa (capital of the state of Paraíba) available to us.
Adults aged 45 years and over who were living in households in João Pessoa served by at least one landline telephone in the year 2014 were included. During that year, 1,517 adults aged 18 and over living in this city were interviewed as part of the Vigitel sur-vey.8,9 Out of this total, 867 interviews were conducted with adults
aged 45 years and over, i.e. the target audience of the present study. hese individuals comprised 566 females (65.28%) and 301 males (34.71%). his sample of 867 adults was weighted according to sex, age and schooling, in accordance with the methodology established for Vigitel, using the “rake” method,8-11 thus making the data of this
sample representative of the total adult population of this capital. Details of the sampling process and the weighting of Vigitel esti-mates, along with other details of the methodology used by this system can be seen in other published papers.8,9 he electronic
questionnaire used at the time of the interviews is available in the annual publication of results from Vigitel.9
he dependent variables analyzed in this study were the preva-lence of hypertension and the prevapreva-lence of diabetes, as reported by adults who had previously received these medical diagnoses. hey were deined by the percentages of adults who reported hav-ing a prior medical diagnosis as positive answers to the followhav-ing questions, respectively: “Has any doctor ever told you that you have high blood pressure?”; and “Has any doctor ever told you that you have diabetes?”.
burden of disease, as estimated by the World Health Organization for the Americas region.12 hey consisted of risk and protection
indicators selected from Vigitel, and were grouped into: sociode-mographic, behavioral, food consumption and health indicators. he sociodemographic variables were: age group (45-54, 55-64 or ≥ 65 years); marital status (single, married/stable partner-ship, widowed or separated/divorced); schooling level (0-4, 5-8, 9-11 or ≥ 12 years of study); and possession of health insurance (yes or no). he behavioral categories included: smokers (adults who reported being current smokers, regardless of the number of cigarettes, frequency and duration of smoking); former smok-ers (adults who reported being former smoksmok-ers, regardless of time elapsed); and physically inactive individuals (adults who had not exercised during their free time within the last three months, were not performing any intense physical eforts at work, were not going to work/school on foot or by bicycle with a minimum journey time of 20 minutes and were not perform-ing heavy cleanperform-ing in their homes). he food consumption vari-ables were: regular consumption of fruits, vegetvari-ables and greens (on ive or more days of the week); recommended consumption of fruits, vegetables and greens (ive servings daily, on ive or more days of the week); regular consumption of beans (on ive or more days of the week); consumption of meat with excess fat (habit of consuming red meat with visible fat and/or chicken with skin); consumption of milk with full fat content (habit of consuming whole milk fat); regular consumption of soda or arti-icial juice (on ive or more days of the week); regular consump-tion of sweets (on ive or more days per week); replacement of lunch or dinner by snacks (seven or more times a week); and high salt intake (adults who considered that their salt intake was high or too high). he health indicators analyzed the following conditions: overweight, in terms of the body mass index (BMI); deined as body weight (kg) divided by square of height (m2), for
which self-reported information on weight and height was used to calculate BMI and adults who presented BMI ≥ 25 kg/m2 were
considered to be overweight, as classiied by the World Health Organization;13 self-assessed poor/very poor health (adults who
assessed their health as poor or very poor, in answer to the ques-tion “Would you rate your health as: very good, good, normal, poor, or very poor?”); and dyslipidemia (adults who reported having a previous medical diagnosis of dyslipidemia: high cho-lesterol or triglycerides).
All the analyses were performed using the Vigitel expansion factor, using the Stata survey procedure version 11 SE. Initially, Pearson chi-square association tests were performed to verify the existence of a statistical association between the independent vari-ables and outcomes (P ≤ 0.05). Subsequently, the Poisson regression model was used to verify the existence of factors associated with arterial hypertension and diabetes. he variables that presented
P ≤ 0.20 in the univariate analysis were considered for introduc-tion into the multivariate model. he magnitudes of the associa-tions found were measured using prevalence ratios (PR) with their respective 95% conidence intervals (95% CI).
RESULTS
Data from 867 adults aged 45 years and over were analyzed. hese comprised 566 women and 301 men, corresponding to 65.28% and 34.72% of the total sample, respectively. Another 271 adults were excluded because they were 18-44 years old. Most of these individuals were between 25-34 years old, had 9 to 11 years of educational attainment and had no health insurance.
Previous medical diagnoses of hypertension and diabetes were reported by 45.8% and 13.1% of the population, respectively, and there were no signiicant diferences between the genders.
Table 1 describes the sociodemographic, behavioral, food
consumption and health indicators of the study population and the presence of hypertension and diabetes, stratiied according to gender. Among the women, there was higher prevalence of hyper-tension in the age group ≥ 65 years (95% CI: 50.6-66.2) and among those who did not consume whole milk (95% CI: 46.8-59.9); those who were overweight (95% CI: 52.2-65.4); those who self-rated their health as poor/very poor (95% CI: 48.1-85.2); and those who reported having a medical diagnosis of dyslipidemia (95% CI: 55.6-71.3). Among the men, there was statistically signiicant higher prevalence of hypertension in the age group ≥ 65 years (95% CI: 39.1-62.2) and among those who reported consuming meats with excessive fat (95% CI: 17.6-43.6); those who were overweight (95% CI: 39.0-56.6); those who self-assessed their health as poor (95% CI: 64.2-97.6); and those who reported having a medical diagnosis of dyslipidemia (95% CI: 42.0-67.4).
There was higher prevalence of diabetes among women over 55 years old (95% CI: 11.0-26.2); among those with 0-4 years of education (95% CI: 11.8-29.5); among those who did not con-sume beans regularly (95% CI: 11.9-26.2); among those who did not replace lunch or dinner with snacks (95% CI: 10.3-17.7); and among those who were overweight (95% CI: 11.2-20.8). There was higher prevalence of diabetes among men in the age group of 55-64 years (95% CI: 13.5-39.9); among those who were married or were in a stable partnership (95% CI: 11.8-24.8); among those who reported being former smokers (95% CI: 12.0-32.1); and among those who were overweight (95% CI: 11.3-25.1) (Table 1).
Table 2 shows the crude and adjusted analyses on factors
Variables
Hypertension Diabetes
Female sex Male sex Total
P (%)*
Female sex Male sex Total P
(%)* P (%)* P-value† P (%)* P-value† P (%)* P-value† P (%)* P-value† Sociodemographic indicators
Age group
45-54 years 40.1
0.010
31.9
0.038
36.7 6.8
0.011
4.3
0.001
5.8
55-64 years 51.5 50.0 50.9 17.3 24.4 20.2
≥ 65 years 58.6 50.7 55.6 17.2 18.5 17.7
Marital status
Single 38.7
0.278
36.9
0.892
38.1 9.2
0.401
0.6
0.000
6.3
Married/stable partnership 48.6 42.7 45.7 12.1 17.4 14.7
Widowed 49.9 49.7 49.9 18.1 4.6 16.9
Separated/divorced 57.5 39.1 51.0 15.5 3.8 11.4
Education
≥ 12 years 42.2
0.298
35.0
0.544
39.4 5.8
0.048
15.1
0.889
9.3
9-11 years 45.4 46.5 45.8 10.2 13.2 11.3
5-8 years 48.6 36.4 44.0 14.0 11.3 13.0
0-4 years 56.2 45.3 51.2 19.1 15.6 17.5
Possession of health insurance
Yes 45.5
0.337 49.5 0.105 47.0 10.4 0.277 16.7 0.387 12.7
No 50.5 37.7 45.2 14.0 12.2 13.2
Behavioral indicators Smokers
No 49.4
0.092 42.0 0.950 46.7 12.4 0.414 13.3 0.686 12.7
Yes 31.2 41.4 38.1 18.4 16.2 16.9
Former smokers
No 48.7
0.875 42.4 0.870 46.4 14.1 0.197 9.8 0.046 12.5
Yes 47.8 41.2 44.7 9.2 20.2 14.4
Physically inactive
No 46.2
0.129 38.4 0.117 43.1 11.2 0.130 13.8 0.988 12.2
Yes 55.4 51.7 53.8 12.7 13.9 15.8
Food consumption indicators Regular consumption of FVG
Yes 45.5
0.265 43.6 0.687 44.8 11.9 0.624 13.7 0.981 12.5
No 51.4 40.7 46.7 13.5 13.9 13.7
Recommended consumption of FVG
Yes 47.2
0.778 45.7 0.571 46.7 11.0 0.512 10.5 0.398 10.8
No 48.8 40.8 45.5 13.3 14.8 13.9
Regular consumption of beans
Yes 47.4
0.527 41.2 0.572 44.6 10.6 0.049 13.9 0.880 12.1
No 50.9 46.4 49.7 18.0 12.9 16.7
Meat with excessive fat
No 49.3
0.323 46.1 0.041 48.1 12.0 0.259 13.4 0.835 12.5
Yes 40.4 28.9 33.2 18.7 14.9 16.3
Milk with full fat content
No 53.4
0.024 41.5 0.875 48.6 15.2 0.077 15.8 0.320 15.4
Yes 41.0 42.6 41.6 9.0 10.9 9.8
Regular consumption of soda or artiicial juice
No 48.6
0.746 43.7 0.183 46.7 12.5 0.609 14.4 0.452 13.2
Yes 44.9 27.5 34.5 17.0 9.0 12.2
Regular consumption of sweets
No 47.9
0.568 43.5 0.099 46.1 13.6 0.087 14.5 0.209 14.0
Yes 51.9 26.5 43.5 6.3 6.5 6.4
Table 1. Prevalences of hypertension and diabetes in the population, according to gender and sociodemographic, behavioral, food consumption and health indicator characteristics. João Pessoa, Paraíba, Brazil (2014)
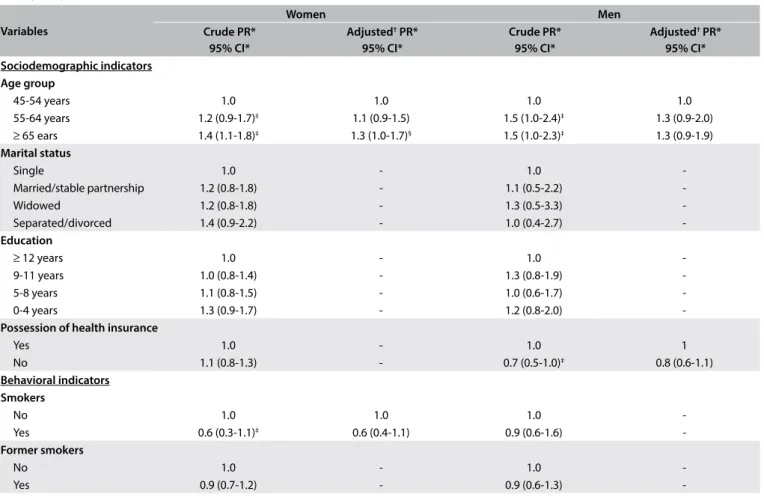
Table 2. Prevalence and prevalence ratios (crude and adjusted) for prior medical diagnosis of hypertension reported by women (n = 566) and men (n = 300), according to sociodemographic, behavioral, food consumption and health indicator variables. João Pessoa, Paraíba, Brazil (2014)
Continue...
Variables
Women Men
Crude PR* 95% CI*
Adjusted† PR*
95% CI*
Crude PR* 95% CI*
Adjusted† PR*
95% CI* Sociodemographic indicators
Age group
45-54 years 1.0 1.0 1.0 1.0
55-64 years 1.2 (0.9-1.7)‡ 1.1 (0.9-1.5) 1.5 (1.0-2.4)‡ 1.3 (0.9-2.0)
≥ 65 ears 1.4 (1.1-1.8)‡ 1.3 (1.0-1.7)§ 1.5 (1.0-2.3)‡ 1.3 (0.9-1.9)
Marital status
Single 1.0 - 1.0
-Married/stable partnership 1.2 (0.8-1.8) - 1.1 (0.5-2.2)
-Widowed 1.2 (0.8-1.8) - 1.3 (0.5-3.3)
-Separated/divorced 1.4 (0.9-2.2) - 1.0 (0.4-2.7)
-Education
≥ 12 years 1.0 - 1.0
-9-11 years 1.0 (0.8-1.4) - 1.3 (0.8-1.9)
-5-8 years 1.1 (0.8-1.5) - 1.0 (0.6-1.7)
-0-4 years 1.3 (0.9-1.7) - 1.2 (0.8-2.0)
-Possession of health insurance
Yes 1.0 - 1.0 1
No 1.1 (0.8-1.3) - 0.7 (0.5-1.0)‡ 0.8 (0.6-1.1)
Behavioral indicators Smokers
No 1.0 1.0 1.0
-Yes 0.6 (0.3-1.1)‡ 0.6 (0.4-1.1) 0.9 (0.6-1.6)
-Former smokers
No 1.0 - 1.0
-Yes 0.9 (0.7-1.2) - 0.9 (0.6-1.3)
-Variables
Hypertension Diabetes
Female sex Male sex Total
P (%)*
Female sex Male sex Total P
(%)* P (%)* P-value† P (%)* P-value† P (%)* P-value† P (%)* P-value† Replacement of lunch or dinner with snack
No 49.9
0.083 42.9 0.284 45.3 1.6 0.032 14.4 0.163 13.9
Yes 61.3 29.1 51.0 4.7 5.9 5.1
High salt consumption
No 47.6
0.113 42.7 0.571 45.7 12.7 0.916 14.7 0.429 13.5
Yes 64.3 36.1 47.0 12.0 7.1 9.0
Health indicators BMI – overweight
No 32.4
0.000 28.4 0.013 31.1 8.6 0.042 6.1 0.009 7.7
Yes 59.0 47.7 54.0 15.4 17.1 16.1
Self-assessed poor/very poor health
No 47.0
0.039 39.2 0.000 43.8 12.7 0.887 12.9 0.125 12.8
Yes 69.8 89.6 77.1 11.8 28.7 18.0
Self-reported dyslipidemia
No 38.2
0.000 36.1 0.017 37.3 48.9 0.092 13.2 0.702 11.6
Yes 63.8 55.0 60.8 51.1 15.2 15.8
Note: the results express the percentage for the population. *Prevalence; †Statistical analysis performed was Pearson’s chi-square test. BMI = body mass index; FVG = fruits, vegetables and greens.
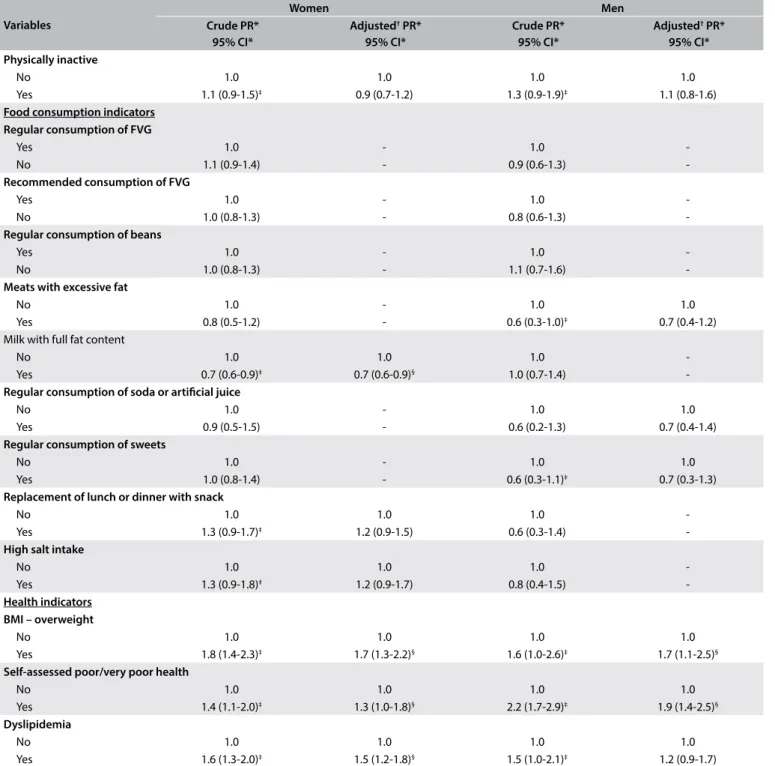
Variables
Women Men
Crude PR* 95% CI*
Adjusted† PR*
95% CI*
Crude PR* 95% CI*
Adjusted† PR*
95% CI* Physically inactive
No 1.0 1.0 1.0 1.0
Yes 1.1 (0.9-1.5)‡ 0.9 (0.7-1.2) 1.3 (0.9-1.9)‡ 1.1 (0.8-1.6)
Food consumption indicators Regular consumption of FVG
Yes 1.0 - 1.0
-No 1.1 (0.9-1.4) - 0.9 (0.6-1.3)
-Recommended consumption of FVG
Yes 1.0 - 1.0
-No 1.0 (0.8-1.3) - 0.8 (0.6-1.3)
-Regular consumption of beans
Yes 1.0 - 1.0
-No 1.0 (0.8-1.3) - 1.1 (0.7-1.6)
-Meats with excessive fat
No 1.0 - 1.0 1.0
Yes 0.8 (0.5-1.2) - 0.6 (0.3-1.0)‡ 0.7 (0.4-1.2)
Milk with full fat content
No 1.0 1.0 1.0
-Yes 0.7 (0.6-0.9)‡ 0.7 (0.6-0.9)§ 1.0 (0.7-1.4)
-Regular consumption of soda or artiicial juice
No 1.0 - 1.0 1.0
Yes 0.9 (0.5-1.5) - 0.6 (0.2-1.3) 0.7 (0.4-1.4)
Regular consumption of sweets
No 1.0 - 1.0 1.0
Yes 1.0 (0.8-1.4) - 0.6 (0.3-1.1)‡ 0.7 (0.3-1.3)
Replacement of lunch or dinner with snack
No 1.0 1.0 1.0
-Yes 1.3 (0.9-1.7)‡ 1.2 (0.9-1.5) 0.6 (0.3-1.4)
-High salt intake
No 1.0 1.0 1.0
-Yes 1.3 (0.9-1.8)‡ 1.2 (0.9-1.7) 0.8 (0.4-1.5)
-Health indicators BMI – overweight
No 1.0 1.0 1.0 1.0
Yes 1.8 (1.4-2.3)‡ 1.7 (1.3-2.2)§ 1.6 (1.0-2.6)‡ 1.7 (1.1-2.5)§
Self-assessed poor/very poor health
No 1.0 1.0 1.0 1.0
Yes 1.4 (1.1-2.0)‡ 1.3 (1.0-1.8)§ 2.2 (1.7-2.9)‡ 1.9 (1.4-2.5)§
Dyslipidemia
No 1.0 1.0 1.0 1.0
Yes 1.6 (1.3-2.0)‡ 1.5 (1.2-1.8)§ 1.5 (1.0-2.1)‡ 1.2 (0.9-1.7)
*PR = prevalence ratio; CI = conidence interval; †Statistical analysis adjusted using Poisson regression, performed only on independent variables that presented signiicance ≤ 0.20 (P ≤ 0.20) in Pearson’s chi-square test; ‡P
≤ 0.20; §P
≤ 0.05. BMI = body mass index; FVG = fruits, vegetables and greens.
Table 2. Continuation.
milk remained associated with lower prevalence of hypertension in women. In the adjusted analysis for men, overweight and self-rated poor health were independently associated with hyperten-sion. he results difered between the age groups of 55-64 years and ≥ 65 years. Presence of a previous medical diagnosis of dys-lipidemia lost its statistical signiicance in the adjusted analysis.
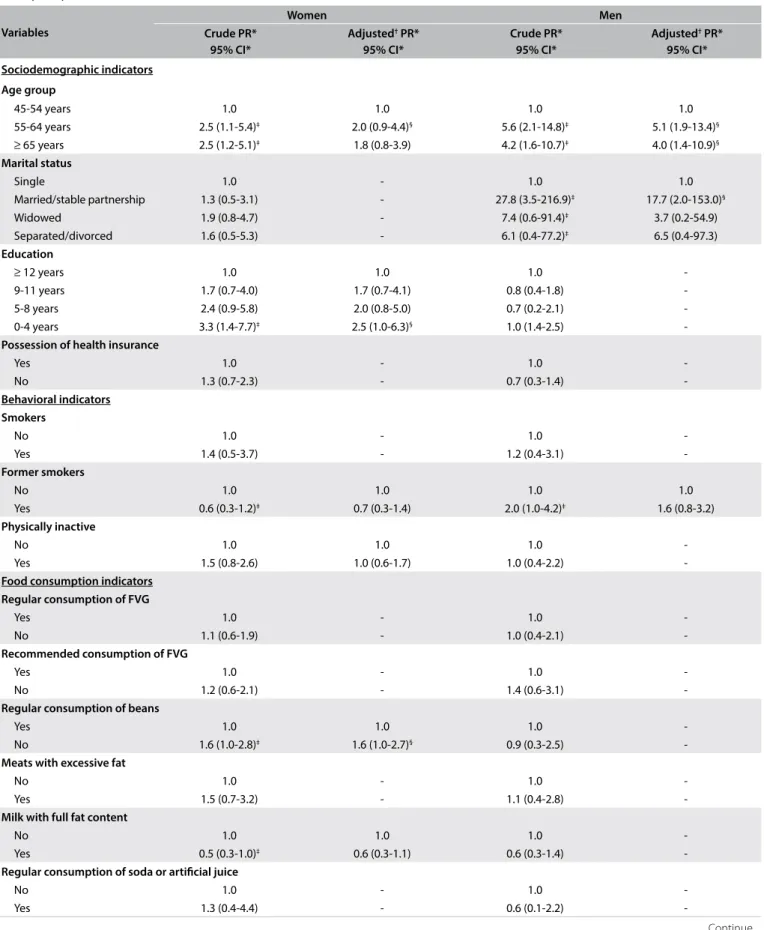
Table 3 shows the crude and adjusted analyses on factors
Variables
Women Men
Crude PR* 95% CI*
Adjusted† PR*
95% CI*
Crude PR* 95% CI*
Adjusted† PR*
95% CI*
Sociodemographic indicators
Age group
45-54 years 1.0 1.0 1.0 1.0
55-64 years 2.5 (1.1-5.4)‡ 2.0 (0.9-4.4)§ 5.6 (2.1-14.8)‡ 5.1 (1.9-13.4)§
≥ 65 years 2.5 (1.2-5.1)‡ 1.8 (0.8-3.9) 4.2 (1.6-10.7)‡ 4.0 (1.4-10.9)§
Marital status
Single 1.0 - 1.0 1.0
Married/stable partnership 1.3 (0.5-3.1) - 27.8 (3.5-216.9)‡ 17.7 (2.0-153.0)§
Widowed 1.9 (0.8-4.7) - 7.4 (0.6-91.4)‡ 3.7 (0.2-54.9)
Separated/divorced 1.6 (0.5-5.3) - 6.1 (0.4-77.2)‡ 6.5 (0.4-97.3)
Education
≥ 12 years 1.0 1.0 1.0
-9-11 years 1.7 (0.7-4.0) 1.7 (0.7-4.1) 0.8 (0.4-1.8)
-5-8 years 2.4 (0.9-5.8) 2.0 (0.8-5.0) 0.7 (0.2-2.1)
-0-4 years 3.3 (1.4-7.7)‡ 2.5 (1.0-6.3)§ 1.0 (1.4-2.5)
-Possession of health insurance
Yes 1.0 - 1.0
-No 1.3 (0.7-2.3) - 0.7 (0.3-1.4)
-Behavioral indicators Smokers
No 1.0 - 1.0
-Yes 1.4 (0.5-3.7) - 1.2 (0.4-3.1)
-Former smokers
No 1.0 1.0 1.0 1.0
Yes 0.6 (0.3-1.2)‡ 0.7 (0.3-1.4) 2.0 (1.0-4.2)‡ 1.6 (0.8-3.2)
Physically inactive
No 1.0 1.0 1.0
-Yes 1.5 (0.8-2.6) 1.0 (0.6-1.7) 1.0 (0.4-2.2)
-Food consumption indicators Regular consumption of FVG
Yes 1.0 - 1.0
-No 1.1 (0.6-1.9) - 1.0 (0.4-2.1)
-Recommended consumption of FVG
Yes 1.0 - 1.0
-No 1.2 (0.6-2.1) - 1.4 (0.6-3.1)
-Regular consumption of beans
Yes 1.0 1.0 1.0
-No 1.6 (1.0-2.8)‡ 1.6 (1.0-2.7)§ 0.9 (0.3-2.5)
-Meats with excessive fat
No 1.0 - 1.0
-Yes 1.5 (0.7-3.2) - 1.1 (0.4-2.8)
-Milk with full fat content
No 1.0 1.0 1.0
-Yes 0.5 (0.3-1.0)‡ 0.6 (0.3-1.1) 0.6 (0.3-1.4)
-Regular consumption of soda or artiicial juice
No 1.0 - 1.0
-Yes 1.3 (0.4-4.4) - 0.6 (0.1-2.2)
-Table 3. Prevalence and prevalence ratios (crude and adjusted) for prior medical diagnosis of diabetes reported by women (n = 566) and men (n = 297), according to sociodemographic, behavioral, food consumption and health indicator variables. João Pessoa, Paraíba, Brazil (2014)
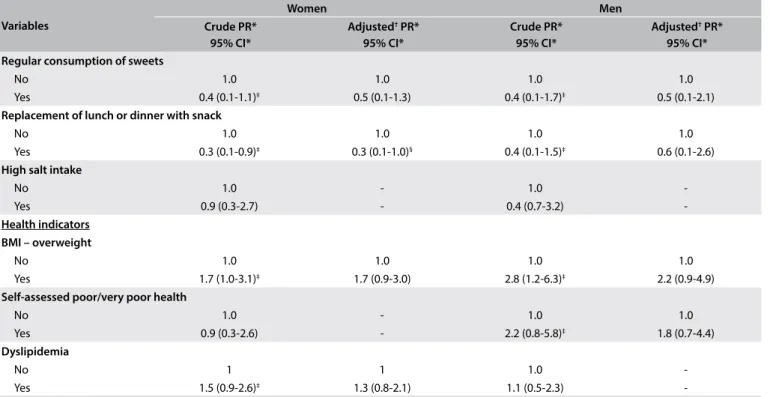
of 5-8 years, which lost their association with the prevalence of diabetes in the adjusted analysis. Replacing meals with snacks remained associated with lower prevalence of diabetes in women. In the adjusted analysis for men, the age groups of 55-64 years and
≥ 65 years remained independently associated with diabetes, along with being married or in a stable partnership.
DISCUSSION
he results from the present study identiied factors associ-ated with hypertension and diabetes in the study population. For women, hypertension remained associated with the age group ≥ 65 years old and with higher prevalence of overweight, self-rated poor/very poor health and dyslipidemia. For men, hypertension was associated with higher prevalence of over-weight and self-rated poor/very poor health. Regarding diabetes, in women, the age group of 55-64 years, educational attainment of 0-4 years and regular non-consumption of beans were associ-ated with higher prevalence of this chronic disease. In men, the age groups of 55-64 years and ≥ 65 years were associated with higher prevalence of diabetes, along with being married or in a stable partnership.
he prevalence of hypertension identiied in the present study was greater than that found through the Vigitel survey in João Pessoa (the state capital of Paraiba) in the years 201214 and 2013,15
when the self-reported frequencies of a medical diagnosis of this chronic disease among adults aged ≥ 18 years were 25.7% and 24.4%, respectively. he prevalence of diabetes was similar to that found in a study conducted in Florianópolis,16 Santa Catarina, Brazil, in
which data on elderly people aged ≥ 60 years with self-reported diagnoses of diabetes were evaluated. Moreover, the prevalence of diabetes identiied in the present study was also greater than that found through the Vigitel survey in João Pessoa in the years 201214
and 2013,15 when the self-reported frequencies of a medical
diag-nosis of diabetes among adults were 5.9% and 6.5%, respectively. In the present study, higher prevalences of hypertension and diabetes occurred with advancing age, in agreement with previous research. Higher prevalence of noncommunicable dis-eases with advancing age is an expected result because of the characteristics of these diseases and structural and physiologi-cal changes that occur in the body during aging.16,17 However, it
is worth mentioning that, regarding diabetes, there was a slight decrease in prevalence with advancing age. his inverse relation-ship was also found in the ISA-SP18 project (Health Surveys in
the State of São Paulo) and in the SABE19 study (Health, well-
being and aging). One possible explanation might relate to survival bias, given the greater mortality among diabetics with increas-ing age, due to the great number of complications resultincreas-ing from this disease.4,18
Variables
Women Men
Crude PR* 95% CI*
Adjusted† PR*
95% CI*
Crude PR* 95% CI*
Adjusted† PR*
95% CI* Regular consumption of sweets
No 1.0 1.0 1.0 1.0
Yes 0.4 (0.1-1.1)‡ 0.5 (0.1-1.3) 0.4 (0.1-1.7)‡ 0.5 (0.1-2.1)
Replacement of lunch or dinner with snack
No 1.0 1.0 1.0 1.0
Yes 0.3 (0.1-0.9)‡ 0.3 (0.1-1.0)§ 0.4 (0.1-1.5)‡ 0.6 (0.1-2.6)
High salt intake
No 1.0 - 1.0
-Yes 0.9 (0.3-2.7) - 0.4 (0.7-3.2)
-Health indicators BMI – overweight
No 1.0 1.0 1.0 1.0
Yes 1.7 (1.0-3.1)‡ 1.7 (0.9-3.0) 2.8 (1.2-6.3)‡ 2.2 (0.9-4.9)
Self-assessed poor/very poor health
No 1.0 - 1.0 1.0
Yes 0.9 (0.3-2.6) - 2.2 (0.8-5.8)‡ 1.8 (0.7-4.4)
Dyslipidemia
No 1 1 1.0
-Yes 1.5 (0.9-2.6)‡ 1.3 (0.8-2.1) 1.1 (0.5-2.3)
-*PR = prevalence ratio; CI = conidence interval; †Statistical analysis adjusted using the Poisson regression, performed only on independent variables that presented signiicance ≤ 0.20 (P ≤ 0.20) in Pearson’s chi-square test; ‡P
≤ 0.20; §P
≤ 0.05. BMI = body mass index; FVG = fruits, vegetables and greens.
Self-assessed poor/very poor health was associated with hyper-tension in both genders. he literature generally indicates that health evaluations are worse among women, since they are the individuals who access healthcare services the most. hus, women have greater concern for and perception of their health. On the other hand, men tend to self-evaluate their health as poor only in the presence of some disease.16 In a study carried out by Carvalho
et al.,20 the prevalence of self-assessed poor health was signiicantly
higher among individuals with lower educational level, those with chronic disease (hypertension, diabetes or obesity) and women, both in northeastern Brazil and in Portugal.
he present study also showed that dyslipidemia was signii-cantly associated with hypertension among women. here is evi-dence of a correlation between lipid proile and systemic arterial pressure, as observed in metabolic syndrome.21 Regarding food
consumption variables, despite the consensus in the literature that consumption of foods that are considered to be risk factors for non-communicable chronic diseases (such as high-fat foods) and replacement of meals by snacks (usually composed of snack foods and fast food) have direct relationships with occurrences of chronic diseases, the present study did not conirm these associa-tion. hese results may have two explanations: the women involved might already have been undergoing treatment, with dietary reedu-cation to control hypertension and diabetes, thus forming a frame-work of reverse causality; or these women might also have distorted their reporting of some foods, if they already knew their benei-cial or even harmful efects on health. Individuals with diagnoses of non-communicable chronic diseases are more likely to attend healthcare services, where they are advised to change their eating and healthcare behaviors. In such cases, the inverse association is a positive indicator.22,23
Starting with the 2013 Vigitel survey,24 questions regarding
replacement of meals by snacks were included. In João Pessoa, interviewees in this situation who had been replacing meals with regional foods such as tapioca, couscous and other items that do not it the deinition of dinner may have been included. he questionnaire only became more speciic ater Vigitel 2015, through inclusion of positive responses regarding consumption of pizzas, sandwiches and other processed snacks, thus exclud-ing items that are common in some regions, such as couscous and tacacá, among others.
Not consuming beans regularly was associated with higher prevalence of diabetes among women. Beans are legumes that traditionally have formed part of the Brazilian diet and adequate consumption of beans has been strongly associated with protection against several diseases, since it is one of the foods with propor-tionally larger amounts of dietary iber, compared with other foods and constitutes an important item within healthy food consump-tion.25 Some Brazilian studies on populations in the northeastern
and southeastern regions have shown that bean consumption has beneicial efects at the population level, through providing pro-tective efects against body weight gain.26
he present study also found an association between lower schooling level (0-4 years) and higher prevalence of diabetes among women. his was similar to the indings from a study carried out in the city of Viçosa, Minas Gerais,27 in which higher schooling
lev-els were inversely associated with occurrences of diabetes among 621 elderly individuals aged 60 years and over. Likewise, in a study carried out in the municipality of Triunfo,28 in the backlands of
the state of Pernambuco, Brazil, on a representative sample of 198 adults with a mean age of 57.7 years, all the cases of diabetes were among individuals who were illiterate or had only had elementary education. he fact that the higher the schooling level is, the lower the chances are that individuals will develop hypertension and/or diabetes, demonstrates that government investment in education is paramount. Low educational level can hinder access to healthcare information and limit understanding of the guidelines regarding prevention and/or treatment of diabetes.27
Regarding marital status, for men, being married or in a sta-ble partnership showed a statistically signiicant association with occurrences of diabetes. his result was contrary to those of other studies, such as GAZEL,29 in which reports of non-communicable
chronic diseases were more frequent among individuals living alone. hat association seemed to result from greater exposure to behav-ioral risk factors for chronic diseases among single individuals.
he results from the present study also demonstrated that overweight was a determinant strongly associated with occur-rences of hypertension. Other studies on elderly individuals in the municipalities of Marques de Souza (Rio Grande do Sul)30
and Bauru (São Paulo)17 and from the Vigitel survey,31 conducted
in all Brazilian state capitals, showed that between 20% and 30% of the prevalence of hypertension could be explained by an association between overweight and increased risk of develop-ing this disease.31
Some limitations of the present study need to be pointed out. One limitation to be highlighted relates speciically to the method-ology used in the Vigitel system: only individuals living in house-holds that have a landline can be interviewed, which gives rise to the possibility of calibration bias. However, weighting factors through which it is sought through post-stratiication to estimate the prevalence taking into account diferences in the demographic characteristics of the Vigitel sample in relation to those of the entire population are used. Furthermore, the high response rate achieved through Vigitel contributes to the quality of the data.
underestimation of weight, cannot be discarded given that Vigitel provides self-reported and unmeasured weight and height. However, validation studies on some Vigitel indicators have been conducted in Brazil,32,33 showing agreement between the information reported
through Vigitel and the information from household surveys. Vigitel has the advantage of being a non-invasive method in which it is easy to obtain data, at low cost.
Since Vigitel has a cross-sectional methodological design, it is not possible to establish any temporal cause-and-efect relationship among the associations between outcomes and independent vari-ables. herefore, it cannot distinguish whether the factors associ-ated with hypertension and diabetes are causes or consequences of illness. However, recognizing the risk factors associated with chronic diseases is essential for identifying groups with speciic needs and for guiding public policies, through establishing appro-priate monitoring of these risk factors.
A further limitation of the present study relates to its extrac-tion of Vigitel data, in which data from only one Brazilian state capital were separated out. his potentially reduced the statistical power of the tests through decreasing the sample size.
Moreover, only adults aged 45 and over were included, thus hin-dering knowledge of the behavior of the population under 45 years old. Since hypertension and diabetes are chronic diseases, these factors may have changed over the course of life, thereby reduc-ing the efect observed in this study. However, this is a limitation of the cross-sectional study design.
Despite the limitations identiied, some potentialities of this study stood out. Cross-sectional population-based studies on representative samples conducted through telephone surveys are of great relevance because they are fast and cost-efective alternatives. hey thus constitute an important epidemiological tool for determining the dimensions of problems, through esti-mating indicators for health conditions, health-related behav-iors and access to and use of healthcare and disease treatment services. Such studies provide support for actions that may be implemented to promote health and prevent non-communicable chronic diseases in the reference population or in others with similar characteristics.
CONCLUSION
he results obtained conirmed the importance of hypertension and diabetes as a public health problem and identiied a list of fac-tors associated with these chronic diseases, among which some would be susceptible to intervention. hus, this study identiied an urgent need for speciic interventions in this population, with implementation of healthcare aimed towards minimizing the complications arising from these pathological conditions, as well as preventing the onset of other chronic diseases. hese inter-ventions should be conducted in such a way that they allow
individuals to discuss issues relating to their chronic conditions and the risk factors involved, while at the same time enabling stimulation and providing conditions that encourage these indi-viduals to adopt healthier lifestyles.
REFERENCES
1. Brasil. Ministério da Saúde. Secretaria de Vigilância em Saúde. Departamento de Análise de Situação de Saúde. Plano de ações estratégicas para o enfrentamento das doenças crônicas não transmissíveis (DCNT) no Brasil 2011-2022. Brasília: Ministério da Saúde; 2011. Available from: http://bvsms.saude.gov.br/bvs/publicacoes/ plano_acoes_enfrent_dcnt_2011.pdf. Accessed in 2017 (Jul 28). 2. Institute for Health Metrics and Evaluation. Data visualizations. Available
from: http://www.healthdata.org/results/data-visualizations. Accessed in 2017 (Jul 28).
3. Brasil. Ministério da Saúde. Secretaria de Vigilância em Saúde. Coordenação Geral de Informações e Análises Epidemiológicas. Informações de saúde. Sistema de informações sobre mortalidade (SIM). Available from: http://tabnet.datasus.gov.br/cgi/deftohtm.exe?sim/ cnv/obt09pb.def. Accessed in 2017 (Feb 22).
4. Francisco PMSB, Belon AP, Barros MBA, et al. Diabetes auto-referido em idosos: prevalência, fatores associados e práticas de controle [Self-reported diabetes in the elderly: prevalence, associated factors, and control practices]. Cad Saúde Pública. 2010;26(1):175-84.
5. World Health Organization. World health statistics 2016: monitoring health for the SDGs. Geneva: World Health Organization; 2016. 6. Weschenfelder Magrini D, Gue Martini J. Hipertensión arterial: principales
factores de riesgo modiicables en la estrategia salud de la familia [Hipertensão arterial: principais fatores de risco modificáveis na estratégia saúde da família]. Enferm Glob. 2012;11(26):344-53. 7. Francisco PMSB, Malta DC, Segri NJ, Barros MBA. Desigualdades
sociodemográicas nos fatores de risco e proteção para doenças crônicas não transmissíveis; inquérito telefônico em Campinas, São Paulo [Sociodemographic inequalities in non-communicable chronic disease risk and protection factors: telephone survey in Campinas, São Paulo, Brazil]. Epidemiol Serv Saúde. 2015;24(1):7-18.
8. Moura EC, Monteiro CA, Claro RM, et al. Vigilância de fatores de risco para doenças crônicas por inquérito telefônico nas capitais dos 26 estados brasileiros e no Distrito Federal (2006) [Surveillance of risk-factors for chronic diseases through telephone interviews in 27 Brazilian cities (2006)]. Rev Bras Epidemiol. 2008;11(supl 1):20-37.
9. Brasil. Ministério da Saúde. Secretaria de Vigilância em Saúde. Departamento de Vigilância de Doenças e Agravos não Transmissíveis e Promoção da Saúde. Vigitel Brasil 2014: vigilância de fatores de risco e proteção para doenças crônicas por inquérito telefônico. Brasília: Ministério da Saúde; 2015. Available from: http://bvsms.saude.gov.br/ bvs/publicacoes/vigitel_brasil_2014.pdf. Accessed in 2017 (Jul 28). 10. Graham K. Compensating for missing survey data. Michigan: Ann
11. Bernal RTI, Malta DC, de Araújo TS, Silva NN. Inquérito por telefone: pesos de pós-estratiicação para corrigir vícios de baixa cobertura em Rio Branco, AC [Telephone survey: post-stratiication adjustments to compensate non-coverage bias in city of Rio Branco, Northern Brazil]. Rev Saúde Pública. 2013;47(2):316-25.
12. World Health Organization. Preventing chronic diseases: a vital investment. Geneva: World Health Organization; 2005.
13. World Health Organization. Obesity: preventing and managing the global epidemic. Report of a WHO Consultation (WHO Technical Report Series 894). Geneva: World Health Organization; 2000.
14. Brasil. Ministério da Saúde. Secretaria de Vigilância em Saúde. Departamento de Vigilância de Doenças e Agravos não Transmissíveis e Promoção da Saúde. Vigitel Brasil 2012: vigilância de fatores de risco e proteção para doenças crônicas por inquérito telefônico. Brasília: Ministério da Saúde; 2013. Available from: http://bvsms.saude.gov.br/ bvs/publicacoes/vigitel_brasil_2012_vigilancia_risco.pdf. Accessed in 2017 (Jul 28).
15. Brasil. Ministério da Saúde. Secretaria de Vigilância em Saúde. Departamento de Vigilância de Doenças e Agravos não Transmissíveis e Promoção da Saúde. Vigitel Brasil 2013: vigilância de fatores de risco e proteção para doenças crônicas por inquérito telefônico. Brasília: Ministério da Saúde; 2014. Available from: http://bvsms.saude.gov.br/ bvs/publicacoes/vigitel_brasil_2013.pdf. Accessed in 2017 (Jul 28). 16. Malta DC, Iser BPM, Oliveira MM, et al. Prevalência de fatores de risco e
proteção para doenças crônicas não transmissíveis em adultos: estudo transversal, Brasil 2012 [Prevalence of risk and protective factors for chronic diseases in adult population: cross-sectional study, Brazil 2012]. Epidemiol Serv Saúde. 2014;23(4):609-22.
17. Turi BC, Codogno JS, Fernandes RA, Monteiro HL. Frequência de ocorrência e fatores associados à hipertensão arterial em pacientes do Sistema Único de Saúde [Frequency and associated factors of hypertension in public health system patients]. Rev Bras Ativ Fís Saúde. 2013;18(1):43-52.
18. Mendes TAB, Goldbaum M, Cesar CLG, et al. Diabetes mellitus: fatores associados à prevalência em idosos, medidas e práticas de controle e uso dos serviços de saúde em São Paulo, Brasil [Diabetes mellitus: factors associated with prevalence in the elderly, control measures and practices, and health services utilization in São Paulo, Brazil]. Cad Saúde Pública. 2011;27(6):1233-43.
19. Lebrão ML, Laurenti R. Saúde, bem-estar e envelhecimento: o estudo SABE no município de São Paulo [Health, well-being and aging: the SABE study in São Paulo, Brazil]. Rev Bras de Epidemiol. 2005;8(2):127-41. 20. Carvalho AT, Malta DC, Barros MBA, et al. Desigualdades na autoavaliação de saúde: puma análise para populações do Brasil e de Portugal [Inequalities in self-rated health: an analysis of the Brazilian and Portuguese populations]. Cad Saúde Pública. 2015;31(11):2449-61. 21. Marte AP, Santos RD. Bases isiopatológicas da dislipidemia e hipertensão
arterial [Dyslipidemia and hypertension: physiopathology]. Rev Bras Hipertens. 2007;14(4):252-7.
22. Azevedo ECC, Dias FMRS, Cabral PC, Diniz AS. Consumo alimentar de risco e proteção para as doenças crônicas não transmissíveis e sua associação com a gordura corporal: um estudo com funcionários da área de saúde de uma universidade pública de Recife (PE), Brasil [Risk and protection food consumption factors for chronic non-communicable diseases and their association with body fat: a study of employees in the health area of a public university in Recife in the state of Pernambuco, Brazil]. Ciênc Saúde Coletiva. 2014;19(5):1613-22.
23. Azevedo ECC, Monteiro JS, Cabral PC, Diniz AS. Padrão alimentar de risco para as doenças crônicas não transmissíveis e sua associação com a gordura corporal – uma revisão sistemática [Dietary risk patterns for non-communicable chronic diseases and their association with body fat – a systematic review]. Ciênc Saúde Coletiva. 2014;19(5):1447-58.
24. Malta DC, Campos MO, Oliveira MM, et al. Prevalência de fatores de risco e proteção para doenças crônicas não transmissíveis em adultos residentes em capitais brasileiras, 2013 [Noncommunicable chronic disease risk and protective factor prevalence among adults in Brazilian state capital cities, 2013]. Epidemiol Serv Saúde. 2015;24(3):373-87.
25. Velásquez-Meléndez G, Pessoa MC, Mendes LL, et al. Tendências da frequência do consumo de feijão por meio de inquérito telefônico nas capitais brasileiras, 2006 a 2009 [Trends in frequency of consumption of beans assessed by means of a telephone survey in Brazilian state capitals between 2006 and 2009]. Ciênc Saúde Coletiva. 2012;17(12):3363-70.
26. Sichieri R, Castro JFG, Moura AS. Fatores associados ao padrão de consumo alimentar da população brasileira urbana [Factors associated with dietary patterns in the urban Brazilian population]. Cad Saúde Pública. 2003;19(supl 1):S47-S53.
27. Vitoi NC, Ribeiro AQ, Franceschini SCC, Nascimento CM, Fogal AS. Prevalência e fatores associados ao diabetes em idosos no município de Viçosa, Minas Gerais [Prevalence and associated factors of diabetes in the elderly population in Viçosa, Minas Gerais, Brazil]. Rev Bras Epidemiol. 2015;18(4):953-65.
28. Lyra R, Silva RS, Montenegro Júnior RM, et al. Prevalência de diabetes melito e fatores associados em população urbana adulta de baixa escolaridade e renda do sertão nordestino brasileiro [Prevalence of diabetes and associated factors in an urban adult population of low educational level and income from the Brazilian Northeast wilderness]. Arq Bras Endocrinol Metab. 2010;54(6):560-6.
29. Metzger MH, Goldberg M, Chastang JF, Leclerc A, Zins M. Factors associated with self-reporting of chronic health problems in the French GAZEL cohort. J Clin Epidemiol. 2002;55(1):48-59.
31. Muraro AP, Santos DF, Rodrigues PRM, Braga JU. Fatores associados à Hipertensão Arterial Sistêmica autorreferida segundo VIGITEL nas 26 capitais brasileiras e no Distrito Federal em 2008 [Factors associated with self-reported systemic arterial hypertension according to VIGITEL in 26 Brazilian capitals and the Federal District in 2008]. Ciênc Saúde Coletiva. 2013;18(5):1387-98.
32. Monteiro CA, Moura EC, Jaime PC, Claro RM. Validade de indicadores do consumo de alimentos e bebidas obtidos por inquérito telefônico [Validity of food and beverage intake data obtained by telephone survey]. Rev Saúde Pública. 2008;42(4):582-9.
33. Francisco PMSB, Barros MBA, Segri NJ, Alves MCGP. Comparação de estimativas de inquéritos de base populacional [Comparison of estimates of population-based surveys]. Rev Saúde Pública. 2013;47(1):60-8.
Sources of funding: None
Conlicts of interest: None
Date of irst submission: February 9, 2017
Last received: May 24, 2017
Accepted: May 25, 2017
Address for correspondence:
Ana Paula Leite Moreira
Universidade Federal da Paraíba (UFPB) Cidade Universitária, s/no
Castelo Branco — João Pessoa (PB) — Brasil CEP 58051-900
Cel. (+55 83) 99993-7370