Trends in mortality from ill-deined causes among
the elderly in Brazil, 1979-2013: ecological study
Tendências de mortalidade por causas mal deinidas em idosos no Brasil,
1979-2013: estudo ecológico
Davi Félix Martins Junior
I, Ridalva Dias Martins Felzemburg
II, Acácia Batista Dias
III, Tania Maria Costa
IV,
Pedro Nascimento Prates Santos
IUniversidade Estadual de Feira de Santana (UEFS), Feira de Santana, and Universidade Federal da Bahia (UFBA), Salvador, BA, Brazil
ABSTRACT
CONTEXT AND OBJECTIVE: Mortality measurements are traditionally used as health indicators and are useful in describing a population’s health situation through reporting injuries that lead to death. The aim here was to analyze the temporal trend of proportional mortality from ill-deined causes (IDCs) among the elderly in Brazil from 1979 to 2013.
DESIGN AND SETTING: Ecological study using data from the Mortality Information System of the Brazilian Ministry of Health.
METHODS: The proportional mortality from IDCs among the elderly was calculated for each year of the study series (1979 to 2013) in Brazil, and the data were disaggregated according to sex and to the ive geo-graphical regions and states. To analyze time trends, simple linear regression coeicients were calculated.
RESULTS: During the study period, there were 2,646,194 deaths from IDCs among the elderly, with a de-creasing trend (ß -0.545; conidence interval, CI: -0.616 to -0.475; P < 0.000) for both males and females. This reduction was also observed in the macroregions and states, except for Amapá. The states in the northeastern region reported an average reduction of 80%.
CONCLUSIONS: Mortality from IDCs among the elderly has decreased continuously since 1985, but at diferent rates among the diferent regions and states. Actions aimed at improving data records on death certiicates need to be strengthened in order to continue the trend observed.
RESUMO
CONTEXTO E OBJETIVO: Medidas de mortalidade são tradicionalmente usadas como indicadores de saú-de e são úteis na saú-descrição da situação saú-de saúsaú-de saú-de uma população relatando lesões que levam à morte. O objetivo foi analisar a tendência temporal da mortalidade proporcional por causas mal deinidas (CMD) em idosos no Brasil entre 1979 e 2013.
DESENHO E LOCAL: Estudo ecológico utilizando dados do Sistema de Informação de Mortalidade do Ministério da Saúde no Brasil.
MÉTODOS: A mortalidade proporcional por CMD em idosos foi calculada para cada ano da série estu-dada (1979 a 2013) no Brasil, e os dados foram desagregados por sexo e de acordo com as cinco regiões geográicas e estados. Foi empregado o coeiciente de regressão linear simples para analisar a tendência temporal.
RESULTADOS: Durante o período de estudo, houve 2.646.194 mortes por CMD em idosos, com uma ten-dência decrescente (ß -0,545; intervalo de coniança, IC: -0,616 a -0,475; P < 0,000) em homens e mulheres. Essa redução também foi observada nas macrorregiões e estados, com exceção do Amapá. Os estados da região Nordeste registraram uma redução média de 80%.
CONCLUSÕES: A mortalidade por causas mal deinidas em idosos tem diminuído continuamente des-de 1985 em ritmos distintos entre as regiões e estados. As ações destinadas a melhorar os registros de dados em certiicados de óbito devem ser fortalecidas para dar continuidade na tendência observada.
IMD. Assistant Professor, Department of Health,
Universidade Estadual de Feira de Santana (UEFS), Feira de Santana, BA, Brazil.
IIPhD. Adjunct Professor, Nursing School,
Universidade Federal da Bahia (UFBA), Salvador, BA, Brazil.
IIIPhD. Adjunct Professor, Department of
Humanities and Philosophy, Universidade Estadual de Feira de Santana (UEFS), Feira de Santana, BA, Brazil.
IVMD. Adjunct Professor, Department of
Health, Universidade Estadual de Feira de Santana (UEFS), Feira de Santana, BA, Brazil.
KEY WORDS:
Death certiicates. Mortality. Cause of death. Aged.
Information systems.
PALAVRAS-CHAVE:
Atestado de óbito. Mortalidade. Causa de morte. Idoso.
INTRODUCTION
Mortality measurements are traditionally used as health indi-cators1 and are useful in describing a population’s health
situ-ation through reporting injuries that lead to death. his allows authorities, among other things, to prioritize the allocation of resources in accordance with the mortality proile identiied.2
Mortality indicators assist in monitoring the trends of the most prevalent causes of death in a population and hence identify which segments are afected to a greater or lesser extent by cer-tain diseases. he numerators of these indicators are obcer-tained from the Mortality Information System (SIM) of the Ministry of Health, which also functions as a strategic tool for management of the healthcare system.3
Mortality statistics are only infrequently used. his is partly because of lack of completeness of the data ields that comprise death certiicates (DCs), particularly the ield representing the underlying cause of death. he lack of information in this ield limits the explanatory power of death records regarding mortal-ity patterns in a population.
In situations in which it is not possible to identify the under-lying cause of death, such as lack of medical care, failure of doc-tors to properly maintain assignations and records or missing information, the cause of death is classiied as an ill-deined cause (IDC). hese correspond to the codes of Chapter XVIII (symp-toms, signs and abnormal clinical and laboratory indings not elsewhere classiied; codes R00-R99) of the 10th Revision of the
International Classiication of Diseases (ICD-10), and Chapter XVI (symptoms, signs and ill-deined conditions; codes 780-799) of the 9th Revision (ICD-9).
High proportions of reported deaths classiied as ill-deined causes can signiicantly alter the mortality rates for speciic dis-eases. his can distort a given community mortality proile and consequently reduce the potential use of these statistics for diag-nosing the health of a given population and for planning and administering healthcare services for that population.4
By international standards, Brazil was characterized as hav-ing high levels of ill-deined causes of death in the middle 1990s.5
Over the last three decades, the Brazilian government has made signiicant investments that have improved vital registration systems over recent years.6,7 he completeness of death counts
increased from 80% in 1980-1991 to 95% in 2000-2010, while at the same time the percentage of ill-deined causes of deaths was reduced by about 53% in the country, but with large regional dif-ferences. he south and southeast have much better data quality than the rest of the country.8
he distribution of ill-deined causes according to demo-graphic characteristics, such as gender and age, is marked by higher incidence among men and the elderly (elderly is deined here as 60 years of age or older). Among the elderly, it is
particularly diicult to identify the cause of death9 because of the
presence of comorbidities (hypertension, diabetes, cancer, arte-riosclerosis, dyspnea upon exertion, osteoarthritis and reduced visual acuity, among others) that frequently occur among the elderly. Moreover, age can inluence the clinical expression of signs and symptoms,10 and it may be diicult to deal with the
elderly, who may refuse to seek treatment and only do so in the later stages of the disease when there is greater impairment, which can hinder or even prevent establishment of diagnoses. herefore, it is essential to monitor the quality of the information relating to the underlying cause of death among the elderly and the information relating to the demand for healthcare and social services, so as to better develop care planning and health promo-tion in this age group.11
Mortality trends can be identiied from mortality rates in which the risk of death due to a speciic cause is measured; or through proportional mortality, in which the relative impor-tance of a disease or group of diseases is reported. In this study, we chose to work with proportional mortality to assess the weight of ill-deined causes of death among the elderly.
OBJECTIVE
he objective of this study was to analyze the evolution of propor-tional mortality as a result of ill-deined causes of death among the elderly in Brazil during the period 1979-2013.
METHODS
his ecological study used time series and exploratory analyses2
in which secondary data were used. All deaths registered as ill-deined causes among the elderly (detailed in Chapter XVI of ICD-9, for the period between 1979 and 1995; and in Chapter XVIII of ICD-10 from 1996 onwards) were included in this study. his system was implemented between 1975 and 1976, and the computerized database became available for viewing/capture on the web pages of the Information Technology Department of the Brazilian National Health System (DATASUS), with data from 1979 on.12
his study used data in the public domain. hus, there was no need for approval from a research ethics committee. Two spa-tial scales were used for data analysis: Brazil and its macroregions (north, northeast, south, southeast and center-west). he propor-tional mortality due to IDCs among the elderly was calculated for each year of the study series (1979 to 2013) in Brazil, and the data were disaggregated according to sex and to the ive geographical regions. he proportion of IDC deaths for each sex was calcu-lated based on the total number of deaths for each sex.
In this analysis, the variable of time, expressed in years, was entered into the model as the independent variable, and the vari-able proportions of deaths from IDCs, overall and separated according to gender and geographical region, functioned as the dependent variables. To perform the data analysis, we used Tabwin,13 which is a public-domain spreadsheet provided by
DATASUS, Ministry of Health; and the R sotware, which is a public-domain statistical package.
RESULTS
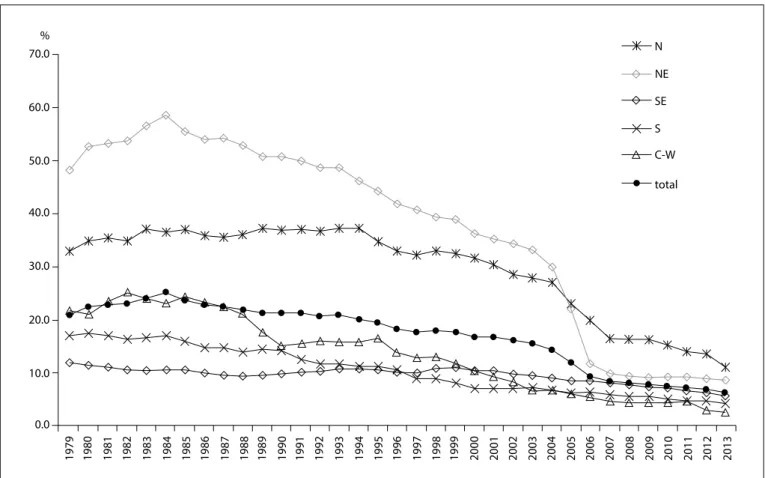
During the study period, there were 2,646,194 deaths from ill-deined causes among the elderly, corresponding to an aver-age of 75,606 deaths/year. he highest frequency of these deaths (883,162 deaths) occurred in the 1990s, accounting for 33.4% of the total number of deaths. Sex was not reported on 2,943 (0.11%) of the death certiicates. here was a signiicant drop in the pro-portion of ill-deined causes of death among the elderly for Brazil overall, decreasing from 20.7% in 1979 to 6.2% in 2013 (Figure 1). he highest proportion (25.2%) was recorded in 1984: the under-lying cause of death for a quarter of the elderly people who died in
1984 was not identiied. In 2005, more than 10.0% of deaths among the elderly were from an unknown underlying cause.
he temporal trend of the proportional mortality from IDCs among the elderly decreased both for Brazil overall (ß: -0.545; conidence interval, CI: -0.616 to -0.475; P < 0.000) and for the macroregions. In the northeastern region, the proportional mor-tality from IDCs decreased from 48.1% in 1979 to 8.5% in 2013 (ß: -1.584; CI: -1.802 to -1.367; P < 0.000); in the central-west-ern region, the proportional mortality from IDCs decreased from 21.7 to 2.6% (ß: -0.708; CI: -0.767 to -0.650; P < 0.000); in the northern region, the proportional mortality from IDCs decreased from 33.0 to 11.1% (ß: -0.725; CI: -0.874 to -0.576; P < 0.000); in the southeastern region, the proportional mortal-ity from IDCs decreased from 11.9 to 5.7% (ß: -0.123; CI: -0.154 to -0.092; P < 0.000); and in the southern region, the propor-tional mortality from IDCs decreased from 17.1% in 1979 to 4.2% in 2013 (ß: -0.427; CI: -0.452 to -0.402; P < 0.000).
In the northeastern region, between the years 1980 and 1990, more than 50.0% of deaths among the elderly were classiied as IDC, reaching a peak of 58.5% in 1984; this proportion was
70.0 N
NE SE S C-W total 60.0
50.0
40.0
30.0
20.0
10.0
0.0
1979 1980 1981 1982 1983 1984 1985 1986 1987 1988 1989 1990 1991 1992 1993 1994 1995 1996 1997 1998 1999 2000 2001 2002 2003 2004 2005 2006 2007 2008 2009 2010 2011 2012 2013
%
N = northern region; NE = northeastern region; SE = southeastern region; S = southern region; C-W = central-western region.
5.6 times higher than that in the southeast (10.5%) in 1984. Since 1997, IDC deaths have accounted for less than 10.0% of the total number of deaths among the elderly in the south; this occurred ten years later in the northeast (in 2007).
In 2004, the northeastern region recorded the highest pro-portion of deaths from IDCs. In 2005, the highest propro-portion of deaths occurred in the northern region. his region was the only one to record a proportion greater than 10.0% in the last year of the study: in 2013, the proportion of deaths from IDCs among the elderly in the northern region was 11.1%, while the national average was 6.2%.
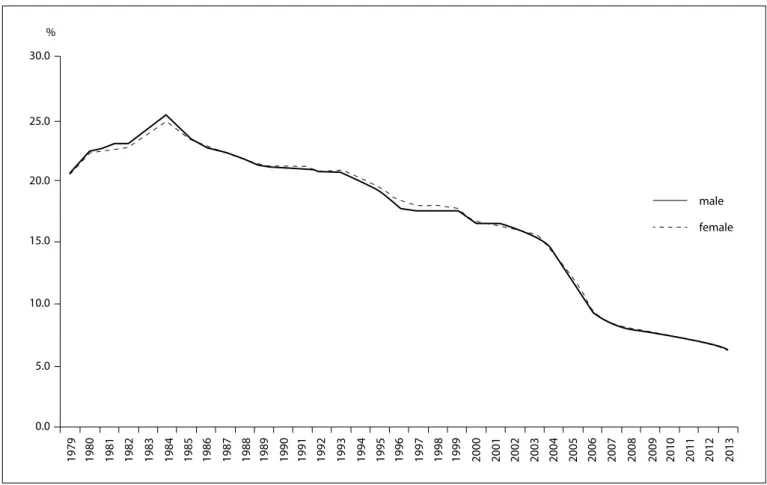
he distribution according to sex showed similar patterns for men and women. he proportion of IDCs increased from 1979 until 1984, when it reached a peak of 25% for both sexes, followed by a decreasing trend extending until the last year of the study, when it reached 6.2%. he trend showed a decrease for both males (ß: -0.549; CI: -0.618 to -0.479; P < 0.000) and females (ß: -0.540; CI: -0.613 to -0.467; P < 0.000). Since 2006, the propor-tion of deaths due to IDCs among the elderly has remained below 10.0% in both sexes (Figure 2).
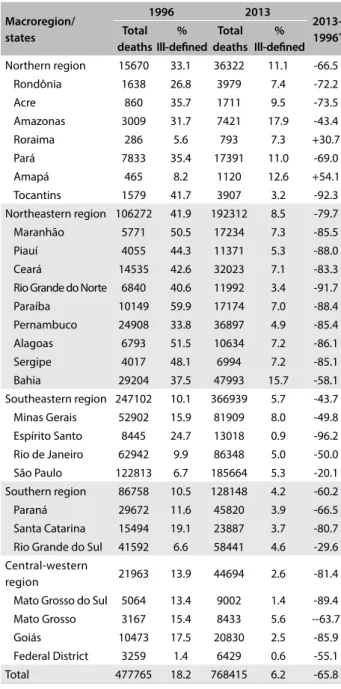
Table 1 shows that in two states, Roraima and Amapá, which are both located in the north, there was an increase in the
proportion of deaths from IDCs among the elderly between the years 1996 (when ICD-10 started to be used) and the latest year for which mortality data were available on the DATASUS web-site. here were reductions in all the other states, particularly in the states of Tocantins in the northern region, Rio Grande do Norte in the northeastern region and Espírito Santo in the south-eastern region, which had reductions of more than 90%. In 2013, only four states had rates that exceeded 10% (Amazonas, Pará and Amapá in the north and Bahia in the northeastern region).
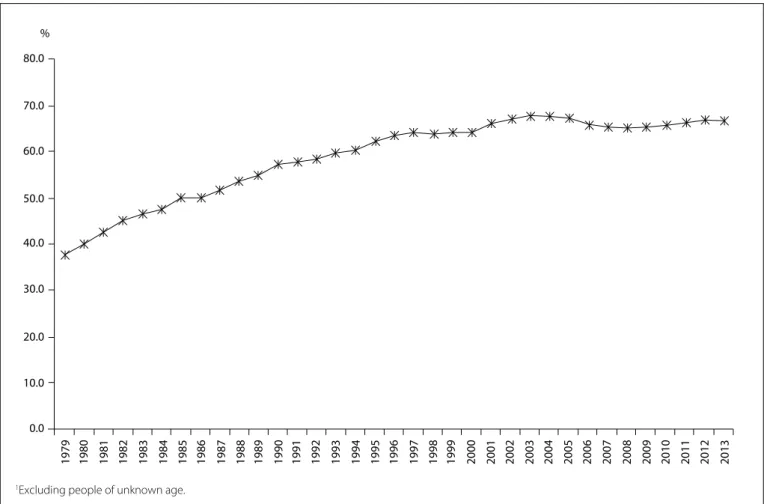
he proportion of deaths from ill-deined causes among the elderly, within the total number of IDC deaths registered in Brazil during the period 1979-2013, displayed an upward trend with minor luctuations, increasing from 37.8% in 1979 to 64.0% in 1997 and reaching 66.6% in 2013 (Figure 3).
DISCUSSION
he time series analysis on the proportional mortality from ill-deined causes among the elderly revealed a marked and pro-gressive decrease during the study period. his reduction was observed for the country as a whole, with regional variations that were accentuated in the north-south direction, ranging from a reduction of approximately 95.5% in the state of Espírito Santo,
Figure 2. Proportion of deaths from ill-deined causes among the elderly according to sex, Brazil, 1979-2013.
30.0
25.0
20.0
15.0
10.0
5.0
0.0
1979 1980 1981 1982 1983 1984 1985 1986 1987 1988 1989 1990 1991 1992 1993 1994 1995 1996 1997 1998 1999 2000 2001 2002 2003 2004 2005 2006 2007 2008 2009
male female
2010 2011 2012 2013
which is located in the southeastern region, to an increase of 147.8% in Amapá in the northern region. he largest decreases were observed in the states of the northeastern region, which reported an average decrease of more than 80.0%, except for the state of Bahia (60.4%).
he geographic variation in this indicator can be partially attributed to the diferent levels of economic development pre-sented by the federal states, the care structure provided for the
population, the structure and organization of health information record systems, the ease of access to healthcare services and the efects from improving qualiication-oriented programs.
A study conducted in the state of São Paulo that evaluated health information14 identiied signiicant regional health
varia-tions in relation to ill-deined causes of death among the elderly. he proportional mortality from ill-deined causes of death for the state in 2010 was 5.6%, ranging from 1.0% in the greater ABC region to 19.4% in the central DRS II region. he signii-cant regional health diferences observed in the state of São Paulo relect deep inequalities in living conditions, which are closely related to social and economic factors and have a major inluence on the quality of vital statistics records.15
Although occurrences of IDCs among the elderly have dis-played a signiicant reduction, they remain high compared with other countries. In the period between 2002 and 2006, IDC deaths in the general population accounted for 1.5% of deaths in Colombia.16 In the United States, IDCs in the general
population accounted for less than 2.0% of all deaths,17 and in
2003 in Chile, the percentage of deaths recorded under this clas-siication was 2.8%.18 he pattern observed in these countries
dif-fers greatly from that found in South Africa, where the propor-tion of ill-deined causes of death increased from 12.2% in 1999 to 13.9% in 2007.19
Keer-Pontes and Rouquayrol20 stated that deaths from
ill-deined causes relect “not only worse quality of life and health of the population, but also lower quality or lack of medical care provided to that population”. hey also reported that in cases in which the deaths received a clinical follow-up in the inal stages of the disease, poor completion of the DC was partly related to diagnostic errors as a result of lack of technical resources or per-sonnel deiciencies, ignorance of the correct way to complete a DC, bureaucratic issues and attention to family prejudices against stigmatizing diseases (syphilis, AIDS and alcoholism).
Investigations that have assessed the quality of DC data show that the vast majority of deaths categorized as from ill-deined causes result from doctors incorrectly completing the DC.9
Adequately diagnosed cases are reported using terms that are vague or poorly deined, such as “cardiac arrest” and “multiple organ failure”, which under coding rules are classiied in Chapter XVIII of ICD-10.9
Since 2005, the Brazilian government has focused on help-ing states and municipalities from the poorest regions (north and northeast) through targeting increased completeness and reduction of ill-deined causes of death. his efort produced an important decrease in the proportion of ill-deined causes from all regions over time, especially in 2006‐2010, with improve-ments in terms of both magnitude and reduction of diferentials across regions.21 Macroregion/ states 1996 2013 2013-1996* Total deaths % Ill-deined Total deaths % Ill-deined
Northern region 15670 33.1 36322 11.1 -66.5 Rondônia 1638 26.8 3979 7.4 -72.2 Acre 860 35.7 1711 9.5 -73.5 Amazonas 3009 31.7 7421 17.9 -43.4 Roraima 286 5.6 793 7.3 +30.7 Pará 7833 35.4 17391 11.0 -69.0 Amapá 465 8.2 1120 12.6 +54.1 Tocantins 1579 41.7 3907 3.2 -92.3 Northeastern region 106272 41.9 192312 8.5 -79.7 Maranhão 5771 50.5 17234 7.3 -85.5 Piauí 4055 44.3 11371 5.3 -88.0 Ceará 14535 42.6 32023 7.1 -83.3 Rio Grande do Norte 6840 40.6 11992 3.4 -91.7 Paraíba 10149 59.9 17174 7.0 -88.4 Pernambuco 24908 33.8 36897 4.9 -85.4 Alagoas 6793 51.5 10634 7.2 -86.1 Sergipe 4017 48.1 6994 7.2 -85.1 Bahia 29204 37.5 47993 15.7 -58.1 Southeastern region 247102 10.1 366939 5.7 -43.7 Minas Gerais 52902 15.9 81909 8.0 -49.8 Espírito Santo 8445 24.7 13018 0.9 -96.2 Rio de Janeiro 62942 9.9 86348 5.0 -50.0 São Paulo 122813 6.7 185664 5.3 -20.1 Southern region 86758 10.5 128148 4.2 -60.2 Paraná 29672 11.6 45820 3.9 -66.5 Santa Catarina 15494 19.1 23887 3.7 -80.7 Rio Grande do Sul 41592 6.6 58441 4.6 -29.6 Central-western
region 21963 13.9 44694 2.6 -81.4 Mato Grosso do Sul 5064 13.4 9002 1.4 -89.4 Mato Grosso 3167 15.4 8433 5.6 --63.7 Goiás 10473 17.5 20830 2.5 -85.9 Federal District 3259 1.4 6429 0.6 -55.1 Total 477765 18.2 768415 6.2 -65.8
Table 1. Proportional mortality from ill-deined causes among the elderly according to macroregions and states in selected years (1996 and 2013)
Source: Mortality Information System (SIM), Health Situation Analysis Department, Health Surveillance Secretariat, Ministry of Health.
*Percentage change 2013-1996 {(t
he downward trend in the proportion of this type of death is widespread, but we believe that peculiarities are maintained in some age groups such as the elderly. he high occurrence of home deaths in this age group9 also increases the chance of the
death being classiied as having an ill-deined cause. A study conducted in four state capitals that assessed mortality from ill-deined causes among the elderly from 1996 to 2007 found that in Porto Alegre, 50% of deaths classiied as IDCs occurred at home.22 In the state of São Paulo in 2010, 48.2% of these events
occurred at home, and only 44.2% occurred in hospitals or other healthcare facilities. Moreover, unattended deaths, which are one of the most common situations for ill-deined causes of death, represented 31% of all ill-deined causes of death. hese deaths occur predominantly at home (42.6%).14
Moreover, the classiication of deaths did not difer according to sex. he downward trend in both sexes suggests that the factors that caused this reduction produced the same efects in both sexes.
he high proportions of IDC deaths observed in the 1980s may relect a time when the need for services and healthcare pro-fessionals to assist the population was greatest. his need resulted
from uneven spatial distribution of healthcare services and pro-fessionals in Brazil, which were primarily located in the southern and southeastern regions and in major urban centers.
he above mentioned problems added to the diiculty of the population’s access to healthcare services and the organization of health surveillance services.23 he disabilities of the
organi-zation of health surveillance services depicts a situation of seri-ous neglect of a problem regarding information that was more marked that decade, thus relecting a failure to comply with the mandatory registration of vital events, and speciically deaths, and the lack of importance given to this by those in charge of planning healthcare actions.
he household living situations of the elderly, whether in rural or urban areas, may explain the resistance to or greater dif-iculty in health service provision. he predominantly rural loca-tion pattern probably afects the demand for healthcare because rural populations have less access to and therefore make less use of healthcare services.24,25 his may result partly from
transpor-tation diiculties, inancial constraints and greater resistance to seeking medical care.
Figure 3. Proportion of deaths from ill-deined causes among the elderly in relation to the total number of deaths registered as having
ill-deined causes,1 Brazil, 1979-2013.
80.0
70.0
60.0
50.0
40.0
30.0
20.0
10.0
0.0
1979 1980 1981 1982 1983 1984 1985 1986 1987 1988 1989 1990 1991 1992 1993 1994 1995 1996 1997 1998 1999 2000 2001 2002 2003 2004 2005 2006 2007 2008 2009 2010 2011 2012 2013
%
We believe that seeking medical care was a more important issue in the mid-1980s. A signiicant proportion of the population over 60 years of age during that decade came from a cohort that was primarily born in rural areas, and a fraction of that popula-tion is still alive today. Brazil was historically a country with pre-dominantly rural characteristics, but since the 1950s, Brazil has been undergoing a transformation into a more urbanized coun-try. Only in the 1960s did the urban population exceed the rural population.26 he low frequency of healthcare services use among
people living in rural areas throughout their lives is a behavioral characteristic that may change as these people become older, given that the demand for healthcare services can be expected to increase. his increase in the frequency of healthcare services use among the elderly has been previously demonstrated. his stage of life is characterized by a greater biological vulnerability associ-ated with higher prevalence of diseases and disabilities.27
he cohorts born in the 1930s and subsequently difered from those that preceded them in relation to household status at birth. Some of those who were born in the countryside migrated into cities, and this pattern became more pronounced in the 1950s and 1960s, and extended into the early 1990s. According to the Brazilian Institute for Geography and Statistics (IBGE) (2001),26
the proportion of the population living in urban areas increased from 67.5% in 1980 to 75.5% in 1991 and 81.2% in 2000, partly because of the intense rural-urban migration process.
his population has had more experience with urban stan-dards in relation to healthcare and seeking treatment. his new social integration has resulted in increased demand for health-care and has coincided with a period of intensifying public cam-paigns addressing various healthcare service issues, such as the Elderly Vaccination Campaign, in which people aged 65 year and older were immunized against inluenza, beginning in 1999. In 2000, the campaign began ofering immunization to those over 60 years old. Campaigns towards the elderly may have con-tributed towards encouraging them to seek healthcare services, thus reducing the culturally constructed resistance.
he availability of healthcare services and professionals pre-pared to meet the needs of this contingent, which swells the popu-lation, is a challenge for both the state and society. Populations have the ability to extend their average lifespan and therefore age is an indicator of social evolution, which is inluenced by the pattern of economic development and the technical/scientiic attainment level of the society to which the population belongs. Such achievements are a source of concern for both society and the state, which need to adjust to new demands, and they have an impact on the economic and social structure. he challenge ahead for the twenty-irst cen-tury is to provide quality-of-life support to a growing elderly popula-tion of primarily low socioeconomic and educapopula-tional level and high prevalence of chronic diseases and disabilities.28,29
Apart from these unwieldy problems, the reduction in the proportion of ill-deined causes of death points towards the pos-sibility of achieving an even lower level if the ongoing actions are intensiied. he Brazilian states with the worst indicators need to be prioritized, so as to identify the main causes of the poor qual-ity of information and implement a series of actions to reverse this situation. Among the measures that could help reduce occur-rences of deaths categorized as having ill-deined causes is con-tinuous monitoring of what is causing death in this age group, with training and skill transfers for municipalities with greater diiculties, with the aim of reaching physicians in these regions and encouraging them to ill out the underlying cause of death on the death certiicate.
his study was based on large spatial units, including macrore-gions and states, for the data analysis. Although this allowed approx-imation of occurrences and the spatial distribution of the event ana-lyzed, the spatial unit size can be considered to be a limitation of this study. Use of smaller spatial units, such as regional health districts or even municipalities, would provide knowledge in greater detail, including identiication of the localities with major problems in clas-sifying deaths, and would allow interventions to be targeted to the most deprived locations.
CONCLUSIONS
Proportional mortality from ill-deined causes among the elderly was seen to present a marked progressive decrease during the study period. his reduction was observed for the country as a whole, with regional variations accentuated in the north-south direc-tion. hese variations require geographically diferentiated inter-ventions in order to reduce their occurrence. hus, improving the quality of mortality statistics among the elderly is essential in order to provide valid and reliable data for producing information to support healthcare planning for this group of elderly individuals.
REFERENCES
1. Vermelho LL, Costa AJL, Kale PL. Indicadores de saúde. In: Medronho RA, Bloch KV, Luiz RR, Werneck GL, editors. Epidemiologia. 2a ed.
São Paulo: Editora Atheneu; 2009. p. 31-82.
2. Medronho RA. Estudos ecológicos. In: Medronho RA, Bloch KV, Luiz RR, Werneck GL, editors. Epidemiologia. 2a ed. São Paulo: Editora
Atheneu; 2009. p. 265-74.
3. Cavalini LT, Ponce de Leon ACM. Correção de sub-registros de óbitos e proporção de internações por causas mal deinidas [Correction approach for underreporting of deaths and hospital admissions due to ill-deined causes]. Rev Saúde Pública. 2007;41(1):85-93.
5. Mathers CD, Fat DM, Inoue M, Rao C, Lopez AD. Counting the dead and what they died from: an assessment of the global status of cause of death data. Bull World Health Organ. 2005;83(3):171-7.
6. Brasil. Ministério da Saúde. Secretaria de Vigilância em Saúde. SIM e SINASC. In: Brasil. Ministério da Saúde. Secretaria de Vigilância em Saúde. 2a EXPOEPI Mostra Nacional de Experiências Bem-sucedidas em
Epidemiologia, Prevenção e Controle de Doenças. Brasília: Ministério da Saúde; 2003. p. 31-6. Available from: http://bvsms.saude.gov.br/bvs/ publicacoes/RELATORIO_II_EXPOEPI.pdf. Accessed in 2016 (Jul 5). 7. Brasil. Ministério da Saúde. Secretaria da Vigilância em Saúde.
Monitoramento da acurácia dos Sistemas de Informações sobre Mortalidade e Nascidos Vivos. In: Brasil. Ministério da Saúde. Secretaria de Vigilância em Saúde. 3a EXPOEPI Mostra Nacional de Experiências
Bem-sucedidas em Epidemiologia, Prevenção e Controle de Doenças. Brasília: Ministério da Saúde; 2004. p. 173-80. Available from: http:// bvsms.saude.gov.br/bvs/publicacoes/anais_3expoepi.pdf. Accessed in 2016 (Jul 5).
8. Lima EEC, Queiroz BL. A evolução do sistema de registro de mortalidade no Brasil: mudanças no peril de mortalidade, cobertura do registro de óbitos e as causas mal deinidas de morte. [Evolution of the deaths registry system in Brazil: associations with changes in the mortality proile, under-registration of death counts, and ill-deined causes of death]. Cad Saúde Pública. 2014;30(8):1721-30. 9. Mello Jorge MHP, Laurenti R, Lima-Costa MF, Gotlieb SLD, Chiavegatto
Filho ADP. A mortalidade de idosos no Brasil: a questão das causas mal deinidas [Brazilian mortality of elderly persons: the question about ill-deined underlying causes of death]. Epidemiol Serv Saúde. 2008;17(4):271-81.
10. Battle RM, Pathak D, Humble CG, et al. Factors inluencing discrepancies between premortem and postmortem diagnoses. JAMA. 1987;258(3):339-44.
11. Lima e Costa MFF, Guerra HL, Barreto SM, Guimarães RM. Diagnóstico da situação de saúde da população idosa brasileira: um estudo da mortalidade e das internações hospitalares públicas [Diagnosis of the health condition of the elderly population in Brazil: a study of mortality and admission in public hospitals]. Inf Epidemiol SUS. 2000;9(1):23-41.
12. Laurenti R, Jorge MHPM, Gotlieb SLD. A coniabilidade dos dados de mortalidade e morbidade por doenças crônicas não-transmissíveis [The accuracy of the oicial mortality and morbidity statistics related to chronic non-communicable diseases]. Ciênc Saúde Coletiva. 2004;9(4):909-20.
13. Brasil. Ministério da Saúde. Datasus. Ferramentas de Tabulação. TABWIN. Available from: http://www2.datasus.gov.br/DATASUS/ index.php?area=060805. Accessed in 2016 (Jul 5).
14. Mendes JDV. Mortalidade Proporcional por Causas Mal Deinidas nas Regiões do Estado de São Paulo. Gais Informa. 2012;4(12):1-9. Available from: http://portal.saude.sp.gov.br/resources/ses/peril/
proissional-da-saude/destaques//gais_jornal_12.pdf. Accessed in 2016 (Jul 5).
15. Paes NA. Avaliação da cobertura dos registros de óbitos dos estados brasileiros em 2000. [Assessment of completeness of death reporting in Brazilian states for the year 2000]. Rev Saúde Pública. 2005;39(6):882-90.
16. Cendales R, Pardo C. La calidad de certiicación de la mortalidad en Colombia, 2006 [Colombian death certiicate quality, 2002-2006]. Rev Salud Pública. 2011;13(2):229-38.
17. Murphy SL, Xu J, Kochanek KD. Deaths: Preliminary Data for 2010. National Vital Statistics Reports. 2012;60(4):1-51. Available from: http://www.cdc. gov/nchs/data/nvsr/nvsr60/nvsr60_04.pdf. Accessed in 2016 (Jul 5). 18. Núñez FML, Icaza NMG. Calidad de las estadísticas de mortalidad en
Chile, 1997-2003 [Quality of Mortality statistics in Chile, 1997-2003]. Rev Méd Chile. 2006;134(9):1191-6.
19. Joubert J, Rao C, Bradshaw D, Vos T, Lopez AD. Evaluating the quality of national mortality statistics from civil registration in South Africa, 1997-2007. PLoS One. 2013;8(5):e64592.
20. Kerr-Pontes, LRS, Rouquayrol MZ. Medidas da saúde coletiva. In: Rouquayrol MZ, Almeida Filho N, orgs. Epidemiologia e Saúde. 5a ed.
Rio de Janeiro: Medsi; 1999. p. 63-5.
21. Vasconcelos AMN, França E. Measuring adult mortality in Brazil: improving quality of cause of death data. In: Meeting on Adult Mortality and Morbidity, 2012, Louvain-la-Neuve. Adult Mortality and Morbidity. Neuve: Université Catholique de Louvain-la-Neuve, 2012. Available from: https://www.uclouvain.be/cps/ucl/doc/ demo/documents/Vasconcelos.pdf. Accessed in: 2016 (Jul 5). 22. Abreu DMX, Sakurai E, Campos LN. A evolução da mortalidade
por causas mal deinidas na população idosa em quatro capitais brasileiras, 1996-2007 [The evolution of mortality from ill-deined causes among the elderly population in four major Brazilian cities, 1996-2007]. Rev Bras Estud Popul. 2010;27(1):75-88.
23. Duarte EC, Schneider MC, Paes-Souza R, et al. Epidemiologia das desigualdades em saúde no Brasil: um estudo exploratório. Brasília: Organização Pan-Americana da Saúde; 2002. Available from: http://repositorio.unb.br/bitstream/10482/12955/1/LIVRO_ EpidemologiaDesigualdades.pdf. Accessed in 2016 (Jul 5).
24. Rosenthal TC, Fox C. Access to health care for the rural elderly. JAMA. 2000;284(16):2034-6.
25. Lishner DM, Rosenblatt RA, Baldwin LM, Hart LG. Emergency department use by the rural elderly. J Emerg Med. 2000;18(3):289-97. 26. Brasil. Ministério do Planejamento, Orçamento e Gestão. Instituto
27. Travassos C, Viacava F. Acesso e uso de serviços de saúde em idosos residentes em áreas rurais, Brasil, 1998 e 2003 [Access to and use of health services by rural elderly, Brazil, 1998 and 2003]. Cad Saúde Pública. 2007;23(10):2490-502.
28. Martins JJ, Schier J, Lorenzini Erdmann A, Albuquerque GL. Políticas públicas de atenção à saúde do idoso: relexão acerca da capacitação dos proissionais da saúde para o cuidado com o idoso [Public politics for the elderly healthcare: relection on the qualiication of health professionals that care for the elderly]. Revista Brasileira de Geriatria e Gerontologia. 2007;10(3):371-82. Available from: http://www.redalyc. org/pdf/4038/403838775009.pdf. Accessed in 2016 (Jul 5).
29. Torres MM, Sá MAAS. Inclusão social de idosos: um longo caminho a percorrer [Social inclusion of the elderly: a long way to go]. Revista Ciências Humanas. 2008;1(2). Available from: http://www.rchunitau.com. br/index.php/rch/article/viewFile/203/109. Accessed in 2016 (Jul 5).
Sources of funding: None
Conlict of interest: None
Date of irst submission: March 17, 2016
Last received: May 5, 2016
Accepted: June 1, 2016
Address for correspondence:
Davi Félix Martins Junior
Universidade Estadual de Feira de Santana - Saúde Av. Transnordestina, s/no
Novo Horizonte — Feira de Santana (BA) — Brasil CEP 44036-900