ABSTRACT
SHOR
T COMMUNIC
A
exercise among chronic Chagas
cardiopathy patients
Hospital Universitário Clementino Fraga Filho, Universidade Federal do
Rio de Janeiro, Rio de Janeiro, Brazil
INTRODUCTION The change in slope of the V
. E/V
. CO2 curve with time during exercise (V
. E/V
. CO2 slope) has been recommended as a parameter for analyzing the ventilatory response during exercise among patients with heart failure of different etiologies.1
OBJECTIVE The aim of the present study was to evaluate ventilatory response among chronic Chagas cardiopathy (CCC) patients.
MATERIALS AND METHODS This study was a cross-sectional and descriptive analysis of 48 male patients with CCC (mean age: 51 ± 11 years). These pa-tients were living in Rio de Janeiro and were not taking part in any systematic physical training program. All of these patients had been clinically stable over the three-month period preceding the study. They presented positive indirect hemagglutination reac-tion and indirect immunofl uorescence for Trypanosoma cruzi, and no other associated disease. They were grouped according to the Los Andes clinical/hemodynamic classifi ca-tion,2 and the diagnosis of congestive heart failure met the criteria of the Framingham Heart Study.3
Selection of the patients for the study was performed among the 200 patients followed up in Hospital Universitário Clementino Fraga Filho, Universidade Federal do Rio de Janeiro, over the period from 1999 to 2000, and the data were analyzed in 2002. The exclusion criteria were: systemic arterial hypertension, chronic obstructive pulmonary disease, cardiomyopathy of any other type or cause, thyroid dysfunction, known immuno-logical dysfunction, rheumatic valve disease, congenital heart diseases, obstructive coronary artery disease, use of heart pacemaker,
neuro-muscular disorders, practicing of sports, and inability to reach the anaerobic threshold when undergoing the test.
The patients were grouped in two ways: fi rstly, using the Los Andes clinical/hemody-namic classifi cation2; secondly, to determine whether alterations in the functional capacity of the cardiovascular system were associated with the ventilatory response to exercise, the patients were redistributed into four groups according to their peak V
.
O2 independent of their degree of heart failure.
The exercise test was performed on a mechanically braked cycle ergometer (Mon-arch) and the patients using medications were instructed to suspend their use 48 hours prior to the test.
The exercise was begun with two minutes of warm-up (zero Watts). The workload was increased at a rate of 12.5 watts/min, with 60 rotations per minute, until the appearance of limiting symptoms. All of the patients and also a control group consisting of21 healthy male volunteers performed the same test protocol.
The reproducibility of the exercise test in our laboratory was verifi ed by means of test and retest of ten volunteers and there were no signifi cant differences (paired and simple Student’s t test, p < 0.05) between the results.
A rapid gas analyzer (Airspec MGA 2000) was utilized on a breath-by-breath basis, with a Fleisch pneumotachograph and a dif-ferential pressure transducer (Microswitch 163PC01D36). Equipment calibration was performed on a daily basis before each test.
We analyzed V
. E/V
.
CO2 (liter/min) by considering the average from the last fi ve cycles at six different times: (a) at rest; (b) when V
. CO2 reached 0.5 liter/min; (c) when V
.
CO2 reached 1.0 liter/min; (d) at the exercise peak; (e) after the fi rst minute of recovery; and (f ) after the third minute of recovery. The V
. E/V
.
CO2 slope
CONTEXT AND OBJECTIVE: The change in slope of the V
.
E/V
.
CO2 curve with time during exercise (V
.
E/V
.
CO2 slope) has been recommended as a
parameter for analyzing the ventilatory response during exercise among patients with heart failure of different etiologies. The aim of this work was to evaluate the ventilatory response among patients with chronic Chagas cardiopathy.
METHODS: Forty-eight patients, divided into four groups according to the Los Andes clinical/hemo-dynamic classifi cation, were studied. They were also classifi ed according to peak oxygen uptake (peak V
.
O2) for a second analysis. The results from
the patients were compared with results from a con-trol group consisting of 21 healthy male volunteers (no Chagas disease). Exercise was performed on a cycle ergometer with loads increasing at the rate of 12.5 watts/min, and exercise duration was symptom-limited. Gas concentration and fl ow rate data were fed into a computer, which produced a real-time report on ventilatory and gas exchange parameters (breath-by-breath). The ventilatory parameters of V
.
E/V
.
CO2 slope and V .
E/V
.
CO2 ratiocomputed at different times of the
test were adopted.
RESULTS: Although there were no signifi cant differences in V
.
E/V
.
CO2 ratio and V .
E/V
.
CO2
slope when patients were grouped using the Los Andes clinical/hemodynamic classifi cation, these parameters varied signifi cantly when peak V
.
O2
was used to defi ne patient groups.
CONCLUSION: Our results indicate that progres-sive deterioration in ventilatory response among chronic Chagas cardiopathy patients during exer-cise is more evident when the functional capacity (peak V
.
O2) is reduced, than when changes are
related to the Los Andes classifi cation.
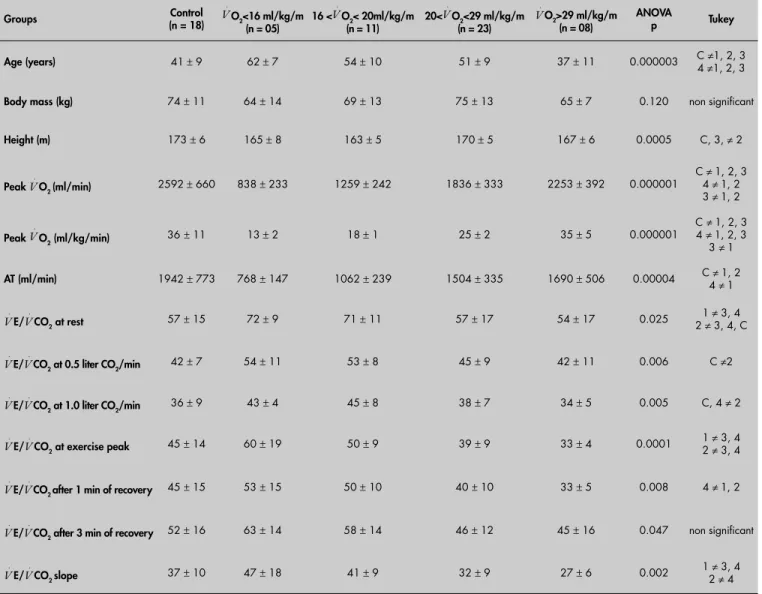
in V
. E/V
.
CO2 and V
. E/V
.
CO2 slope between some groups of patients and controls.
DISCUSSION This study demonstrated an inverse rela-tionship between the degree of heart disease in CCC and the patients’ functional capacity (peak V
.
O2 and anaerobic threshold, Table 3). Both controls and patients in the initial phase of the disease (group IA) were more tolerant of exercise than were patients in advanced stages of CCC (Table 1).
No signifi cant differences in ventilatory effi ciency could be seen between the patient during exercise period was also analyzed (li near
regression analysis).4 The results from the pa-tients were compared with the results from the 21 healthy male volunteers.
The local Ethics Committee approved this study and the patients and the control group underwent the tests only after providing writ-ten informed consent.
The statistical treatment (Pearson’s correlation coeffi cient, one-way analysis of variance, ANOVA, post-hoc Tukey, HSD) were performed using the Statistical Analysis System (SAS), considering signifi cant values of p < 0.05.
RESULTS The functional capacity of patients in the initial phase (IA) of CCC was superior to that of patients in an advanced phase (group III) (Table 1, Figure 1). There was great vari-ability in the peak V
.
O2 in CCC (Table 2), and V
. E/V
.
CO2 and V
. E/V
.
CO2 slope had sig-nifi cant negative but weak correlations with peak V
.
O2 and ventilatory anaerobic threshold (Table 3). V
. E/V
.
CO2 exhibited a tendency to decrease with effort and to return to resting values after three minutes of recovery. When patients were grouped according to peak V
. O2 (Table 4), there were signifi cant differences
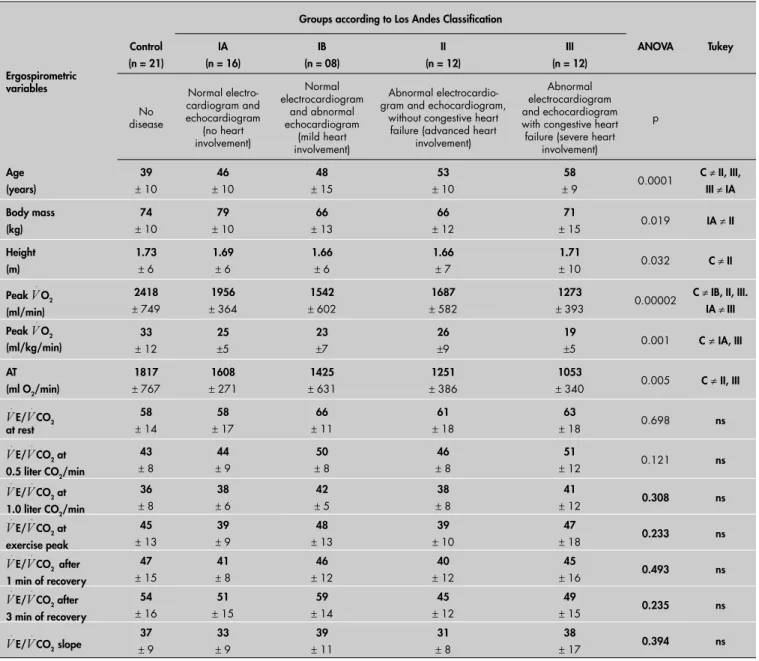
Table 1.Mean results (mean ± standard deviation) for all variables measured in Chagas patients, grouped according to the Los
Andes clinical/hemodynamic classifi cation2
Ergospirometric variables
Groups according to Los Andes Classifi cation
Control (n = 21)
IA (n = 16)
IB (n = 08)
II (n = 12)
III (n = 12)
ANOVA Tukey No disease Normal electro-cardiogram and echocardiogram (no heart involvement) Normal electrocardiogram and abnormal echocardiogram (mild heart involvement) Abnormal electrocardio-gram and echocardioelectrocardio-gram,
without congestive heart failure (advanced heart
involvement)
Abnormal electrocardiogram and echocardiogram with congestive heart failure (severe heart
involvement)
p
Age (years)
39
± 10
46
± 10
48
± 15
53
± 10
58
± 9 0.0001
C ≠ II, III,
III ≠ IA
Body mass (kg)
74
± 10
79
± 10
66
± 13
66
± 12
71
± 15 0.019 IA ≠II
Height (m)
1.73
± 6
1.69
± 6
1.66
± 6
1.66
± 7
1.71
± 10 0.032 C ≠ II
Peak V
.
O2 (ml/min)
2418
± 749
1956
± 364
1542
± 602
1687
± 582
1273
± 393 0.00002
C ≠ IB, II, III.
IA ≠ III
Peak V
.
O2 (ml/kg/min)
33
± 12
25 ±5 23 ±7 26 ±9 19
±5 0.001 C ≠IA, III
AT (ml O2/min)
1817
± 767
1608
± 271
1425
± 631
1251
± 386
1053
± 340 0.005 C ≠II, III
V . E/V . CO2 at rest 58
± 14
58
± 17
66
± 11
61
± 18
63
± 18 0.698 ns
V
.
E/V
.
CO2 at 0.5 liter CO2/min
43
± 8
44
± 9
50
± 8
46
± 8
51
± 12 0.121 ns
V
.
E/V
.
CO2 at 1.0 liter CO2/min
36
± 8
38
± 6
42
± 5
38
± 8
41
± 12 0.308 ns
V
.
E/V
.
CO2 at exercise peak
45
± 13
39
± 9
48
± 13
39
± 10
47
± 18 0.233 ns
V
.
E/V
.
CO2 after 1 min of recovery
47
± 15
41
± 8
46
± 12
40
± 12
45
± 16 0.493 ns
V
.
E/V
.
CO2 after 3 min of recovery
54
± 16
51
± 15
59
± 14
45
± 12
49
± 15 0.235 ns
V
.
E/V
.
CO2 slope ±37 9 ±33 9 ±39 11 ±31 8 ±38 17 0.394 ns
C = control group; Peak V
.
O2 = oxygen uptake in the last seconds of exercise; V
. E/V
.
CO2 = ventilation/carbon dioxide production ratio; AT = ventilatory anaerobic threshold; ANOVA = analysis
groups organized according to the Los Andes classifi cation (Table 1). This contrasted with the classifi cation according to functional capacity (Table 4). Results of this nature have also been found via another mathematical method that considers ventilation and functional capac ity.5 The variations in peak V
.
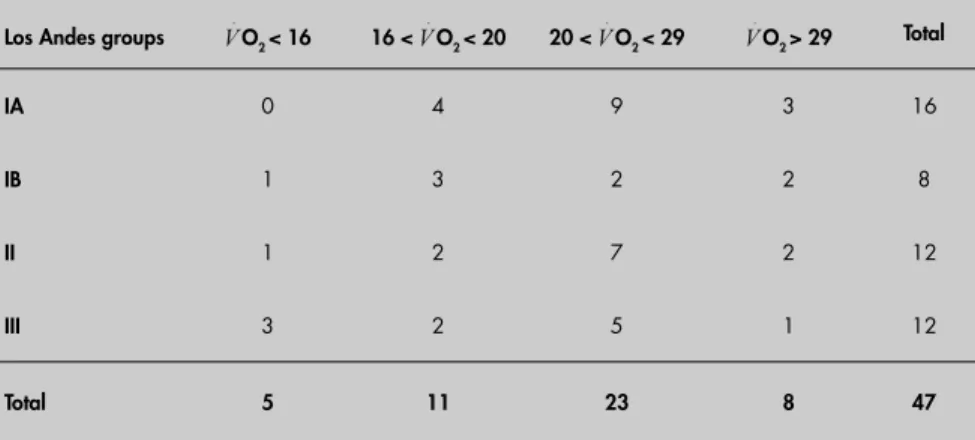
O2 values (Table 2) amongpatients with the same Los Andes classifi cation who are characterized clinically as having severe heart involvement were prob-ably due to the development of compensatory muscle adaptations. These muscle adaptations result in better exercise tolerance and reduce the impact of cardiopathy consequences. Certainly these patients were in a better condition: a few of the participants had V
.
O2 > 20 ml/kg/min. Analysis of V
. E/V
.
CO2 and V
. E/V
.
CO2 slope is a Table 2. Distribution of Chagas patients among Los Andes groups versus classifi cation
by V
.
O2 attained at exercise peak
Los Andes groups V
.
O2 < 16 16 < V
.
O2 < 20 20 < V
.
O2 < 29 V
.
O2 > 29 Total
IA 0 4 9 3 16
IB 1 3 2 2 8
II 1 2 7 2 12
III 3 2 5 1 12
Total 5 11 23 8 47
V
.
O2 = oxygen uptake (ml/kg/min).
Figure 1. V .
E/V .
CO2 slope during exercise (two patients and one control). BTPS = body temperature and pressure saturated; STPD= standard temperature and pressure, dry.
Table 3. Correlation coeffi cient of
V
.
E/
V
.
CO2 with peak
V
.
O2 and ventilatory anaerobic threshold of Chagas patients
V
.
E/V
.
CO2
Rest 0.5 liter CO2/min 1.0 liter CO2/min Exercise peak
After 1 min of recovery
After 3 min of recovery V
.
E/V
.
CO2 slope
Peak V
.
O2 (ml/min)
- 0.41 - 0.45 - 0.47 - 0.38 - 0.37 - 0.30 - 0.28
p = 0.001 p = 0.000 p = 0.000 p = 0.001 p = 0.002 p = 0.013 p = 0.020
Peak V
.
O2 (ml/kg/min)
- 0.29 - 0.43 - 0.45 - 0.36 - 0.30 - 0.28 - 0.33
p = 0.018 p = 0.001 p = 0.000 p = 0.003 p = 0.014 p = 0.023 p = 0.007
AT (ml/min)
- 0.36 - 0.34 - 0.32 - 0.27 - 0.28 - 0.15 - 0.12
p = 0.004 p = 0.007 p = 0.009 p = 0.031 p = 0.023 p = 0.253 p = 0.331
V
.
O2 = oxygen uptake; V
. E/V
.
CO2 = ventilation/carbon dioxide production; AT = ventilatory anaerobic threshold.
E/ CO2slope
y = 22.46x + 4.1144 R2 = 0.93 y = 36.674x + 4.7248
R2 = 0.94
y = 52.493x + 5.3501 R2 = 0.93
0 20 40 60 80 100 120 140
0 0,5 1 1,5 2 2,5 3 3,5 4 4,5
CO2 liter/min (STPD) E liter/min (BTPS)
Patient - group IA
Patient - group III
Control group
V .
V . V
.
practical method that does not need maximum effort for differentiation of patients’ functional capacities. Thus, this becomes another index for classifying patients who are waiting for heart transplantation.
Greater peak V
.
O2 and smaller V
. E/V
. CO2 slope refl ect ventilatory effi ciency throughout the exercise period (Table 4). Chagas patients with reduced functional capacity exhibited greater V
. E/V
.
CO2 slope, thus reproducing the results obtained from non-Chagas cardiopa-thies.1 These results indicate that the patients needed greater ventilatory effort for the equiva-lent quantity of CO2 produced during exercise than did individuals with better functional capacity (Figure 1).
Grouping patients according to peak V
. O2 also served to emphasize differences in
ventila-tory response at the beginning of the exercise (V
. E/V
.
CO2, at 0.5 liter/min of V
.
CO2). At this exercise level, aerobic metabolism probably predominates, thereby eliminating any need for an altered ventilatory response that would compensate for an increase in lactic acid. A likely candidate for such alterations at this phase of the effort is the change in VD/VT (fraction of the tidal volume that contributes to the dead space), which some authors have detected during exercise in patients with heart failure.6
The usefulness of V
. E/V
.
CO2 in predict-ing survival rates for patients with conges-tive heart failure has been demons trated:1 after 18 months, the survival rate was 95% for patients that attained V
. E/V
.
CO2 values of less than 34 at the exercise peak. Since patients with better tolerance of exercise, as
Table 4. Mean results (mean ± standard deviation) for all variables measured in Chagas patients, grouped according to peak V
.
O2
Groups (n = 18)Control V
.
O2<16 ml/kg/m (n = 05) 16 <
V
.
O2< 20ml/kg/m (n = 11) 20<
V
.
O2<29 ml/kg/m (n = 23)
V
.
O2>29 ml/kg/m (n = 08)
ANOVA
p Tukey
Age (years) 41±9 62±7 54± 10 51 ± 9 37 ± 11 0.000003 C ≠1, 2, 3
4 ≠1, 2, 3
Body mass (kg) 74 ± 11 64 ± 14 69 ± 13 75 ± 13 65 ± 7 0.120 non signifi cant
Height (m) 173 ± 6 165± 8 163± 5 170± 5 167 ± 6 0.0005 C, 3, ≠ 2
Peak V
.
O2 (ml/min) 2592± 660 838± 233 1259± 242 1836 ± 333 2253 ± 392 0.000001
C ≠ 1, 2, 3
4 ≠ 1, 2
3 ≠ 1, 2
Peak V
.
O2 (ml/kg/min) 36
± 11 13±2 18± 1 25 ± 2 35 ± 5 0.000001
C ≠ 1, 2, 3
4 ≠ 1, 2, 3
3 ≠ 1
AT (ml/min) 1942 ± 773 768 ± 147 1062 ± 239 1504 ± 335 1690 ± 506 0.00004 C ≠ 1, 2
4 ≠ 1
V
.
E/V
.
CO2 at rest 57 ± 15 72 ± 9 71 ± 11 57 ± 17 54 ± 17 0.025 1 ≠ 3, 4
2 ≠ 3, 4, C
V
.
E/V
.
CO2 at 0.5 liter CO2/min 42
± 7 54 ± 11 53 ± 8 45 ± 9 42 ± 11 0.006 C ≠2
V
.
E/V
.
CO2 at 1.0 liter CO2/min 36 ± 9 43 ± 4 45 ± 8 38 ± 7 34 ± 5 0.005 C, 4 ≠ 2
V
.
E/V
.
CO2 at exercise peak 45 ± 14 60 ± 19 50 ± 9 39 ± 9 33 ± 4 0.0001
1 ≠ 3, 4
2 ≠ 3, 4
V
.
E/V
.
CO2 after 1 min of recovery 45 ± 15 53 ± 15 50 ± 10 40 ± 10 33 ± 5 0.008 4 ≠ 1, 2
V
.
E/V
.
CO2 after 3 min of recovery 52
± 16 63 ± 14 58 ± 14 46 ± 12 45 ± 16 0.047 non signifi cant
V
.
E/V
.
CO2 slope 37 ± 10 47 ± 18 41 ± 9 32 ± 9 27 ± 6 0.002
1 ≠ 3, 4
2 ≠ 4
Groups:C = control (peak V
.
O2 > 22 ml/kg/min); Peak V
.
O2 = oxygen uptake in the last seconds of exercise; V
. E/V
.
CO2 = ventilation/Carbon dioxide production ratio; AT = ventilatory anaerobic
threshold; ANOVA = analysis of variance.
represented by lower V
. E/V
.
CO2 ratios and higher V
.
O2 values, tend to have better prog-noses, the functional capacity classifi cation may better quantify the disability caused by heart disease than does the Los Andes clini-cal/hemodynamic classifi cation.
CONCLUSIONS Peak V
. O2, V
. E/V
.
CO2 and V
. E/V
. CO2 slope were shown to be useful parameters for classifying individuals’ cardiopulmonary conditions. The V
. E/V
.
CO2 parameters had the advantage of not requiring maximum levels of exercise.
Progressive deterioration in the ventilatory response among CCC patients during exercise was more evident when the functional capacity (peak V
.
1. Weber KT, Kinasewitz GT, Janicki JS, Fishman AP. Oxygen utilization and ventilation during exercise in patients with chronic cardiac failure. Circulation. 1982;65(6):1213-23. 2. Carrasco Guerra HA. Diagnostico de daño miocardico en la
enfermedad de Chagas. Textos de la Universidad de Los Andes. Coleccion Ciências de la salud – série medicina. Mérida-Ven-ezuela, Universidade de Los Andes Consejo de Publicaciones; 1983. p. 117-120.
3. McKee PA, Castelli WP, McNamara PM, Kannel WB. The natural history of congestive heart failure: the Framingham study. N Engl J Med. 1971;285(26):1441-6.
4. Chua TP, Ponikowski MD, Harrington D, et al. Clinical correlates and prognostic signifi cance of the ventilatory response to exercise in chronic heart failure. J Am Coll Cardiol. 1997;29(7):1585-90. 5. Van Laethem C, Bartunek J, Goethals M, Nellens P, Andries E, Vanderheyden M. Oxygen uptake effi ciency slope, a new sub-maximal parameter in evaluating exercise capacity in chronic heart failure patients. Am Heart J.2005;149(1):175-80. 6. Sullivan MJ, Higginbotham MB, Cobb MD. Increased
exer-cise ventilation in patients with chronic heart failure: intact ventilatory control despite hemodynamic and pulmonary abnormalities. Circulation. 1988;77(3):552-9.
Acknowledgments:The authors thank Prof. Dr. Marta Soren-son for her technical support.
Place where the work was presented: Scientifi c Initiation Day at Universidade Federal do Rio de Janeiro and Seventh Annual Congress of the European College of Sport Science (Athens, July 24-28, 2002).
Sources of funding: Fundação de Amparo à Pesquisa do Estado do Rio de Janeiro (FAPERJ). Grant number E-26/170.592/2000.
Confl icts of interest:Not declared
Date of fi rst submission:August 24, 2005
Last received: August 21, 2006
Accepted:August 21, 2006
REFERENCES
AUTHOR INFORMATION
Fátima Palha de Oliveira, PhD. Bioscientist in the
Physi-cal Activity Department, Universidade Federal do Rio de Janeiro, Rio de Janeiro, Brazil.
Roberto Coury Pedrosa, PhD. Doctor in Hospital
Clementino Fraga Filho, Universidade Federal do Rio de Janeiro, Rio de Janeiro, Brazil.
Address for correspondence:
Fátima Palha de Oliveira.
Rua das Laranjeiras, 136/203 — Laranjeiras Rio de Janeiro (RJ) — Brasil — CEP 22240-000 Tel. (+55 21) 2205-7299 — Fax (+55 21) 2562-6801 E-mail: [email protected]
Copyright © 2006, Associação Paulista de Medicina
Resumo
Resposta ventilatória durante o exercício na cardiopatia chagásica crônica CONTEXTO E OBJETIVO: Mudança na inclinação da curva V
.
E/V
.
CO2 ao longo do tempo durante exercício
tem sido recomendada como parâmetro de análise da resposta ventilatória durante o exercício entre paci-entes com insufi ciência respiratória de diferpaci-entes etiologias. O objetivo deste estudo foi avaliar a resposta ventilatória de pacientes com cardiopatia chagásica crônica.
MÉTODOS: Total de 48 pacientes, divididos em quatro grupos de acordo com a Classifi cação Clinica e Hemodinâmica de Los Andes, compôs a amostra deste estudo. Na análise, os pacientes foram classifi cados também pelo consumo de oxigênio obtido em teste de esforço. Os resultados dos pacientes foram com-parados com os resultados do grupo de controle, formado por 21 homens saudáveis, sem diagnóstico de doença de Chagas. O teste de esforço foi realizado em bicicleta ergométrica com o incremento de 12.5 W/min, sendo a duração do exercício sintoma-limitado. A concentração de gases e o fl uxo ventilatório foram medidos em tempo real e registrados ciclo a ciclo. Foram adotados os parâmetros inclinação da curva de V
.
E/V
.
CO2 e razão entre V .
E/V
.
CO2 (computada em diferentes momentos do teste).
RESULTADOS: Apesar de não haver diferenças signifi cativas para V
.
E/V
.
CO2 slope e para a razão V .
E/V
.
CO2
quando os pacientes foram grupados pela Classifi cação Clínica/Hemodinâmica de Los Andes, esses parâmetros variaram signifi cativamente quando a capacidade funcional, V
.
O2peak, foi considerada.
CONCLUSÕES: Nossos resultados indicam que uma menor capacidade ventilatória durante o exercício foi mais evidente nos pacientes com cardiopatia chagásica crônica quando a capacidade funcional estava reduzida.