PANOECONOMICUS, 2011, 4, pp. 489-509
Received: 27 January 2010; Accepted: 28 September 2011.
UDC 330.34:[339.564:338.2 DOI: 10.2298/PAN1104489D Original scientific paper
Jože P. Damijan
University of Ljubljana, Slovenia;
Vienna University of Economics and Business Administration, Austria;
Institute of Economic Research, Ljubljana,
Slovenia
joze.damijan@ef.uni-lj.si
Matija Rojec
University of Ljubljana, Slovenia;
Institute of Macroeconomic Analysis and Development,
Ljubljana, Slovenia
matija.rojec@gov.si
Maja Ferjančič
Institute of Macroeconomic Analysis and Development,
Ljubljana, Slovenia
maja.ferjancic@goc.si Acknowledgement This paper was produced in the framework of MICRO-DYN (http://www.micro-dyn.eu/), an interna-tional economic research project focusing on the competitiveness of firms, regions and industries in the knowledge-based economy. The project is funded by the EU Sixth Framework Programme (http://www.cordis.lu/). This publication reflects only the author's views, the European Commission is not liable for any use that may be made of the information contained therein.
An earlier version of this paper has been published as LICOS Discussion Paper 202/2008.
The Growing Export Performance
of Transition Economies:
EU Market Access versus Supply
Capacity Factors
Summary: The paper examines the reasons for the remarkable growth of transition economies’ export performance. We distinguish between foreign/EU market access and internal supply capacity factors. EU market access has been of great importance, while among supply capacity factors, stable institu-tional setup, structural reforms, and targeted FDI are in the forefront.
Key words:Export performance, Transition economies of Central and Eastern Europe, (EU) market access, Supply capacity, Institutional setup, FDI.
JEL: F120, F150, F210, O100, P300.
490 Jože P. Damijan, Matija Rojec and Maja Ferjančič
two countries that joined the EU in January 2007 plus Croatia (the CEEC-3: Bulga-ria, Croatia, and Romania). We distinguish between both groups of countries on the grounds that, in the period that we analyze, the former has shown better export re-sults than the latter and has also progressed much further in the EU integration and transition processes.
The objective of this paper is to examine the determinants of the impressive growth of transition economies' export performance. Based on the relevant theoreti-cal concepts, we follow the approaches of Stephen Redding and Anthony J. Venables (2003, 2004) and Marco Fugazza (2004) and distinguish between market access and the supply capacity determinants of export performance. We build an econometric model to assess the determinants of export performance in two steps: first, we assess the contribution of market access, in general and to the EU-15, against that of supply capacity improvement, and second, we assess the importance of individual factors determining the supply capacity. Following the gravity approach, the proximity and size of the EU market and the EU integration process, are rather self-evident factors contributing to the improved market access of the transition economies. Factors de-termining the supply capacity are numerous, but so far their impact on the transition economies’ export performance has not been fully assessed in the literature. In ana-lyzing the supply capacity factors, we broaden the concepts outlined by Redding and Venables (2003, 2004) and Fugazza (2004) by including the impact of structural changes, productivity growth, foreign direct investment (FDI) penetration and insti-tutional (transition) setting in the model. This is a specific new contribution of the paper, as the existing studies have not included these factors as explanatory variables of supply capacity in the model.
The paper is structured as follows. Section 1 examines the determinants of the transition economies’ growing export performance as put forward by the literature. In Section 2, we construct an econometric model in order to account for the contribution of market access to export performance against that of supply capacity improvement. Section 3 assesses the importance of individual supply capacity factors, and the last section presents the conclusions.
1. Determinants of the Transition Economies’ Export
Performance
491
The Growing Export Performance of Transition Economies: EU Market Access versus Supply Capacity Factors
the EU-15, as a large, near, and highly developed market, assumed the role of the predominant trading partner. In addition, the CEECs have become an important loca-tion for the outsourcing of services from the EU-15 (Metka Stare and Luis Rubalcaba 2009). In short, the CEEC have gradually approached the “normal” level of trade with developed countries, especially the EU, but considerable differences exist among individual countries.
Redding and Venables (2003, 2004) and, on their work, Fugazza (2004) de-veloped a model of trade that uses gravity techniques to estimate to what extent the export growth of a country is due to changed access to foreign markets and to what extent it is due to changes in the internal supply capacity of the exporting country. This is essentially a standard new trade theory model based on product differentiation derived from a constant elasticity of substitution demand structure. Market access segment, i.e. access to foreign markets is desegregated to particular regional group-ings. Countries at the center of (or at least near to) a fast growing region experience favorable foreign market access (Fugazza 2004). Particularly positive for foreign market access may be regional economic integration (Redding and Venables 2003). The internal supply capacity is regressed on variables such as GDP, population, in-ternal transport costs, and one or two institutional variables (real exchange rate fluc-tuations, risk of expropriation, labor-market characteristics). The institutional varia-ble may be of particular importance in the case of transition countries, which have gone through an overwhelming transformation process from socialist to a market economy, and may still have some implementation gap as far as institutional frame-work is concerned. Their results of Redding and Venables (2003, 2004), and Fugazza (2004) suggest that market access has been more important than supply capacity for the increasing export performance of the CEEC. In Redding and Venables (2003), growth in foreign market access was a much more important source of export growth than supply capacity growth. The main component of foreign market access growth was Western Europe (i.e., the EU). Nevertheless, the actual level of trade of Eastern Europe is lower than one would expect given good market access and better-than-average internal geography and institutions. This level is due to transition countries that are faced with supply capacity constraints. The results of Fugazza (2004) are more ambiguous. In the first phase of transition (1988-95), foreign market access was much more important for the export growth of the CEEC than supply capacity growth, whereas the situation in 1992-99 was quite the opposite. Thus, the beginning of the transition was characterized by the opening of the markets in the EU and else-where, whereas the supply capacity was not able to exploit the new opportunities.
Apart from the fundamentals of gravity theory, the literature puts forward five factors that deserve special attention when analyzing the CEEC’s export perfor-mance:
a) Improved access of the transition economies to EU markets. Most of the
EU-492 Jože P. Damijan, Matija Rojec and Maja Ferjančič
15 markets. How important has this institutional factor been? The literature suggests that preferential market access, especially the Europe Agreements, provides the tran-sition economies with a competitive edge over suppliers from other countries and has clearly been important for increasing the volume of CEEC trade but has not been directly responsible for much of the growth of their exports (Kaminski, Wang, and Winters 1996b, p. 34). This is so because the Europe Agreements retained a number of restrictions (delays in liberalizing imports of sensitive products, tight rules of ori-gin, continuing threats of antidumping and the virtual exclusion of agriculture), which were removed only gradually in the process of EU integration.
b) Structural changes in the transition economies’ exports. Since the
begin-ning of the transition process, the export structure of the transition economies has undergone significant structural changes in terms of an increasing share of medium- and high-skill and technology-intensive manufactures and the corresponding de-crease in the share of primary commodities, labor-intensive and resource-based products, and low-skill and technology-intensive manufactures. In 1995-2004, the share of medium- and high-skill and technology-intensive manufactures in CEEC-8 exports increased from only 36.0% to 56.1% (UNCTAD, 2003; own calculations based on WIIW database). The export structures of the CEEC show a tendency of gradual convergence with the export structures of the EU-15 (Nuno Crespo and Ma-ria P. Fontoura 2007). Extensive literature on the structural changes in CEEC exports tends to claim that structural upgrading of exports positively contributed to export performance (Bernard Hoekman and Simeon Djankov 1996; Chonira Aturupane, Djankov, and Hoekman 1997; Kaminski and Ng 2001; Uwe Dulleck et al. 2004). However, an important distinction between the most developed (Czech Republic, Hungary, Poland, Slovakia, Slovenia) and other transition countries can be observed. While the former appeared to be successful in substantial quality upgrading of their export structure, some evidence of a “low-quality trap” can be found for the latter (Dulleck et al. 2004, pp. 23-24).
c) Increased levels of productivity in the transition economies. According to
Andrew B. Bernard and Bradford J. Jensen (1998), productivity growth is an impor-tant determinant of export growth; they claim that productivity gains from 1987-1992 accounted for about 10% of overall U.S. export growth in 1987-1994. The productiv-ity growth of the CEEC has been remarkable since the beginning of the transition process and since 1995, has also been much faster than in the EU-15 (Peter Havlik 2005, pp. 3-21). The result is a strong productivity catching-up process in the CEEC.
d) The role of FDI in the growing export performance of the transition
econ-omies. The importance of FDI for the transition economies’ exports is very high and
493
The Growing Export Performance of Transition Economies: EU Market Access versus Supply Capacity Factors
Gőrg and David Greenaway 2004). In spite of the remarkable contribution of FDI to the export performance of the CEEC, the causal relationship between export propen-sity and strategic foreign ownership remains ambiguous. It seems that most of the superior export propensity of foreign subsidiaries is explained by factors other than foreign ownership, with multinationality being a very important one (Michael Pfaf-fermayr and Christian Bellak 2000; Rojec, Damijan, and Boris Majcen 2004).
e) Transition from socialist to market economies: a complete change in the
institutional setting. Dani Rodrik, Arvind Subramanian, and Francesco Trebbi (2002)
find that institutional quality has a positive and significant effect on (trade) integra-tion. Gravity models also recognize that the business environment is an important determinant of a country's export performance (Redding and Venables 2003; Fugazza 2004). In the case of transition countries, which have gone through an overwhelming change in the entire socioeconomic system and the building of institutions, we need a complex measure of the reform process as an indicator of the development of the institutional setting. The most commonly used indicator of reform progress is the European Bank for Reconstruction and Development (EBRD) transition index. In 1991-2005, the combined CEEC-8 and CEEC-3 increased their overall EBRD transi-tion index from only 1.79 (the minimum being 1) to 3.68 (EBRD 1999, 2000, 2002, 2003, 2004, 2005), which is near to the level of an “ideal” advanced market econo-my, 4.3.1 The existing literature on the subject is pretty straightforward, stating that the speed and scope of transition reforms have been crucial to the growth of export performance. Thus, Havrylyshyn and Al-Atrash (1998) find that geographic diversi-fication of CEEC's exports to the EU is greater the closer is geographic proximity and the more progress a country makes in structural reforms. Kaminski (1993) de-tects a close link between export performance and the decision to move quickly to a market-based economy. More precisely, Kaminski, Wang, and Winters (1996b, p. 46) claim that progress in macroeconomic stabilization and in establishing market-supporting institutions was perhaps the single most important factor determining for-eign trade performance over the transitional period.
2. Accounting for the Contribution of Market Access vs. Supply
Capacity Improvement to Export Performance
The main features of the increasing export performance and changes in transition economies’ exports are the following (see the Appendix table): i) In 1991-2004, ex-ports of the CEEC-8 increased by 648%, and exex-ports of the CEEC-3 increased by 382%; ii) The absolute increase of exports has been accompanied by a no-less-impressive increase of export intensity, i.e., of the exports-to-GDP ratio. In the 8, the ratio increased from 29.3% in 1995 to 46.0% in 2004, and in the CEEC-3, it increased from 22.8% in 1998 to 25.7% in 2004; iii) A high increase in exports has been achieved by acquiring much higher market shares abroad, especially in the EU-15. In 1991-2004, the share of CEEC-8 exports in the total world imports
1
494 Jože P. Damijan, Matija Rojec and Maja Ferjančič
creased from 1.11% to 2.81%, and its share in EU-15 imports increased from 1.54% to 5.38%. The corresponding increases for the CEEC-3’s export shares are from 0.30% to 0.45% for the total world imports and from 0.28% to 0.78% for EU-15 im-ports; iv) The result has been an ever-growing importance of EU-15 markets for tran-sition economies’ exports. In 2004, the EU-15 absorbed 65.9% of CEEC-8 exports and 60.0% of CEEC-3 exports.
The data clearly show that the CEEC-8 have made much more considerable progress in export performance than the CEEC-3. The magnitude of the above trends and structural changes also varies among individual countries, but the direction is the same in all of them.
In this section, we assess the contribution of foreign market access to the ex-port growth of individual CEECs vs. that of internal supply capacity improvement. This approach consists of two steps. In the first step, we quantify the respective roles of foreign market access and supply capacity as two key determinants of the export performance of a given country. In the second step, we then use the estimates ob-tained in the first stage of the analysis in order to construct supply capacity and for-eign market access series. These serve as an analytical tool for revealing the impor-tance of the supply capacity of the exporting economy and of foreign market access for a country’s export performance.
2.1 Decomposition of Export Performance
Total export growth can be decomposed into supply capacity and foreign market access growth. Following the approach of Redding and Venables (2003, 2004) and Fugazza (2004), we estimate a gravity model equation where the dependent variable is total manufacturing exports (logarithmic) from country i to country j and the de-pendent variables are bilateral distance (logarithmic), an indicator of the existence of a common border, exporter-country dummies, and importer-partner dummies2:
ij ij ij
i i
j j
ij Partner Country Dist Bord u
X 1 2
ln . (1)
Bilateral distance Distij and the border dummy Bordij are assumed to capture
geographical bilateral trade costs. Exporters’ and importers’ fixed effects, Countryi
and Partnerj, respectively, are introduced in order to control for supplier capacity and
market capacity. These terms can also serve as a control for institutions and policy-related bilateral trade costs.
The model is estimated for 11 CEECs (CEEC-8 and CEEC-3) at the level of the aggregate trade flows of these countries with their most important trading part-ners from all over the world. The data set spans the period 1994-2004, which creates a balanced panel for 11 years. Bilateral trade flows, distance measures, and GDP data were obtained from the UN COMTRADE and CEPII databases.
2
495
The Growing Export Performance of Transition Economies: EU Market Access versus Supply Capacity Factors
Table 1 Bilateral Trade Equation Estimation (with Country and Partner Dummies) for CEEC [Period 1994-2004, OLS Estimator]
ln(Xij) 1994 1995 1996 1997 1998 1999 2000 2001 2002 2003 2004
Ln(distij) ***-0.778 ***-0.781 ***-0.853 ***-0.728 ***-0.922 ***-0.899 ***-0.807 ***-0.831 ***-0.826 ***-0.885 ***-0.861
-7.83 -7.97 -9.31 -8.76 -10.68 -10.59 -10.07 -10.2 -9.91 -10.63 -10.15
Borderij ***1.600 ***1.618 ***1.392 ***1.758 ***1.360 ***1.326 ***1.486 ***1.447 ***1.338 ***1.255 ***1.263
4.51 4.70 4.21 5.91 4.33 4.27 5.05 4.81 4.36 4.07 4.03
CZ ***1.333 **1.254 ***1.612 ***1.478 ***1.792 ***1.961 ***2.169 ***2.127 ***2.186 ***2.016 ***2.012
2.58 2.50 3.30 3.38 3.87 4.34 5.13 4.91 4.95 4.54 4.46
EE ***-2.975 ***-3.183 ***-2.282 ***-1.296 ***-1.363 ***-1.195 **-0.907 **-0.840 **-0.873 **-0.847 ***-1.527
-6.1 -6.69 -4.96 -3.11 -3.14 -2.84 -2.32 -2.10 -2.14 -2.06 -3.67
HU *0.844 0.720 **0.992 ***1.143 ***1.507 ***1.742 ***1.885 ***1.960 ***1.985 ***1.888 ***1.940
1.67 1.46 2.07 2.66 3.31 3.93 4.56 4.62 4.59 4.34 4.40
LV ***-2.275 ***-2.637 ***-2.175 ***-2.240 ***-1.893 ***-1.808 ***-1.585 ***-1.818 ***-1.687 ***-1.967 ***-1.748
-4.62 -5.45 -4.68 -5.39 -4.34 -4.26 -4.03 -4.53 -4.11 -4.79 -4.20
LT ***-2.509 ***-2.083 ***-2.166 ***-1.571 ***-1.553 ***-1.723 ***-1.312 ***-1.563 ***-1.374 ***-1.278 ***-1.415
-5.19 -4.36 -4.71 -3.8 -3.55 -4.07 -3.34 -3.92 -3.38 -3.13 -3.42
PL ***1.592 ***1.443 ***1.791 ***1.765 ***2.082 ***2.215 ***2.411 ***2.423 ***2.393 ***2.357 ***2.501
3.09 2.88 3.67 4.04 4.5 4.92 5.73 5.62 5.44 5.33 5.57
SK 0.293 0.405 0.296 0.146 0.390 0.643 *0.819 *0.763 *0.762 **0.931 **0.957
0.55 0.77 0.61 0.34 0.85 1.43 1.95 1.77 1.73 2.11 2.14
SI 0.008 -0.213 0.124 0.190 0.533 *0.793 *0.780 *0.769 *0.770 0.638 0.663
0.02 -0.43 0.26 0.44 1.18 1.80 1.90 1.83 1.79 1.48 1.51
BG 0.278 0.202 *0.319 *0.284 *0.305 *0.326 **0.414 **0.420 **0.436 **0.397 **0.436
1.41 1.07 1.72 1.71 1.73 1.90 2.57 2.54 2.59 2.34 2.53
CRO ***-1.151 ***-1.238 ***-1.359 ***-1.248 ***-1.008 ***-0.864 ***-1.008 ***-0.925 ***-1.060 ***-1.047 ***-1.130
-3.56 -3.97 -4.47 -4.59 -3.50 -3.04 -3.76 -3.37 -3.78 -3.71 -3.95
Partner dummies Yes Yes Yes Yes Yes Yes Yes Yes Yes Yes Yes
EU ***2.124 ***2.291 ***2.113 ***2.064 ***2.278 ***2.683 ***2.757 ***2.810 ***3.013 ***3.073 ***3.144
8.93 9.86 9.48 10.3 10.81 12.93 14.07 14.04 14.77 15.00 15.13
CEEC-8 ***0.795 ***0.873 ***0.824 ***0.730 ***0.864 ***1.131 ***1.220 ***1.280 ***1.510 ***1.564 ***1.765
2.48 2.80 2.77 2.74 3.07 4.09 4.69 4.81 5.57 5.74 6.38
CEEC-3 0.203 0.364 0.060 -0.121 0.100 0.450 0.365 0.342 **0.835 ***1.142 ***1.430
0.47 0.88 0.15 -0.34 0.26 1.19 1.02 0.93 2.23 3.03 3.74
OECD ***1.549 ***1.597 ***1.506 ***1.372 ***1.525 ***1.769 ***1.784 ***1.791 ***2.029 ***2.086 ***2.173
8.06 8.4 8.39 8.45 9.08 10.73 11.48 11.36 12.59 12.93 13.27
# obs 791 756 799 787 827 843 858 886 880 887 901
Adj R-sq. 0.597 0.607 0.604 0.598 0.627 0.659 0.670 0.680 0.674 0.685 0.697
Notes: ln(Xij) is log bilateral exports from country i to partner j plus one; ln(distij) is bilateral distance between countries i
and j; borderij is a dummy for a common border. t-statistics in italics; ***, **, and * denote the significance of parameters at
1%, 5% and 10%, respectively.
496 Jože P. Damijan, Matija Rojec and Maja Ferjančič
Model (1) is estimated year-by-year in order to allow for annual variations in estimated individual parameters of interest. A simple OLS estimator is used in these exercises. The results are presented in Table 1. The estimated coefficients of geo-graphical distance are of the same size as those obtained by Fugazza (2004) for a larger and more heterogeneous data set. There is little variation in the estimated coef-ficients over time, indicating the robust importance of transport costs for the export performance of individual CEEC. On the other hand, the coefficients for border dummies are two to three times higher than those obtained by Redding and Venables (2003) and Fugazza (2004) but decrease over time. This finding indicates the high importance of cross-border trade for the CEEC, which, however, has been diminish-ing with the economic integration and economic development of these countries over the last decade. With closer integration into the EU economic area and with high rates of productivity growth, the relative importance of transportation costs might well be decreasing, and domestic firms can increasingly afford to bear the costs of shipping goods to non-neighboring countries. In 2004, however, the coefficient for border effects on trade was still twice that of those estimated in the above-mentioned studies.
We introduce exporters’ and importers’ fixed effects, Countryi and Partnerj,
where the former serves to control for supplier capacity and the latter for foreign market capacity. Exporter countries’ parameters are mostly positive and significant as expected, with the exception of the three Baltic states and Croatia, where negative and significant parameters are revealed. This may indicate the divergent evolution of domestic supply capacities in these countries, as they have all undergone a substan-tial process of de-industrialization during this period. With a stagnating or even fall-ing manufacturfall-ing output, these countries have decreased heir supply capacities. In all of the other countries exporter country coefficients are in line with expectations and reveal positive increasing trends over time, indicating a rise in domestic supply capacities. In accordance with the process of trade liberalization with the EU in the 1990s, the EU market predominates over other importer dummies. The importance of other OECD countries is about 60% of that of the EU markets, whereas the impor-tance of trade with other members of CEEC-8 and CEEC-3 is much lower.
2.2 Accounting for Supply Capacity and Foreign Market Access
Calculation of a country’s own supply capacity and its foreign market access follows directly from the gravity model (1). Here, an exporter’s country dummy indicates the country’s own scope of supply capacity, while the scope of foreign market access is determined by the partner country’s effect weighted by the distance and by the bor-der. Therefore, following Redding and Venables (2003), in the second step, the esti-mates obtained in the first stage of the analysis (estiesti-mates of model (1)) are used to construct supply capacity and foreign market access series. The supply capacity es-timate for country i (SCi) is given by the exponential of the exporter country dummy
times its coefficient:
)
exp( i i
i Country
SC (2)
497
The Growing Export Performance of Transition Economies: EU Market Access versus Supply Capacity Factors
) exp(
* * )
exp( 1 2
ij ij
j
i j j
i Partner Dist Bord
FMA
(3)
The estimates of supply capacity (2) and foreign market access (3) allow us to decompose the sources of export growth over the last decade and help us to analyze over time the contribution of both the supply capacity and the foreign market access to the export performance of each individual CEEC.
As revealed in Figure 1, the evolution of exports as well as of supply capacity and foreign market access are remarkably uniform across the individual CEECs. Some variation in the export figures around the common increasing trend of exports is present. This variation is higher in the period 1994-2000 but then dies out in the period 2000-2004. Table 2 further demonstrates some differences in export perfor-mance among both groups of CEEC. It is shown that the CEEC-8 has increased its exports at a faster pace than the CEEC-3 in the periods 1994-1996 and 1996-1998 (biannual growth rates of 33% and 46% as compared to 11% and 9%, respectively), while both groups of countries have recently converged to similar growth rates of exports (biannual growth rates of 27% to 28%).
The contribution of market access improvement vs. that of supply capacity upgrading to export growth is almost identical for the CEEC-8 and the CEEC-3. In both groups of countries, the contribution of the upgrading of supply capacity was initially dominant but has gradually been decreasing (i.e., from 94.3% in 1994-96 to 24.5% in 2002-04 for the CEEC-8 and from 89.7% to 22.7% for the CEEC-3). The opposite is true for improvement in foreign market access, whose contribution to ex-port growth increased remarkably, from 5.7% to 75.5% for the CEEC-8 and from 10.3% to 77.3% for the CEEC-3. The liberalization of foreign trade following WTO standards and, above all, the EU integration processes seem to have decisively im-proved foreign market access for the CEEC. However, it obviously took some time before the CEECs were truly capable of using their potentially favorable position in terms of foreign market access. This is in line with Kaminski, Wang, and Winters (1996b), who say that preferential treatment provided by Europe Agreements to the CEEC was initially limited by a number of inherent limitations, which were removed only gradually in the process of EU integration. Table 2 indicates that the main posi-tive impact of the Europe Agreements for CEEC exports came into effect in 1996-1998, which then unfolded into a massive long-lasting export effect.
498 Jože P. Damijan, Matija Rojec and Maja Ferjančič
Exports
Supply capacity
Foreign market access
Source: Authors’ estimations.
Figure 1 Growth Index for Exports, Supply Capacity and Foreign Market Access
.8
1
1.
2
1.
4
1.
6
1994 1996 1998 2000 2002 2004
year
I_ax_CZ I_ax_EE
I_ax_HU I_ax_LT
I_ax_LV I_ax_PL
I_ax_SK I_ax_SI
I_ax_BG I_ax_CRO
I_ax_RO
Index of exports
.2
.4
.6
.8
1
1.
2
1994 1996 1998 2000 2002 2004
year
I_dasc_CZ I_dasc_EE
I_dasc_HU I_dasc_LT
I_dasc_LV I_dasc_PL
I_dasc_SK I_dasc_SI
I_dasc_BG I_dasc_CRO
I_dasc_RO
Contribution of supply capacity to grow th of exports
0
.2
.4
.6
.8
1
1994 1996 1998 2000 2002 2004
year
I_dafma_CZ I_dafma_EE
I_dafma_HU I_dafma_LT
I_dafma_LV I_dafma_PL
I_dafma_SK I_dafma_SI
I_dafma_BG I_dafma_CRO
I_dafma_RO
499
The Growing Export Performance of Transition Economies: EU Market Access versus Supply Capacity Factors
Table 2 Components of Export Growth, 1994-2004
Export index
Contribution to export index (in %)
Supply capacity growth Foreign market access improvement
1994-96 1996-98 1998-00 2000-02 2002-04 1994-96 1996-98 1998-00 2000-02 2002-04 1994-96 1996-98 1998-00 2000-02 2002-04 Czech Republic 1.31 1.31 1.37 1.29 1.33 93.6 41.1 45.4 37.9 19.4 6.4 58.9 54.6 62.1 80.6 Estonia 1.48 1.77 1.43 1.08 1.05 94.1 68.9 48.1 44.5 12.2 5.9 31.1 51.9 55.5 87.8 Hungary 1.15 2.01 1.50 1.19 1.21 91.9 49.8 44.1 37.6 21.2 8.1 50.2 55.9 62.4 78.8 Lithuania 1.51 1.28 1.24 1.41 1.29 93.5 71.1 44.2 30.0 32.5 6.5 28.9 55.8 70.0 67.5 Latvia 1.35 1.44 1.24 1.21 1.27 93.5 71.2 44.4 30.1 33.0 6.5 28.8 55.6 69.9 67.0 Poland 1.35 1.31 1.36 1.27 1.39 93.2 42.4 49.1 36.5 22.2 6.8 57.6 50.9 63.5 77.8 Slovakia 1.35 1.34 1.36 1.22 1.44 99.4 41.7 49.4 33.7 30.0 0.6 58.3 50.6 66.3 70.0 Slovenia 1.16 1.21 1.18 1.15 1.17 94.9 50.7 40.0 35.0 22.6 5.1 49.3 60.0 65.0 77.4 Bulgaria 1.07 0.98 1.44 1.15 1.32 88.1 40.2 73.9 35.9 24.2 11.9 59.8 26.1 64.1 75.8 Croatia 1.00 1.12 1.18 1.08 1.24 90.5 45.9 37.7 34.8 21.2 9.5 54.1 62.3 65.2 78.8 Romania 1.25 1.17 1.55 1.31 1.29 90.4 44.2 43.1 38.2 22.5 9.6 55.8 56.9 61.8 77.5 CEEC-8 1.33 1.46 1.34 1.23 1.27 94.3 55.0 45.7 35.5 24.5 5.7 45.0 54.3 64.5 75.5 CEEC-3 1.11 1.09 1.39 1.18 1.28 89.7 43.6 52.2 36.4 22.7 10.3 56.4 47.8 63.6 77.3 All countries 1.24 1.31 1.36 1.20 1.27 91.2 58.5 40.3 39.2 24.1 8.8 41.5 59.7 60.8 75.9
Notes: Bi-annual index of growth of exports. calculated from equations (2) and (3); and contribution of supply capacity and foreign market access to export growth (in %).
Source: Authors’ estimations.
Table 3 Decomposition of Foreign Market Access Growth by Foreign Markets, 1994-2004 (in %)
Contribution of
EU-15
2004 New EU member states
(CEEC-8, Cyprus and Malta) CEEC-3
1994-96 1996-98 1998-00 2000-02 2002-04 1994-96 1996-98 1998-00 2000-02 2002-04 1994-96 1996-98 1998-00 2000-02 2002-04 Czech Republic 73.7 76.7 73.9 73.1 73.0 8.5 8.5 10.6 11.4 13.2 1.1 1.2 1.4 1.6 2.2
Estonia 90.7 90.1 89.7 90.1 86.7 2.9 3.5 4.2 4.2 6.4 0.1 0.2 0.2 0.2 0.4
Hungary 51.2 55.8 54.5 52.8 53.9 12.0 12.2 15.0 16.1 18.3 2.5 2.9 2.9 3.4 5.0 Lithuania 50.1 54.1 54.4 52.3 53.0 16.0 16.6 18.7 20.5 23.5 0.9 1.0 1.1 1.3 1.9 Latvia 61.5 63.8 63.6 62.0 60.5 15.3 15.8 17.6 19.3 22.4 0.5 0.6 0.7 0.8 1.2 Poland 58.8 62.1 62.2 60.4 60.1 13.1 13.4 15.7 17.1 19.8 1.3 1.4 1.6 1.8 2.5
Slovakia 88.4 88.8 86.2 86.5 84.0 4.2 4.6 6.1 6.2 8.4 0.6 0.7 0.9 1.0 1.5
Slovenia 58.8 63.6 61.4 58.9 59.8 6.8 6.8 9.0 9.4 10.5 10.0 10.3 9.7 12.1 14.6
Bulgaria 19.1 24.7 27.3 25.0 31.3 2.2 2.6 4.0 4.0 5.6 1.9 2.4 2.6 3.0 4.8
Croatia 40.9 44.6 46.5 44.0 44.9 19.3 19.9 22.9 25.0 28.0 0.6 0.7 0.8 0.9 1.3
Romania 28.8 34.5 37.1 34.7 39.4 3.8 4.4 5.7 6.0 7.8 3.6 4.4 4.2 5.1 7.5
500 Jože P. Damijan, Matija Rojec and Maja Ferjančič
Table 3 Continuation
Contribution of
Non-EU OECD countries
South East Europe
(Albania, Macedonia, Serbia and Montenegro) TOTAL
1994-96 1996-98 1998-00 2000-02 2002-04 1994-96 1996-98 1998-00 2000-02 2002-04 1994-96 1996-98 1998-00 2000-02 2002-04
Czech Republic 13.0 10.7 11.0 10.8 9.1 3.7 3.0 3.1 3.1 2.5 100.0 100.0 100.0 100.0 100.0 Estonia 5.6 5.6 5.3 4.9 5.7 0.6 0.6 0.6 0.6 0.7 100.0 100.0 100.0 100.0 100.0 Hungary 27.9 23.8 22.1 22.2 18.4 6.5 5.3 5.6 5.5 4.3 100.0 100.0 100.0 100.0 100.0 Lithuania 29.1 24.9 22.6 22.8 19.0 3.9 3.3 3.2 3.2 2.7 100.0 100.0 100.0 100.0 100.0 Latvia 20.1 17.5 16.0 15.8 13.9 2.5 2.2 2.2 2.1 1.9 100.0 100.0 100.0 100.0 100.0 Poland 24.0 20.7 18.3 18.5 15.8 2.8 2.3 2.3 2.3 1.8 100.0 100.0 100.0 100.0 100.0 Slovakia 5.2 4.7 5.3 4.9 4.8 1.5 1.3 1.5 1.4 1.4 100.0 100.0 100.0 100.0 100.0 Slovenia 21.0 16.7 17.1 16.9 13.0 3.4 2.7 2.8 2.7 2.1 100.0 100.0 100.0 100.0 100.0 Bulgaria 28.8 27.6 26.8 26.7 24.7 48.1 42.7 39.4 41.3 33.6 100.0 100.0 100.0 100.0 100.0 Croatia 31.6 28.3 23.5 23.9 20.7 7.6 6.4 6.4 6.3 5.1 100.0 100.0 100.0 100.0 100.0 Romania 45.7 41.4 37.8 38.6 33.1 18.1 15.3 15.2 15.6 12.1 100.0 100.0 100.0 100.0 100.0 CEEC-8 20.1 15.4 14.7 14.9 12.2 3.3 2.8 2.7 2.6 2.2 100.0 100.0 100.0 100.0 100.0 CEEC-3 35.5 32.7 30.4 30.1 26.2 26.3 21.1 16.5 21.2 17.0 100.0 100.0 100.0 100.0 100.0 All countries 25.1 18.5 20.1 17.4 15.3 24.1 8.8 15.8 13.3 13.4 100.0 100.0 100.0 100.0 100.0
Note: Contribution of individual groups of countries is calculated from bi-annual index of growth of foreign market access from equation (3). weighted by the share of individual groups of countries in total exports.
Source: Authors’ estimations.
3. The Importance of Supply Capacity Factors
In Section 1, we surveyed the most important determinants of domestic supply ca-pacity as identified in the literature. In this section, we empirically take these deter-minants into account. We contribute to the field by accounting for the impact of indi-vidual determinants on the evolution of the supply capacity of the transition coun-tries; that is, we account for the impact of structural changes, productivity growth, FDI penetration, and institutional (transition) changes on supply capacity in the mod-el. Existing studies have not included these factors as explanatory variables of supply capacity in the model. We suppose that the factors determining export performance are decomposed into the foreign market access and supply capacity factors as fol-lows:
i ij
ij f SC FMAX , (4)
As shown in equation (3), the foreign market access variable is a composite variable:
j j ij ij ij ij
ij gGDP GDPpc Dist Bord Lang Region
FMA , , , , , (5)
501
The Growing Export Performance of Transition Economies: EU Market Access versus Supply Capacity Factors
are usually picked up by the distance variable. There are also some other factors fos-tering bilateral trade, such as similarity in consumer preferences, a common language and cultural similarities, which we usually claim to control for by including dummy variables for countries’ having a common border, language, and region.
On the other hand, the variables affecting supply capacity are those affecting the economic potential of the exporting country and its ability to adjust to the chang-ing global demand patterns. Supply capacity can hence be written as a function:
i i i i i i i
i hGDP GDPpc FDI C Tech I ER
SC , , , , , , (6)
where GDP and GDP per capita explain the economic potential of the exporting country, while FDI, the productivity level (Ci), level of technological development
(Techi), the real exchange rate (ERi), and institutional changes (Ii) affect the
export-ing country’s ability to adjust to the changexport-ing global demand patterns.
Therefore, the model we estimate to verify the importance of the above supply capacity factors for CEEC export performance is as follows:
ijt it it it
ijt FMA GDP FDI C
X 1ln 2ln 1 3ln 1 4
ln
it it it
it Tech TI u
ER
5
6
7(7)
where FMAij accounts for the foreign market’s characteristics contained in (5). We
include FDI as a share of FDI stock in gross fixed capital formation (FDI/GFCFi_1).
Due to possible endogeneity, that is, the correlation with the current export flow, we include both GDP and FDI lagged by one year. As GDP per capita and country’s productivity level are strongly correlated, in estimating (7), we omit the GDP per capita variable. We instead employ the productivity variable, which is more precise in defining the manufacturing productivity level. Productivity level (
C
i) is measured in terms of a unit labor cost (ULC)3. The level of technological development (Techi)is measured as a share of medium-high- and high-tech industries in a country’s total exports (Sh_MH techi). Finally, the quality and changes in a country’s institutional
setup are proxied by one of the two standard EBRD indices, that is, the EBRD transi-tion index for trade and foreign exchange systems or the EBRD transitransi-tion index (an average of individual indices). These EBRD indices are usually employed in similar studies in order to control for the progression of trade liberalization or progression of market reforms in individual countries. Both indices are scaled from 1 to 4, whereby the highest score of 4 indicates full liberalization or that market reforms have been fully implemented.
The gravity model (7) is estimated both in levels as well as in first differences. The estimations in levels indicate the importance of individual supply capacity fac-tors for the level of export performance with individual importing countries. We fol-low the approach of Egger (2003), who suggests estimating the gravity model using the full data set pooled over years and individual countries in order to make use of
3
502 Jože P. Damijan, Matija Rojec and Maja Ferjančič
the full set of information contained in the data. We therefore employ standard panel data techniques, such as random- and fixed-effects models, in order to take into ac-count a ac-country pair’s individual (fixed or random) effects. The random-effects esti-mator has been proven by the standard Hausman test as being the more efficient es-timator of the two. We therefore present only results obtained by using the random-effects estimator on data in levels and results obtained by OLS on using the data in first differences. Note that the latter approach is warranted due to the fact that by first-differencing (7), the country-fixed effects are wiped out.
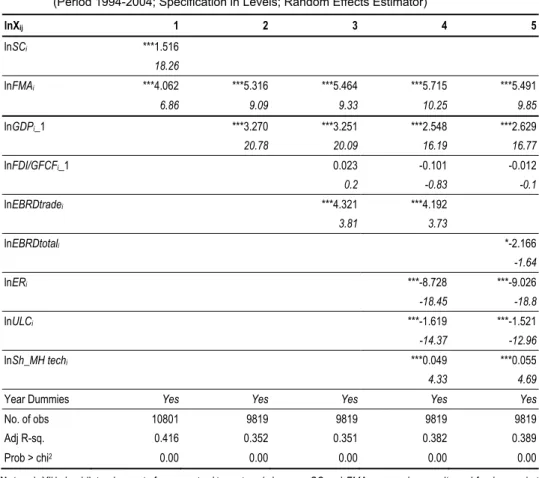
Table 4 Estimation Results for Gravity Model with Supply Capacity Factors for CEEC (Period 1994-2004; Specification in Levels; Random Effects Estimator)
lnXij 1 2 3 4 5
lnSCi ***1.516
18.26
lnFMAi ***4.062 ***5.316 ***5.464 ***5.715 ***5.491
6.86 9.09 9.33 10.25 9.85
lnGDPi_1 ***3.270 ***3.251 ***2.548 ***2.629
20.78 20.09 16.19 16.77
lnFDI/GFCFi_1 0.023 -0.101 -0.012
0.2 -0.83 -0.1
lnEBRDtradei ***4.321 ***4.192
3.81 3.73
lnEBRDtotali *-2.166
-1.64
lnERi ***-8.728 ***-9.026
-18.45 -18.8
lnULCi ***-1.619 ***-1.521
-14.37 -12.96
lnSh_MH techi ***0.049 ***0.055
4.33 4.69
Year Dummies Yes Yes Yes Yes Yes
No. of obs 10801 9819 9819 9819 9819
Adj R-sq. 0.416 0.352 0.351 0.382 0.389
Prob > chi2 0.00 0.00 0.00 0.00 0.00
Notes: lnXij is log bilateral exports from country i to partner j plus one. SC and FMA are supply capacity and foreign market access coefficients estimated in (1). FDI/GFCFi_1 is FDI as a share of FDI stock in gross fixed capital formation, EBRDtrade
and EBRDtotal indicate an EBRD transition index for trade and foreign exchange system and an overall EBRD transition
index. ER is the exchange rate. ULC is the unit labor cost, defined as the ratio of the labor cost to the labor productivity level. Sh_MH techi is the share of medium-high- and high-tech industries in a country’s total exports.
t-statistics in italics; ***. **. and * denote the significance of parameters at 1%. 5% and 10%, respectively.
Source: Authors’ estimations.
503
The Growing Export Performance of Transition Economies: EU Market Access versus Supply Capacity Factors
provide some kind of robustness check for our estimations. In the first model, both the supply capacity and foreign market access variables, which have been estimated previously by estimating model (1), are shown to have a significant impact on ex-ports. In the second model, we swapped the composite supply capacity variable for one of its components, that is, the GDP level of the exporting country, whereas in the third model, we add FDI and the EBRD transition index for the trade and foreign exchange system. The exporting country’s GDP level and its institutional setup are shown to have a strong impact on its export performance. Among other determinants of supply capacity (see models 4 and 5), one can confirm negative impacts of real exchange rate appreciation and of a lower productivity level on export flows. Interes-tingly, FDI and the resulting technological restructuring do not seem to affect the level of exports. However, the level of exporting country technological development (measured as a share of medium-high- and high-tech industries in exports) does con-tribute positively to a country’s export performance.
Before making any conclusions, we proceed by estimating the model in first differences, that is, growth rates. This is not done only to eliminate the country pair’s fixed effects; rather, this is done predominantly because it allows us to take into ac-count the impact of changes in the ac-country’s supply capacity on the growth of ex-ports. We are especially interested in uncovering how indigenous productivity growth, technological restructuring, FDI, and changes in the institutional setup affect a country’s export performance. The results in Table 5 are reassuring. First, the re-sults demonstrate that the CEECs with higher levels of accumulated FDI do exhibit much larger growth of exports. This finding points towards the dynamic aspect of FDI, that is, that FDI does foster manufacturing restructuring and creates the eco-nomic potential for future export growth.4 Second, changes in the institutional setup (measured by the EBRD trade index or the EBRD overall transition index) do signif-icantly increase the growth rates of exports. Therefore, the more ambitious CEECs in terms of their ongoing structural reforms and their building of a stable institutional setup are more successful in fostering export growth. Third, the successful restructur-ing of individual CEECs shows up in lower labor unit costs, which in turn improve the competitiveness of exporters and increase exports.
Based upon the above empirical findings, one can draw important policy con-clusions. It is obvious that openness and unrestricted access to many foreign markets increase the capacity of a country regarding its successful export performance. It is, however, of extreme importance that countries work on their internal supply capacity improvements in order to build their export performance. The key policy measures that should be focused on by less-developed transition countries (the CEEC-3, candi-date countries for EU membership, and the successor states of the former Soviet Un-ion) are predominantly the building of a stable institutional setup, ongoing structural reforms, and targeted FDI penetration.
4
504 Jože P. Damijan, Matija Rojec and Maja Ferjančič
Table 5 Estimation Results for Gravity Model with Supply Capacity Factors for CEEC (for the Period 1994-2004; Specification in First Differences; OLS Estimator)
dXij 1 2 3 4 5
dGDPi **3.222 ***4.551 ***4.744 **3.703 ***4.532
2.34 2.9 3.36 2.43 2.93
dFMAi -0.819 -0.651
-0.78 -0.62
lnFMAi ***1.119 ***1.089 ***1.185
6.34 6.12 6.58
dFDI/GFCFi 0.299
1.21
lnFDI/GFCFi_1 ***0.217 ***0.207 ***0.241
2.99 2.79 3.22
dEBRDtradei **2.209 **2.487 *2.112
2.23 2.52 2.11
dEBRDtotali ***7.081
3.77
dER1i **-1.305 **-1.235
-2.11 -2.01
dULC1i ***-0.191 ***-0.196
-2.81 -2.89
dMHTi -0.177 0.075
-0.5 0.21
Year Dummies Yes Yes Yes Yes Yes
No. of obs 9818 9818 9818 9818 9818
Adj R-sq. 0.056 0.056 0.060 0.062 0.063
Prob > chi2 0.00 0.00 0.00 0.00 0.00
Notes: dXij is rate of growth of bilateral exports from country i to partner j plus one. t-statistics in italics; ***. **. and * denote the significance of parameters at 1%. 5% and 10%, respectively.
Source: Authors’ estimations.
4. Conclusions
in-505
The Growing Export Performance of Transition Economies: EU Market Access versus Supply Capacity Factors
creased remarkably in the period 1994-2004. Within foreign market access, improv-ing access to 15 markets has been decisive, but the growth of exports to the EU-15 has contributed significantly more to the overall export growth of the CEEC-8 than it has to that of the CEEC-3. Compared to the CEEC-8, the CEEC-3 seem to have benefited much more from export growth to the non-EU OECD and South East Europe countries.
506 Jože P. Damijan, Matija Rojec and Maja Ferjančič
References
Aturupane, Chonira, Simeon Djankov, and Bernard Hoekman. 1997. “Determinants of Intra-Industry Trade between East and West Europe.” Policy Research Working Paper 1850.
Baldwin, Richard E. 1994. Towards an Integrated Europe. London: Centre for Economic Policy Research.
Bernard, Andrew B., and Bradford J. Jensen. 1998. “Understanding the U.S. Export Boom.” National Bureau of Economic Research Working Paper 6438.
Bussiere, Matthieu, Jarko Fidrmuc, and Bernd Schnatz. 2005. “Trade Integration of Central and Eastern European Countries: Lessons from a Gravity Model.” European Central Bank Working Paper 545.
Collins, Susan M., and Dani Rodrik. 1991. Eastern Europe and the Soviet Union in the World Economy. Washington D.C.: Institute for International Economics.
Crespo, Nuno, and Maria P. Fontoura. 2007. “Integration of CEECs into EU Market:
Structural Change and Convergence.” Journal of Common Market Studies, 45(3):
611-632.
Damijan, Jože P., and Matija Rojec. 2004. “Foreign Direct Investment and the Catching-up Process in New EU Member States.” The Vienna Institute for International
Economic Studies Research Reports 310.
Dulleck, Uwe, Neil Foster, Robert Stehrer, and Julia Woerz. 2004. “Dimensions of Quality Upgrading in CEECs.” The Vienna Institute for International Economic Studies Working Paper 29.
European Bank for Reconstruction and Development - EBRD. 1999. Transition Report 1999. London: EBRD.
European Bank for Reconstruction and Development - EBRD. 2000. Transition Report 2000. London: EBRD.
European Bank for Reconstruction and Development - EBRD. 2002. Transition Report 2002. London: EBRD.
European Bank for Reconstruction and Development - EBRD. 2003. Transition Report 2003. London: EBRD.
European Bank for Reconstruction and Development - EBRD. 2004. Transition Report 2004. London: EBRD.
European Bank for Reconstruction and Development - EBRD. 2005. Transition Report 2005. London: EBRD.
Egger, Peter. 2003. “An Econometric View on the Estimation of Gravity Models and the
Calculation of Trade Potentials.” The World Economy, 25(2): 297-312.
Fidrmuc, Jarko, and Jan Fidrmuc. 2003. “Disintegration and Trade.” Review of International Economics, 11(5): 811-829.
Fugazza, Marco. 2004. “Export Performance and Its Determinants: Supply and Demand Constraints.” Policy Issues in International Trade and Commodities Study Series 26.
Gőrg, Holger, and David Greenaway. 2004. “Much Ado About Nothing: Do Domestic
Firms Really Benefit from Foreign Direct Investment.” World Bank Research
507
The Growing Export Performance of Transition Economies: EU Market Access versus Supply Capacity Factors
Halpern, Laszlo. 2002. “International Trade, Competitiveness and Catching Up in Transition
Countries – Some Recent Developments and Policies for Improvement.” In Catching
Up and EU Accession – Conditions for Fast Real Convergence in the Candidate Countries, ed. Vladimir Benaček and Janos Gacs, 59-63. Laxenburg: IIASA.
Hamilton, Carl B., and Alan L. Winters. 1992. “Opening up International Trade with
Eastern Europe.” Economic Policy, 7(14): 77-116.
Havlik, Peter. 2000. “Trade and Cost Competitiveness in the Czech Republic, Hungary, Poland and Slovenia.” World Bank Technical Paper 482.
Havlik, Peter. 2005. “Structural Change, Productivity and Employment in the New EU Member States.” The Vienna Institute for International Economic Studies Research Report 313.
Havlik, Peter, Michael Landesmann, and Robert Stehrer. 2001. “Competitiveness of CEE Industries: Evidence from Foreign Trade Specialization and Quality Indicators.” The Vienna Institute for International Economic Studies Research Report 278.
Havrylyshyn, Oleh, and Hassan Al-Atrash. 1998. “Opening Up and Geographic Diversification of Trade in Transition Economies.” International Monetary Fund Working Paper WP/98/22.
Havrylyshyn, Oleh, and Lant Pritchett. 1991. “European Trade Patterns after the
Transition.” World Bank Policy, Research and External Affairs Working Paper 748.
Hoekman, Bernard, and Simeon Djankov. 1996. “Intra-Industry Trade, Foreign Direct Investment, and the Reorientation of Eastern European Exports.” World Bank Policy Research Working Paper 1652.
Institute for Management Development - IMD. 2004. IMD World Competitiveness Yearbook 2004. Lausanne: IMD.
Jakab, Zoltan, Mihaly A. Kovacs, and Andras Oszlay. 2001. “How Far has Trade Integration Advanced? An Analysis of the Actual and Potential Trade of Three
Central and Eastern European Countries.” Journal of Comparative Economics,
29(2): 276-292.
Kaminski, Bartolomiej. 1993. “How the Market Transition Affected Export Performance in the Central European Economies.” World Bank Policy Research Working Paper 1179.
Kaminski, Bartolomiej. 1994. “The Significance of the Europe Agreements for Central European Industrial Exports.” World Bank Policy Research Working Paper 1314.
Kaminski, Bartolomiej, and Francis Ng. 2001. “Trade and Production Fragmentation: Central European Economies in European Union Networks of Production and Marketing.” World Bank Policy Research Working Paper 2611.
Kaminski, Bartolomiej, Zhen K. Wang, Alan L. Winters, Andre Sapir, and Istvan P. Szekely. 1996a. “Export Performance in Transition Economies.”Economic Policy,
11(23): 421-442.
Kaminski, Bartolomiej, Zhen K. Wang, and Alan L. Winters. 1996b. “Foreign Trade in The Transition: The International Environment and Domestic Policy.” World Bank Studies of Economies in Transformation 20.
508 Jože P. Damijan, Matija Rojec and Maja Ferjančič
Redding, Stephen, and Anthony J. Venables. 2003. “Geography and Export Performance: External Market Access and Internal Supply Capacity.” National Bureau of Economic Research Working Paper 9637.
Redding, Stephen, and Anthony J. Venables. 2004. “Economic Geography and
International Inequality.” Journal of International Economics, 62(1): 53-82.
Rodrik, Dani, Arvind Subramanian, and Francesco Trebbi. 2002. “Institutions Rule: The Primacy of Institutions over Geography and Integration in Economic Development.” National Bureau of Economic Research Working Paper 9305.
Rojec, Matija, Jože P. Damijan, and Boris Majcen. 2004. “Export Propensity of Estonian
and Slovenian Manufacturing Firms.” Eastern European Economics, 42(4): 33-54.
Rosati, Dariusz. 1992. “Problems of Post-CMEA Trade and Payments.” Center for Economic Policy Research Discussion Paper 650.
Stare, Metka, and Luis Rubalcaba-Bermejo. 2009. “International Outsourcing of Services:
What Role for Central and East European Countries?” Emerging Market Finance
and Trade, 45(5): 31-46.
United Nations Conference on Trade and Development - UNCTAD. 2002. Trade and Development Report 2002. New York and Geneva: UNCTAD.
United Nations Conference on Trade and Development - UNCTAD. 2003. Handbook of Statistics 2003, Trade Structure by Product and Country Group. New York and Geneva: UNCTAD.
Zinnes, Clifford, Yair Eilat, and Jeffrey Sachs. 2001. “Benchmarking Competitiveness in
509
The Growing Export Performance of Transition Economies: EU Market Access versus Supply Capacity Factors
Appendix
Main Export Related Indicators of CEEC-8, CEEC-3, EU-15 and World in 1990-2004 (in mill. EUR Current Prices and %)
1990 1991 1992 1993 1994 1995 1996 1997 1998 1999 2000 2001 2002 2003 2004
WORLD
Exports of goods (in EUR) 2744364 2825290 2899256 3220729 3627651 3951773 4256672 4918471 4905154 5347581 6965078 6894386 6848770 6622691 7220908 Imports of goods (in EUR) 2836352 2922542 2980536 3275259 3676185 3995077 4322374 4996528 5012916 5473587 7178605 7121075 7009480 6794693 7437393 Exports index (1990=100) 100 103 106 117 132 144 155 179 179 195 254 251 250 241 263 Exports as % of GDP 16.1 15.4 15.5 15.3 16.2 17.6 18.0 18.7 18.5 18.6 20.4 19.7 19.9 20.5 22.0 EU-15
Exports of goods (in EUR) n.a. 1201850 1224991 1247462 1396704 1572823 1665205 1856468 1944269 2033628 2411635 2473163 2481826 2453286 2639310 Imports of goods (in EUR) n.a. 1232648 1235180 1183345 1319305 1476558 1547433 1720310 1835065 1969006 2394873 2398083 2358467 2351142 2564615 Exports index (1991=100) n.a. 100 102 104 116 131 139 154 162 169 201 206 207 204 220 Exports as % of GDP n.a. 20.5 20.0 20.3 21.7 23.4 23.6 25.0 25.1 24.9 27.7 27.4 26.5 25.8 26.6 Exports as % of World imports n.a. 41.1 41.1 38.1 38.0 39.4 38.5 37.2 38.8 37.2 33.6 34.7 35.4 36.1 35.5 CEEC-8
Exports of goods (in EUR) 31357.9 32296.8 34753.6 44575.1 52126.4 61702.7 66691.1 81695.5 94109.4 98758.6 129082.4 148052.8 159724.4 173113.3 209204.6 Imports of goods (in EUR) 28150.7 33433.8 38384.9 53203.6 61423.5 74031.2 89023.1 108973.8 122628.0 127080.8 162833.3 179233.4 189009.4 200259.2 235200.5 Exports index (1990=100) 100.0 103.0 110.8 142.1 166.2 196.8 212.7 260.5 300.1 314.9 411.6 472.1 509.4 552.1 667.2 Exports as % of GDP n.a. n.a. n.a. n.a. n.a. 29.3 27.9 30.3 32.4 32.5 36.7 37.4 37.8 41.5 46.0 Exports as % of World imports 1.11 1.11 1.17 1.36 1.42 1.54 1.54 1.64 1.88 1.80 1.80 2.08 2.28 2.55 2.81 Exports to EU-15 as % of EU-15
total imports n.a. 1.54 1.75 2.14 2.34 2.53 2.53 2.87 3.34 3.47 3.69 4.19 4.57 4.94 5.38 Exports to EU-15 as % of total
exports 46.0 58.9 62.2 56.8 59.2 60.6 58.8 60.4 65.1 69.1 68.4 67.8 67.5 67.1 65.9 CEEC-3
Exports of goods (in EUR) 17887 8766 9771 10588 12117 13854 13955 15503 15264 15747 21344 23647 25925 27750 33372 Imports of goods (in EUR) 20990 9793 11649 13267 13891 18134 19393 22414 22471 22397 29909 35744 38617 43358 51242 Exports index (1990=100) 100 49 55 59 68 77 78 87 85 88 119 132 145 155 187 Exports as % of GDP n.a. n.a. n.a. n.a. n.a. n.a. n.a. n.a. 22.8 23.8 21.3 25.9 26.4 26.9 25.7 Exports as % of World imports 0.63 0.30 0.33 0.32 0.33 0.35 0.32 0.31 0.30 0.29 0.30 0.33 0.37 0.41 0.45 Exports to EU-15 as % of EU-15
total imports n.a. 0.28 0.32 0.38 0.45 0.47 0.45 0.46 0.47 0.46 0.52 0.61 0.68 0.74 0.78 Exports to EU-15 as % of total
510 Jože P. Damijan, Matija Rojec and Maja Ferjančič
![Table 1 Bilateral Trade Equation Estimation (with Country and Partner Dummies) for CEEC [Period 1994-2004, OLS Estimator]](https://thumb-eu.123doks.com/thumbv2/123dok_br/18259790.343268/7.688.78.617.118.821/bilateral-equation-estimation-country-partner-dummies-period-estimator.webp)