Maria Paula Fontoura & Pedro Serôdio
THE EXPORT PERFORMANCE OF THE
2004 EU ENLARGEMENT ECONOMIES
SINCE THE 1990S: A CONSTANT
MARKET SHARE ANALYSIS
WP16/2016/DE/UECE
_________________________________________________________ De pa rtme nt o f Ec o no mic s
W
ORKINGP
APERS1
THE EXPORT PERFORMANCE OF THE 2004EUENLARGEMENT ECONOMIES SINCE THE
1990S:ACONSTANT MARKET SHARE ANALYSIS*
Maria Paula FontouraISEG, Lisbon School of Economics and Management, University of Lisbon* and UECE (Research Unit on Complexity and Economics)
Pedro Serôdio
ISEG, Lisbon School of Economics and Management, University of Lisbon
ABSTRACT
This study focuses the export performance of the 2004 EU enlargement economies between 1990 and 2013. The long time span analysed allows to capture different stages in the relationship of these new members with the EU before and after accession. The study is based on the Constant Market Share methodology of decomposing an ex-post country’s export performance into different effects. Two different Constant Market Share Analysis (CMSA) were selected in order to disentangle, for the exports of the new members to the EU15, (i) the growth rate of exports and (ii) the growth rate of exports relatively to the world. Both approaches are applied to manufactured products first without disaggregating results by sectors and then grouping all products into two different classification of sectors: one considering the technological intensity of manufactured exports and another evaluating the specialization factors of the products exported. Results provide information not only on the
ten economies’ export performance as a group but also individually considered and on the importance of each EU15 destination market to the export performance of these countries.
KEYWORDS: Export performance, Constant Market Share, European Union, 2004 European
Union Enlargement
JEL CLASSIFICATION:C43,F10,F14
2 Introduction
On May 1st 2004, a treaty of accession between the first fifteen Member States of the European Union (hereinafter “EU15”) and ten aspiring new Member States came into force. Geographically located in central and Eastern Europe, these ten aspiring countries included three former Soviet republics (Estonia, Latvia, and Lithuania), four former Soviet satellites (Poland, the Czech Republic, Hungary and Slovakia), a former Yugoslav republic (Slovenia) and two Mediterranean islands (Cyprus and Malta).
On the part of the accession countries, the 2004 EU enlargement led to high expectations of an increasing economic growth by having access to an economic union with high purchasing power This study will focus in one of the major key-points to promote a
country’s economic growth: the export performance. The period analysed is a long time span, between 1990 and 2013, in order to capture different stages in the relationship of these new members with the EU before and after accession. The total period is decomposed into four sub-periods1, as follows. (i) From 1990 to 1996, corresponding to the phase of the fall of the Soviet Union and the applications of these ten countries for the accession to the EU, being this sub-period not only a transition period but also a control period, in which accession negotiations had not yet started. (2) From 1996 to 2004, corresponding to the enlargement process. To prepare for EU membership, the EU supported the work of the candidate countries to adopt the Community's rules through a pre-accession strategy previously signed which included financial assistance for developing their institutions, infrastructure and economies. (3) From 2004 to 2008, corresponding to the period between the accession and the financial crisis. (4) From 2008 to 2013, a period marked by the economic crisis of 2008.
1 See
EUR-Lex (2007). The 2004 enlargement: the challenge of a 25-member EU. Available at:
3
In order to evaluate these ten economies’ export performance to the EU15, this study
makes use of the Constant Market Share Analysis (hereinafter “CMSA”)2. This technique decomposes a country´s export performance into separate components, comprehending not only product and market structure components of exports but also a residual effect associated to competitiveness. Two different CMSA will be used, thus enabling a broad evaluation of
the effective changes of these ten economies’ export performance.
The first CMSA is based on Leamer & Stern (1970) and allows to breakdown the variation of a country´s growth of exports; the second CMSA is based on Nyssens & Poullet (1990) and decomposes a country´s growth rate of exports relatively to the world.
We consider the exports of 72 manufactured products as defined by the CHELEM database. Exports are given in value terms, in millions of US dollars.3.
Results are presented for the whole set of the 72 products and by grouping them in two different classification of sectors based on Fernandes (2002), as shown in the appendix. The first is based on the classification of the Organisation for Economic Co-operation and
Development (hereinafter “OECD”) for technological intensity and is composed by three
sectors: low, medium and high technological intensity. The second is based on the OECD’s
classification for specialization factors and is composed by five sectors: natural resources, labour costs, scale economies, product differentiation and R&D.
This study is organised as follows. Section 2 explains the methodology. Section 3 examines the results extensively by dividing them into four different subsections: one focusing on the different disentangled effects of both CMSA for the whole set of countries
2 Although CMCA is a frequently used method to evaluate export performance, few studies apply it to the 2004 enlargement countries. Recently, Pavlickova (2013) used it for Slovak exports to the EU27.
3 A drawback of using nominal values is that it is not possible to distinguish between the volume and the price
4
and sectors; a second one assessing the results for the two abovementioned classification of sectors for manufactured goods; a third one evaluating individually each of the ten
economies’ export performance; and a fourth one analysing the importance of each EU15 destination market in the competitiveness effect of these ten countries. Section 4 concludes.
Methodology: Constant Market Share Analysis
One of the first and most influential versions of the CMSA was made by Leamer & Stern (1970). This version specifically focuses on the effects underlying the percentage change of exports of a country. Notwithstanding, several reservations have been pointed out to this approach, especially by Richardson (1971). The main critique is that the product and market effects are calculated in an asymmetric way, and depending on which one is calculated first, one of them will include the interaction between the two effects (Richardson, 1971; Cheptea et al, 2005).To solve this problem, Milana (1988) proposed to calculate this interaction effect (mixed effect) explicitly, a correction that has been largely applied ever since, for instance by the European Central Bank4 (2005) and Amador & Cabral (2008).
Currently, several CMSA have been used in order to evaluate the export performance of a country. One of these versions was proposed by Nyssens & Poullet (1990) and allows to evaluate the change of a country’s share of exports relatively to the world. In this study, we apply the versions of Leamer & Stern (1970) and Nyssens & Poullet (1990) with the interaction term proposed by Milana (1988) in both cases.
Decomposing the growth rate of exports
The Leamer & Stern (1970) CMSA version decomposes the export performance of a country (group of countries) taking into consideration the growth rate of exports.
The CMSA identity is expressed as:
5
𝛴𝑖𝛴𝑗𝑋𝑖𝑗,𝑡− 𝛴𝑖𝛴𝑗𝑋𝑖𝑗,𝑡−1
𝛴𝑖𝛴𝑗𝑋𝑖𝑗,𝑡−1 =
𝛴𝑖𝛴𝑗𝑆𝑖𝑗,𝑡−1∆𝑋𝑖𝑗∗
𝛴𝑖𝛴𝑗𝑋𝑖𝑗,𝑡−1 +
𝛴𝑖𝛴𝑗 ∆𝑆𝑖𝑗𝑋𝑖𝑗,𝑡∗
𝛴𝑖𝛴𝑗𝑋𝑖𝑗,𝑡−1
TOTAL EFFECT STRUCTURE
EFFECT
COMPETITIVENESS
EFFECT
where 𝑋 corresponds to the nominal value of a country’s exports; 𝑋∗ means the equivalent notion for world exports; 𝑖 is the category of manufactured goods (hereinafter “product"); 𝑗 corresponds to the EU15 destination market; 𝑡 − 1 and 𝑡 are the initial and final years, respectively; 𝑆 is the share of the analysed country’s exports in the world exports; ∆𝑋∗ is the variation in world exports in period t and ∆𝑆 in the variation in S in period t .
The total effect corresponds to the total growth rate of exports of manufactured goods of the new EU member(s) to the EU15. It can be decomposed into two main effects: the structure effect and the competitiveness effect.
The structure effect, which Leamer & Stern (1970) referred as the demand side of the phenomenon under study, expresses the part of the growth rate of exports due to the variation of the world exports (to the same destination market), given the export structure of the analysed country in terms of products and destination markets of the initial period.
The last term of the identity is the so-called competitiveness effect, which is commonly related to the exporter´s price and non-price competitiveness.
The structure effect, in turn, can be decomposed into the following three effects:
𝛴𝑖𝛴𝑗𝑆𝑖𝑗,𝑡−1∆𝑋𝑖𝑗∗
𝛴𝑖𝛴𝑗𝑋𝑖𝑗,𝑡−1 =
𝛴𝑖𝑆𝑖,𝑡−1∆𝑋𝑖∗
𝛴𝑖𝛴𝑗𝑋𝑖𝑗,𝑡−1 +
𝛴𝑗𝑆𝑗,𝑡−1∆𝑋𝑗∗
𝛴𝑖𝛴𝑗𝑋𝑖𝑗,𝑡−1 +
𝛴𝑖𝛴𝑗 𝑆𝑖𝑗,𝑡−1(∆𝑋𝑖𝑗∗−𝑋𝑖𝑗,𝑡−1 ∗
𝑋𝑖,𝑡−1∗ ∆𝑋𝑖∗−𝑋𝑖𝑗,𝑡−1 ∗
𝑋𝑗,𝑡−1∗ ∆𝑋𝑗∗)
𝛴𝑖𝛴𝑗𝑋𝑖𝑗,𝑡−1
STRUCTURE
EFFECT
PRODUCT
EFFECT
MARKET
EFFECT
MIXED STRUCTURE EFFECT
6
from the solution proposed by Milana (1988), which does not have a straightforward interpretation (ECB, 2005).
Decomposing the relative growth rate of exports
The second CMSA used in this study is adapted from Nyssens & Poullet (1990) and
also adopts Milana’s solution. In this case, the total effect is the difference between the
exports’ growth rate of a country (group of countries) and the exports’ growth rate of the rest of the world in the same destination market, weighted by the product and geographical structures of the exporting country(ies). It can be decomposed as follows:
Σ𝑖Σ𝑗𝜃𝑖𝑗𝑔𝑖𝑗 − Σ𝑖Σ𝑗𝜃𝑖𝑗∗𝑔𝑖𝑗∗ = Σ𝑖Σ𝑗𝑔𝑖𝑗∗(𝜃𝑖𝑗 − 𝜃𝑖𝑗∗) + Σ𝑖Σ𝑗 𝜃𝑖𝑗(𝑔𝑖𝑗 − 𝑔𝑖𝑗∗)
TOTAL EFFECT STRUCTURE EFFECT COMPETITIVENESS
EFFECT
where 𝑔𝑖𝑗 = 𝑋𝑖𝑗,𝑡− 𝑋𝑖𝑗,𝑡−1
𝑋𝑖𝑗,𝑡−1 is the export growth rate of a country of product 𝑖 to the destination
market 𝑗, in period t; 𝜃𝑖𝑗= 𝑋𝑖𝑗,𝑡−1
𝑋𝑡−1 is the share of product i to destination market j in total
exports of the analysed country, in period 𝑡 − 1 and 𝑔𝑖𝑗∗ and 𝜃𝑖𝑗∗ are the equivalent notions for world exports (excluding the reporting country). A positive (negative) total effect means a total market share gain (loss) of the analysed country in the destination market.
The total effect is decomposed into the structure and the competitiveness effects. The structure effect captures the difference between the export structure (by product and destination market) of the analysed country and the world weighted by the growth rate of world exports. It will be positive if the country’s export structure is more concentrated on high-growth products/markets than the world structure. Note that the term in brackets provides equivalent information to the traditional Balassa’s exports performance index of Revealed Comparative Advantage (Amador & Cabral, 2008).
7
compares the growth rates of the exports of the analysed country and the world that are not due to differences in the export structure.
The structure effect can be decomposed into three effects expressed as follows:
Σ𝑖Σ𝑗𝑔𝑖𝑗∗(𝜃𝑖𝑗− 𝜃𝑖𝑗∗) = Σ𝑖 𝑔𝑖∗(𝜃𝑖− 𝜃𝑖∗) + Σ𝑗𝑔𝑗∗(𝜃𝑗− 𝜃𝑗∗) + Σ𝑖Σ𝑗𝑔𝑖𝑗∗[(𝜃𝑖𝑗− 𝜃𝑖𝑗∗) −𝜃𝑖𝑗
∗
𝜃𝑖∗(𝜃𝑖− 𝜃𝑖
∗) −𝜃𝑖𝑗∗
𝜃𝑗∗(𝜃𝑗− 𝜃𝑗
∗)]
STRUCTURE
EFFECT
PRODUCT
EFFECT
MARKET
EFFECT
MIXED STRUCTURE EFFECT
The product (market) effect evaluates which part of the structure effect is due to the product (market) specialization of the country analysed. The mixed structure effect is the residual term comprising the interaction between the product and market effects as proposed by Milana (1988).
Main results
This section evaluates the export performance of the ten countries of the 2004 EU enlargement to the EU15, i.e. the total effect of the growth rate and the relative growth rate methodologies above presented (hereinafter referred as growth rate and total growth rate, respectively). Market share variation is also presented, though it is not decomposed.
Overall assessment
As expected, this new group of EU members had a major improvement in their export performance to the EU15 from 1990 to 2013, as shown in table 1. In these past twenty three years, the exports of manufactured goods to the EU15 increased more than 285 billion USD, corresponding to a growth rate of 1118.3%, and a market share increase in the EU15 of 4.56%, reaching 6.25% of the EU15’s market share in 2013.
8
The lowest performance occurred in the aftermath of the economic crisis of 2008, as expected.
With respect to the effects obtained with the decomposition performed in each CMCA, in table 1 we observe that the competitiveness effect played a dominant and major
role in export performance over the whole period. This effect is mainly relevant in the pre-accession sub-period.
In the case of the market and product effects, it is necessary to consider separately the impact on the export growth and the relative export growth
TABLE 1
DECOMPOSITION OF THE EXPORT PERFORMANCE WITH THE CMSA(%)
1990-2013 1990-1996 1996-2004 2004-2008 2008-2013
MARKET SHARE VARIATION* 4.56 0.96 1.82 0.99 0.79
EXPORT
GROWTH
TOTAL EFFECT 1118.30 102.18 186.65 95.04 7.78
STRUCTURE EF. 241.29 22.83 58.27 56.70 -9.83
Product Effect 222.17 23.72 62.72 52.33 -12.02
Market Effect 228.45 28.42 64.52 63.29 -4.76
Mixed Str. Ef. -209.32 -29.31 -68.97 -58.92 6.95
COMP.EF. 877.00 79.35 128.38 38.34 17.61
RELATIVE
EXPORT
GROWTH
TOTAL EFFECT 894.38 74.48 118.62 36.61 14.15
STRUCTURE EF. 13.32 -7.79 -11.59 -3.22 -4.88
Product Effect -3.35 -5.72 -7.13 -8.46 -7.19
Market Effect -6.47 -4.68 -11.67 2.95 -0.55
Mixed Str. Ef. 23.14 2.60 7.21 2.29 2.86
COMP.EF. 881.06 82.27 130.22 39.83 19.03
* Percentage variation in the ten countries’ market share (∆𝑆) in period 𝑡. Source: Own calculations from CHELEM database.
sub-9
periods analysed, the world was relatively more specialized in products and markets with dynamic demand.
Export performance by sectors
Taking now into account the ten countries’ export performance of manufactured goods to the EU15 by sectors according to their technological level (table 2), a positive progress in all sectors is acknowledgeable.
TABLE 2
CMSA BY TECHNOLOGICAL LEVEL (%)
MARKET
SHARE
VARIATION*
EXPORT GROWTH RELATIVE EXPORT GROWTH
TOTAL EF. STR.EF. COMP.EF. TOTAL EF. STR.EF. COMP.EF.
90-'13
LOW 2.03 527.77 242.35 285.42 222.45 47.13 175.32
MEDIUM 6.89 1768.12 221.94 1546.18 360.54 -7.90 368.44
HIGH 6.67 3172.95 244.25 2928.71 254.97 -25.57 280.54
90-'96
LOW 1.03 72.88 18.72 54.16 37.17 0.86 36.31
MEDIUM 1.05 130.68 23.78 106.89 22.18 -3.27 25.45
HIGH 1.14 249.48 43.55 205.94 15.30 -4.52 19.83
96-'04
LOW 0.59 79.19 45.05 34.14 20.71 2.56 18.16
MEDIUM 2.56 250.07 65.22 184.85 47.67 -3.97 51.64
HIGH 2.88 357.33 66.61 290.71 40.78 -8.21 48.99
04-'08
LOW -0.02 79.35 66.17 13.19 -3.97 -8.08 4.10
MEDIUM 1.61 101.12 54.34 46.78 18.62 2.57 16.05
HIGH 2.11 98.16 39.31 58.86 17.24 1.15 16.09
08-'13
LOW 0.42 12.99 -3.66 16.65 3.25 -2.22 5.47
MEDIUM 1.67 15.02 -7.68 22.70 7.81 -0.79 8.59
HIGH 0.55 3.34 -7.75 11.09 1.88 -1.23 3.11
* Percentage variation in the ten countries’ market share (∆𝑆) in period 𝑡. Source: Own calculations from CHELEM database.
10
Looking closer into the different sub-periods, it is clear that the preparation for the accession to the EU had a positive impact on the technological development of exports from these countries to the EU15. Note, for instance, that the highest market share variation occurs in high tech products in all sub-periods but in the post 2008 crisis; however, this improvement is mainly evident in the pre-accession sub-period, followed by the post accession one.
Evaluating the different effects in table 2, it is noteworthy the important positive contribution of the competitiveness effect in both CMSA, mainly in the pre-accession sub-period. This effect is higher for high and medium tech products and particularly in the case of the first. Not surprisingly, considering previous results, the structure effect impacts positively in export growth, even if it is lower than the previous effect, and negatively on relative export growth of medium and high technology intensity in all sub-periods but the one from 2004 to 2008. The inversion in this last period expresses the increased demand.
Turning now to the analysis by specialization factors, table 3 shows that this group of countries improved their export performance to the EU15 in all sectors but in those based in natural resources in the immediate post-accession period.
Interestingly enough, preparation for accession gave an impetus to the R&D intensive exports as this sector registered the best export performance in this period, followed by product differentiation and scale economies sectors. In the pre-accession sub-period, export growth and relative export growth of these sectors clearly surpassed the labour cost sector.
11
TABLE 3
CMSA BY SPECIALIZATION FACTORS (%) MARKET
SHARE
VARIATION*
EXPORT GROWTH RELATIVE EXPORT GROWTH
TOTAL EF. STR.EF. COMP.EF. TOTAL EF. STR.EF. COMP.EF.
90-'13
NAT.RES. 1.08 490.97 321.49 169.48 80.90 32.85 48.05
L.COSTS 3.91 543.66 167.74 375.92 124.81 17.35 107.47
SCALE ECON. 7.62 1859.67 187.36 1672.31 293.25 -10.12 303.37
PROD.DIF. 9.58 2308.10 230.95 2077.15 195.59 -1.72 197.31
R&D 4.44 2402.79 252.15 2150.64 143.41 -24.69 168.10
90-'96
NAT.RES. 0.08 21.88 12.18 9.70 2.54 -1.33 3.88
L.COSTS 2.33 124.15 25.45 98.70 31.07 2.25 28.82
SCALE ECON. 1.12 141.25 24.91 116.33 18.45 -2.74 21.19
PROD.DIF. 2.26 258.82 35.99 222.84 20.84 -0.39 21.23
R&D 0.40 117.02 33.14 83.89 1.75 -4.72 6.47
96-'04
NAT.RES. 0.40 82.34 59.78 22.56 3.24 -0.09 3.33
L.COSTS 0.80 68.44 33.23 35.21 14.24 2.55 11.69
SCALE ECON. 2.38 238.76 65.19 173.57 35.11 -3.17 38.28
PROD.DIF. 4.50 255.30 60.35 194.95 36.15 2.07 34.08
R&D 2.16 448.73 78.75 369.98 20.41 -10.99 31.40
04-'08
NAT.RES. 0.00 96.50 79.47 17.03 -9.46 -11.12 1.66
L.COSTS 0.15 61.70 56.00 5.70 3.57 2.45 1.12
SCALE ECON. 2.00 111.59 53.86 57.73 17.29 1.88 15.41
PROD.DIF. 1.47 80.92 53.26 27.66 11.04 4.98 6.06
R&D 1.67 108.20 35.00 73.20 9.44 -2.54 11.99
08-'13
NAT.RES. 0.59 35.33 4.01 31.32 1.87 -2.25 4.12
L.COSTS 0.63 5.43 -3.66 9.09 1.46 -0.15 1.61
SCALE ECON. 2.12 13.33 -10.30 23.63 6.96 -0.31 7.27
PROD.DIF. 1.34 4.40 -1.45 5.86 1.86 0.71 1.15
R&D 0.21 0.94 -15.52 16.47 0.79 -2.23 3.03
* Percentage variation in the ten countries’ market share (∆𝑆) in period 𝑡 Source: Own calculations from CHELEM database.
12
intensive sectors in the first three sub-periods, product differentiation sectors since the pre accession period and scale economies sectors in the post-accession sub-period.
Export performance by countries
Previous results were obtained for the countries analysed as a whole. Yet, analysis by countries shows, according to table 45, a great amplitude of results in the export performance
of these ten economies.
TABLE 4
CMSA FOR EACH COUNTRY (1990-2013)(%)
MARKET
SHARE
GROWTH
RATE6
EXPORT GROWTH RELATIVE EXPORT GROWTH
TOTAL EF. STR.EF. COMP.EF. TOTAL EF. STR.EF. COMP.EF.
CY -16.51 175.70 183.78 -8.08 -104.96 -43.87 -61.08 CZ 658.91 2406.12 206.94 2199.18 2126.66 -23.74 2150.40 EE 452.22 1723.58 231.98 1491.60 783.35 2.16 781.19 HU 224.94 973.05 237.71 735.33 736.65 13.05 723.60 LV 6.70 252.34 629.37 -377.03 -18.77 445.08 -463.85 LT 154.86 741.61 662.81 78.79 393.42 458.04 -64.62 MT -30.34 130.02 113.65 16.38 -153.71 -113.07 -40.63 PL 344.23 1366.96 197.77 1169.19 1106.88 -24.32 1131.19 SK 1095.05 3846.38 205.89 3640.49 3364.54 -28.67 3393.21 SI -20.06 163.98 191.09 -27.12 -69.11 -36.91 -32.20 Source: Own calculations from CHELEM database.
On the one hand, we have the group of the best performing countries; in the overall period analysed - 1990-2013- they were, in terms of both the export growth and the relative export growth rates, by decreasing order, Slovakia, the Czech Republic, Estonia, Poland, Hungary and Lithuania. On the other hand, some countries registered negative relative export growth rates; it is the case of Latvia, Slovenia, Malta and Cyprus, being these last three the most affected, even showing negative market share growth rates.
5 See ISO codes for country names.
6 Due to the different sizes of these ten economies, the market share variation of the previous tables was
substituted by the market share growth rate. It is given by ∆𝑆
13
In terms of the different effects, analysis of table 4 puts into evidence the importance of the competitiveness effect for export growth of the best performing countries. An interesting result is this effect is negative in the case of all the worst performing countries above mentioned.
Regarding the structure effect, it is worth noting the positive influence for export growth in all countries and a negative one for the relative export growth rate in countries with a negative market share growth rate, namely Cyprus, Malta and Slovenia. Such underlines, respectively, the positive importance of the EU15 demand and the negative influence of the specialization pattern initially traced by these three countries, thus reinforcing by negative impact of a poor (negative) competitiveness performance. Other countries were also penalized by the initial specialization pattern but the change in their specialization pattern and increased competitiveness led to notable positive results for exports; it is the case of the Czech Republic, Poland and Slovakia.
Using the two sectoral classifications7 enlightens the previous picture. Briefly, we conclude that: (i) all countries but Malta had the highest (lowest) export growth and relative export growth rates in the high (low) technology sectors, considering the overall period analysed (1990-2013); (2) the best performing countries were able to grow from an export profile based on labour costs and/or natural resources to an export pattern based on other factors more prone to increase value added, as it is the case of R&D, product differentiation and scale intensive sectors8.
7 Given the physical limitation requested for this study, results for the CMSA by technological intensity and
specialization factors for each of the ten economies are not presented. They are available upon request.
8 Since the beginning of the transition process, these countries witnessed a remarkable increase in FDI flows,
mainly to Poland, the Czech Republic, Hungary, Slovenia and Slovakia which contributed to the restructuring
14
The export performance profile of the two best performing countries to the EU15 (the Czech Republic and Slovakia) illustrates previous results. In 1990, the highest exported category of goods of both countries was iron and steel, a scale economies intensive and low tech category of manufactured goods. In 2013, the two highest categories of manufactured goods exported were private automobiles and elements of automobile vehicles, with a medium technology level. In that final year, electrical products - a product differentiation and high tech intensive category of manufactured goods-, were Czech Republic’s third highest
export (and Slovakia’s fifth); computer hardware and engines was Czech Republic’s fourth and fifth highest export, respectively; while Slovakia’s fourth highest export was consumer electronics, i.e. a high tech and R&D intensive category of manufactured goods.
Relation between the destination market and the competitiveness effect
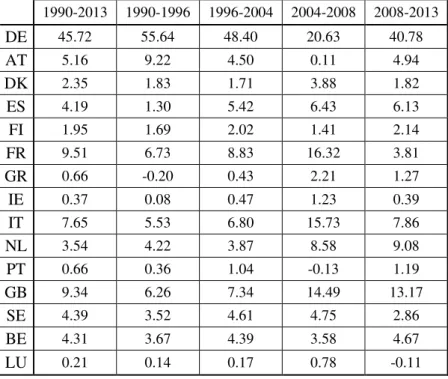
Finally, we have decomposed, in the export growth CMCA, the competitiveness effect of the ten States of the 2004 EU enlargement by destination market. The purpose is to evaluate how much of each EU15 destination market absorbs of the variation in the share of the EU enlargement exports over the world exports, i.e. the competitiveness effect. Table 5 presents the results for the ten economies aggregated.
The decomposition procedure was as follows:
𝛴𝑖 ∆𝑆𝑖𝑗𝑋𝑖𝑗,𝑡∗ 𝛴𝑖𝛴𝑗 ∆𝑆𝑖𝑗𝑋𝑖𝑗,𝑡∗
15
TABLE 5
WEIGHT OF EACH EU15 MARKET IN THE TEN COUNTRIES’ COMPETITIVENESS EFFECT*(%) 1990-2013 1990-1996 1996-2004 2004-2008 2008-2013
DE 45.72 55.64 48.40 20.63 40.78
AT 5.16 9.22 4.50 0.11 4.94
DK 2.35 1.83 1.71 3.88 1.82
ES 4.19 1.30 5.42 6.43 6.13
FI 1.95 1.69 2.02 1.41 2.14
FR 9.51 6.73 8.83 16.32 3.81
GR 0.66 -0.20 0.43 2.21 1.27
IE 0.37 0.08 0.47 1.23 0.39
IT 7.65 5.53 6.80 15.73 7.86
NL 3.54 4.22 3.87 8.58 9.08
PT 0.66 0.36 1.04 -0.13 1.19
GB 9.34 6.26 7.34 14.49 13.17
SE 4.39 3.52 4.61 4.75 2.86
BE 4.31 3.67 4.39 3.58 4.67
LU 0.21 0.14 0.17 0.78 -0.11
* in the export growth CMSA
Source: Own calculations from CHELEM database.
The same analysis was also performed for each country of the 2004 enlargement. Table 6 presents the results in the period from 1990 to 2013. The first line (C.E.) of that table indicates whether the respective 2004 enlargement country registered a positive or a negative competitiveness effect in the overall period.
In table 6 we detect an interesting pattern: the destination markets which absorbed most of the variation in the market share of the 2004 enlargement countries were those geographically closer. In fact, Germany was the most important destination market for the Czech Republic, Hungary, Poland and Slovakia’s competitiveness effect and Austria was the
most important for Slovenia’s competitiveness effect; considering the Baltic countries,
16
and Sweden. Distinctively, for Mediterranean countries were Greece, in the case of Cyprus, and Spain, in the case of Malta.
TABLE 6
WEIGHT OF EACH EU15 MARKET IN EACH TEN COUNTRIES’ COMPETITIVENESS EFFECT*(%)
CY CZ EE HU LV LT MT PL SK SI
C.E. - + + + - + + + + -
DE 109.39 48.20 -0.10 51.43 12.57 175.86 -64.24 43.61 44.32 140.65
AT -115.56 6.78 0.54 2.74 -0.49 11.24 2.65 1.69 9.36 -60.06
DK -37.84 1.45 4.84 1.71 -7.12 47.13 30.90 2.54 1.11% -7.91
ES 56.69 3.87 0.87 5.57 -0.88 -85.76 144.99 4.25 4.58 -0.22
FI 54.87 0.71 37.13 -0.05 -4.43 48.77 -0.78 1.13 0.73 -2.03
FR 77.03 8.33 4.30 8.43 5.41 79.00 0.51 10.05 10.62 5.29
GR -839.40 0.23 0.11 0.71 -0.21 3.27 79.23 0.47 0.34 -3.81
IE 72.91 0.48 0.34 0.31 1.64 10.75 3.89 0.37 0.24 1.80
IT 29.03 6.29 1.32 8.30% -1.48 56.13 -121.21 8.03 9.59 33.94
NL -153.21 7.43 0.56 5.60 103.45 -194.45 37.94 6.24 4.25 -4.52
PT -5.46 0.50 0.39 0.69 -0.12 8.54 12.77 0.65 0.54 -2.85
GB 1041.86 8.28 3.47 9.59 -6.00 -120.03 -54.27 11.89 8.03 -5.56
SE -19.93 2.14 40.73 1.29 1.10% 110.94 33.94 4.57 2.88 3.87
BE -165.08 5.17 5.46 3.43 -3.25 -51.91 -7.00 4.23 3.26 1.46
LU -5.28 0.14 0.05 0.25 -0.18 0.53 0.68 0.26 0.15 -0.04
* in the export growth CMSA for the1990 to 2013 period. Source: Own calculations from CHELEM database.
Conclusions
From the results of this study, we conclude that the 2004 enlargement countries, when aggregately considered, registered a major improvement in their export performance to the EU15 in all the considered periods from 1990 to 2013. This evolution is most notably in the pre-accession sub-period, as a result of reforms implemented by these countries and EU support preceding full membership.
17
were, in general, more specialized in products and destination markets with dynamic demand. Note, however, that with accession to a larger market in 2014 demand suffered a positive push observable in the reversal of the negative (relative) structure effect for several products, both traditional and recently developed. However, the 2008 economic crisis reversed for most products this positive trend.
We concluded that the best performing economies of the 2004 EU enlargement counteracted the unfavourable initial specialization pattern with a rapid change in their specialization pattern and increased competitiveness. Yet, even for the whole set of the 2004 enlargement countries, the highest export performance occurred in high tech exports of manufactured goods followed by medium tech exports while, concerning the specialization factors, stand out R&D, followed by product differentiation and scale economies, rather than natural resources or labour costs.
Divergent export performances between the ten countries were, nevertheless, observed. While Cyprus, Malta and Slovenia registered a negative market share growth rate to the EU15, which this study associates to a negative competitiveness effect and a unfavourable productive specialization in relation to global competitors, others displayed remarkable positive export performance, supported by increased competitiveness and alteration of the traditional specialization pattern. Such is the case of Slovakia and the Czech Republic, which present the highest values for both growth rates of exports considered in this study in the period 1990 to 2013. Estonia, Poland, Hungary and Lithuania also presented very positive results.
18
results are evaluated considering each of the ten economies of the 2004 enlargement, a geographical influence is also verifiable, suggesting that those countries tend to drive the most dynamic exports, i.e. those related to competitiveness gains, for countries geographically close.
APPENDIX
PRODUCT CLASSIFICATION BASED ON CHELEM DATABASE AND FERNANDES (2000)
Technological Level Specialization Factors
Low
BA Cement
Natural Resources
BA Cement
BB Ceramics EA Manufacture of wood
BC Glass EC Paper
CA Iron and Steel HC Not elsewhere specified minerals
CB First processing of iron IA Coal
DA Yarns and Fabrics IB Crude oil
DB Clothing IC Natural Gas
DC Garment IG Coke
DD Carpet IH Refined petroleum products
DE Leather JA Cereals
EA Manufacture of wood JB Other agricultural products
EB Furniture JC Inedible agricultural products
EC Paper KA Cereal-based products
ED Prints KB Fats
FA Metal structures KC Fish and Meat
FB Hardware KD Animal conserves
HA Iron ore KE Vegetable conserves
HC Not elsewhere specified minerals KF Sugar
IA Coal KG Animal feed
IB Crude oil KH Beverages
IC Natural Gas KI Manufactured tobaccos
IG Coke NA Jewellery
IH Refined petroleum products NB Non-monetary gold
JA Cereals
Labour Costs
CC Non-ferrous metallurgy
JB Other agricultural products DA Yarns and Fabrics
JC Inedible agricultural products DB Clothing
KA Cereal-based products DC Garment
KB Fats DD Carpet
KC Fish and Meat DE Leather
KD Animal conserves EB Furniture
KE Vegetable conserves FA Metal structures
KF Sugar FB Hardware
KG Animal feed HB Non-ferrous ores
KH Beverages Scale
Economies
BB Ceramics
19
NA Jewellery CA Iron and Steel
NB Non-monetary gold CB First processing of iron
Medium
CC Non-ferrous metallurgy ED Prints
FC Engines FS Elements of automobile vehicles
FD Farms Equipment FT Private automobiles
FE Machine tools FU Utility Vehicles
FF Construction Machines and Equipment FV Vessels
FJ Watchmaking GB Fertilizer
FS Elements of automobile vehicles GD Paintings
FT Private automobiles GE Toiletries
FU Utility Vehicles GG Plastics
FV Vessels GH Plastic articles
GA Basic mineral chemistry GI Rubber articles
GB Fertilizer HA Iron ore
GC Basic organic chemistry
Product Differentiation
FC Engines
GD Paintings FD Farms Equipment
GE Toiletries FE Machine tools
GG Plastics FF Construction Machines and Equipment
GH Plastic articles FG Specialised machinery
GI Rubber articles FJ Watchmaking
HB Non-ferrous ores FP Appliances
High
FG Specialised machinery FQ Electric material
FH Weapons FR Electrical products
FI Measuring instruments
R&D
FH Weapons
FK Optical instruments FI Measuring instruments
FL Electronic components FK Optical instruments FM Consumer electronics FL Electronic components
FN Telecommunications equipment FM Consumer electronics
FO Computer hardware FN Telecommunications equipment
FP Appliances FO Computer hardware
FQ Electric material FW Aeronautics and Space
FR Electrical products GA Basic mineral chemistry FW Aeronautics and Space GC Basic organic chemistry
GF Pharmaceuticals GF Pharmaceuticals
REFERENCES
Amador, J. & Cabral, S. (2008). The Portuguese export performance in perspective: constant market share analysis. Economic Bulletin, Banco de Portugal, 201-221.
Carstensen, K. And Toubal, F. (2004), Foreign Direct Investment in Central and Eastern
Countries: a dynamic panel analysis”, Journal of Comparative Economies, 3-22.
20
ECB (2005). Competitiveness and the export performance of the euro area. Occasional Paper Series, nº 30.
Fernandes, C. (2002). The Changes in International Trade Structure and the Evolution of
Portugal Trade Specialisation Compared to the “Triad”: the Challenges of
International Competitiveness, Paper delivered at the 5th International Workshop on
European Economy (CEDIN/ISEG, Lisbon, 22-23 November).
Jepma, C. (1981). An Application of the Constant Market Shares Technique on Trade between the Associated African and Malagasy States and the European Community (1958-1978). Journal of Common Market Studies, 20(2), 175-192.
Leamer, E. & Stern, R. (1970). Constant-Market-Share Analysis of Export Growth. In: Leamer, E. & Stern, R. (Eds.) Quantitative International Economics, 1st Ed. Chicago: Aldine Publishing Company, 171-183.
Milana, C. (1988). Constant-Market-Shares Analysis and Index Number Theory. European Journal of Politic Economy, 4(4), pp 453-478.
Murphy, A. (2006). The May 2004 Enlargement of the European Union: View from Two Years Out. Eurasian Geography and Economics, 47(6), 635-646.
Nyssens, A. & Poullet, G. (1990). Parts de marché des producteurs del’UEBL sur les marches extérieurs et intérieur. Cahier 7, Banque Nationale de Belgique.
Pavlíčková, V. (2013). The competitiveness of Slovak foreign trade in the European market.
Economic Annals, LVIII(196), 7-49.