*Correspondence: M. F. V. Leonel. Departamento de Produtos Farmacêuticos, Faculdade de Farmácia – UFMG. Av. Pres. Antônio Carlos, 6627 - Pampulha - 31270-901 - Belo Horizonte - MG, Brasil. E-mail: [email protected]
A
vol. 48, n. 3, jul./sep., 2012
Comparison of pharmacopeial statistical methods applied in
microbiological assay for antibiotics potency determination using
parallel lines and three-dose level
Miriam de Fátima Vianna Leonel*
1, Cristina Duarte Vianna Soares
1, Arminda Lucia Siqueira
21Department of Pharmaceutical Products, Faculty of Pharmacy, Federal University of Minas Gerais, Brazil; 2Department of Statistics, Federal University of Minas Gerais
Pharmaceutical equivalence studies, useful for checking the interchangeability of generic medicines and their respective innovator medicines, have been carried out in Brazil since 1999, as a consequence of the establishment of the generic medicine policy. For medicines containing antibiotics, microbiological assays are often the most appropriate method. However, the statistical methods applied in these assays
are not widely known due to the dificult access to oficial codes and/or little knowledge of the statistical
tools of analysis. Thus, the aim of this work was to compare the statistical methods for determining the potency of antibiotics through the cylinder-plate methodusing parallel lines and a three-dose level model, as described in the Brazilian Pharmacopeia (4th edition, 1988), British Pharmacopoeia 2011, European Pharmacopoeia (7th edition), The International Pharmacopoeia (4th edition), and United
States Pharmacopeia (34th edition). The assay is illustrated with the antibiotic oloxacin, and details on orthogonal coeficients, normality test, homogeneity of variance test, and detection of outliers are
discussed. The calculations obtained by statistical analyses from different pharmacopeias lead to the
same inal interpretation. In practice, with the availability of alternative pharmacopeial methods, the
analyst can choose the most appropriate statistical calculation to be used.
Uniterms: Antibiotics/potency. Parallel lines model. Pharmacopeial statistical methods.
Os estudos de equivalência farmacêutica, úteis na veriicação da intercambialidade entre os medicamentos genéricos e respectivos medicamentos de referência, têm sido realizados no Brasil desde 1999, como consequência do estabelecimento da política de medicamentos genéricos. Para medicamentos contendo antibióticos, os ensaios microbiológicos são, muitas vezes, o método mais adequado. Entretanto, os
métodos estatísticos aplicados nesses ensaios não são amplamente conhecidos devido à diiculdade de acesso aos compêndios oiciais e/ou pouca compreensão das ferramentas estatísticas de análises.
Portanto, o objetivo desse trabalho foi comparar os métodos estatísticos para determinação de potência
de antibióticos pelo delineamento por retas paralelas e três níveis de doses, descritos nas farmacopeias Brasileira 4. ed. (1988), Britânica 2011, Europeia 7. ed., Internacional 4. ed. e na Farmacopeia dos
Estados Unidos 34. ed. (2011). O ensaio é exempliicado com o antibiótico oloxacino e detalhes sobre coeicientes ortogonais, teste de normalidade, teste de homogeneidade de variância e detecção de outliers são discutidos. Os cálculos obtidos pelas análises estatísticas segundo as diferentes farmacopeias resultaram na mesma interpretação inal. Na prática, métodos farmacopéicos alternativos permitem ao analista a escolha do cálculo estatístico mais apropriado a ser utilizado.
INTRODUCTION
Microbiological assays on antibiotics are used in pharmaceutical preparations and raw materials whose contents are related to their biological activity and usually cannot be determined by chemical analyses. Typically, antibiotic drugs have their potency determined by com-parison with a standard substance or a biological reference substance. Such potency is expressed as the ratio of the dose that inhibits the growth of a sensitive microorgan-ism, relative to the standard substance dose that produces similar inhibition. The agar diffusion or cylinder-plate method used consists of a dose-response model in which the antibiotic concentration is proportional to the inhibi-tion zone of microorganism growth.
The statistical analysis of such experiments re -quires the establishment of a mathematical relationship of the mean responses (y) with the crescent concentra-tions (treatments or doses) of the antibiotic. The most commonly used model is the parallel lines, in which every reference standard (S) and unknown (U) prepara-tion should be tested with the same number of doses. Normally, two or three doses per preparation are used, and the ratio of adjacent doses should be constant for all treatments of the assay.
The potency calculation is based, in this case, on the analysis of two straight lines, one referring to the standard responses and the other to the unknown responses. They are obtained by the relationship between their responses and the decimal logarithm (log10) or natural logarithm (ln) of each of the doses (Hewitt, 2004; British Pharmacopoeia, 2011; European Pharmacopoeia, 2011). The least squares method (Farias et al., 2003) is most commonly used to check the linearity of the curves, and, therefore, the same number of reference standard and unknown responses is used (S1, S2, S3, and U1, U2, U3). This method is still based on the assumption that the responses (y) follow the nor-mal distribution (Gaddum, 1953; Farmacopeia Brasileira, 1988; British Pharmacopoeia, 2011; European Pharmaco-poeia, 2011) and have a constant variance (Farmacopeia Brasileira, 1988; British Pharmacopoeia, 2011; European Pharmacopoeia, 2011), and the errors are independent (random) (Farmacopeia Brasileira, 1988).
Evaluating these experiments involves the applica -tion of statistical calcula-tions currently described in phar-macopeias. However, these calculations are not understood by analysts, primarily due to the unavailability of oficial codes in the pharmaceutical industries. Moreover, a lack of specialists in the area, together with little knowledge of the statistical tools of analysis, has also been observed. Thus, an investment in qualiied personnel is extremely
important for the pharmaceutical industry. The success of the experimental antibiotics assay design requires a knowl -edge of various pharmacopeial methods, a familiarity with statistical hypothesis testing, and a correct interpretation of the validity parameters. It is worth emphasizing that microbiological assays of antibiotics are performed, among others, in studies of pharmaceutical equivalence for registration or renewal of generic medicines. In Brazil, with the advent of the generic drug policy established in 1999, the regulatory agency admits many foreign pharma-ceutical codes as oficial references for the quality control of raw materials and pharmaceuticals, in the absence of a monograph in the Brazilian Pharmacopeia.
Normality test
A test to check the normality of the response variable (y) is recommended in the British Pharmacopoeia (BP) (British Pharmacopoeia, 2011), European Pharmacopoeia (EP) (European Pharmacopoeia, 2011), Brazilian Pharma-copeia (FB) (FarmaPharma-copeia Brasileira, 1988), International Pharmacopoeia (IP) (The International Pharmacopoeia, 2011), and United States Pharmacopeia (USP 34) (United States Pharmacopeia, 2011). In BP and EP, the work by Shapiro and Wilk is recommended (Shapiro, Wilk, 1965) for veriication of the test and the calculations. Consider
y1 < y2 < …< yn the ordered sample responses of size n
in which i = 1, 2, ..., n and y1 is the smallest value. The statistic is deined as
. (1)
The constant b is calculated by
, (2)
in which ai is tabulated (for n ≤ 50) in the referred
cita-tion. For normal distribution, the value of W should be close to 1.
Another test of normality is known as Anderson-Darling (AD) (Minitab, 2010), which is not mentioned in the pharmacopeias. It is based on the cumulative distribu-tion funcdistribu-tion (cdf) of the empirical data to be analyzed. In the calculation, the weighted quadratic distance is used between the line adjusted of the probability plot (based on the selected distribution) and nonparametric function. The statistic is deined as
, (3)
normal distribution of the response yi sorted in ascending
order.
In a scale from 0 to 1, a small AD value indicates that normal distribution its best the data. In cases in which the normality condition is not met, the transformation of the response (y), e.g., log10y or lny, y1/2 and y2, is suggested
to achieve compliance with this condition (Farmacopeia Brasileira, 1988; British Pharmacopoeia, 2011; European Pharmacopoeia, 2011).
Another quantitative measure for reporting the result of the AD normality test is the p-value. The signiicance
probability value (p) is calculated from the value obtained from AD’ where
AD’ = AD (1 + 0.75/n + 2.25/ n2). (4)
The calculations are implemented in some software packages (Minitab, 2010) according to the following equations:
13 > AD’ > 0.600,
p = exp [1.2937 – (5.709 x AD’) + (0.0186 x AD’2)] (5)
0.600 > AD’ > 0.340,
p = exp [0.9177 – (4.279 x AD’) – (1.38 x AD’2)] (6)
0.340 > AD’ > 0.200,
p = 1 – exp [– 8.318 – (42.796 x AD’) – (59.938 x AD’2)] (7)
AD’ < 0.200,
p = 1 - exp [-13.436 + (101.14 x AD’) – (223.73 x AD’2)] (8)
Homogeneity of variance
The homogeneity of the variance (homocedastic-ity) test is cited in BP and EP. Its implementation is also recommended by Bartlett (Bartlett, 1937) and Cochran (Cochran, 1951). According to Cochran, the test is based on the measure of the variances (si2, i = 1, …, k) between
k treatments considered as different treatments or doses, of size ni, and is calculated by
. (9)
The sizes of all ni groups are assumed to be equal
when the calculated C is less than the critical value for a given signiicance level (Fisher, Belle, 1993).
Detecting outliers
If a response is doubtful or discrepant, it should be
investigated. A good way to detect such observations is by means of graphical inspection, such as a scatter plot and/ or box plot (Ludbrook, 2008). In BP and EP the calcula-tion of the variance of responses in each treatment group is suggested for the veriication of outliers. FB and USP 34 recommend the following tests.
Criterion 1 – Based on the variation of group with supposedly equivalent responses
For normally distributed data, different tests are available to identify outliers; these are sometimes called Q-tests (Burke, 2001). Other tests, such as the Dixon test (Dixon, 1950; Dixon, 1951; Bliss, 1956; Miller, 1993; Massart et al., 1997), are based on the calculation of the experimental Q (or r10 in Dixon’s notation) (Efstathiou, 2006), deined as the ratio given by the distance of the sus-pect value from its nearest neighbor divided by the range of the values. These values are compared with tabulated critical values. Similar to the Shapiro-Wilk test, responses should be sorted in ascending order. In FB and USP 34, the statistic is called G.
G1 = (y2 – y1) / (yn – y1), for n = 3 to 7 (10)
G2 = (y3 – y1) / (yn-1 – y1), for n = 8 to 13 (11)
G3 = (y3 – y1) / (yn-2 – y1), for n = 14 to 24 (12)
If G1, G2, or G3 exceeds the critical value, for a gi -ven signiicance level, such response can be eliminated. Otherwise, the suspect value is maintained (Farmacopeia Brasileira, 1988; United States Pharmacopeia, 2011).
Criterion 2 – Based on k total groups
This criterion evaluates the variation of responses in each treatment (Bliss et al., 1956). The biggest difference or range should be divided by the sum of all differences and must not exceed the critical value (R) (Farmacopeia Brasileira, 1988; United States Pharmacopeia, 2011) for k
number of doses or treatments and n replicates.
1978; Ludbrook, 2008). Let Tr’ be the sum of all responses
to the block (plate) in which the value is lost; Tt’ be the sum of all treatment responses, for which the value is lost;
T’ be the total sum of the observations; f be the number of plates; and k be the number of treatments or doses. The value to be replaced is calculated by
y’ = (fTr’ + kTt’ – T’) / (f – 1)( k – 1). (13)
Validity test: analysis of variance
The analysis of variance (ANOVA) performed for calculations of antibiotic potency aims to verify the validity of the assay, to calculate the residual error (s2)
(Farmacopeia Brasileira, 1988), and to distinguish the various sources of error (variation) affecting the responses that are not due to the gradual increase of doses. These sources can be deviations from parallelism and linearity (or curvature) that can occur between the reference stan-dard and unknown responses, in addition to differences between preparations, blocks, and doses.
The responses are registered for each dose and for each preparation that comprises the total responses. The variation of responses due to different doses is calculated and subtracted from the sum of squares (SS) for each block to obtain the residual error. Thus, the total sum of squares is equal to the SS of the dose, between blocks and within the dose (error).
To check the signiicance of the sources of variation, SS is divided by the corresponding degree of freedom (d.f.) to obtain the mean square (MS), which in turn is divided by the residual variance (mean squared error or s2) to obtain
the variance ratio (or F value). The F value calculated is compared with the critical limit obtained from Fisher’s statistical table (Farmacopeia Brasileira, 1988; British Pharmacopoeia, 2011; European Pharmacopoeia, 2011) for signiicance levels of 5% (α = 0.05) or 1% (α = 0.01) and depends on the source of variation. If the calculated F value is greater than the critical value, the source of variation is considered signiicant for the signiicance level adopted.
Additionally to the F statistic, the probabilities or
p-values are recommended (Hewitt, 2004; British Phar-macopoeia, 2011; European PharPhar-macopoeia, 2011). The procedures for the calculation of p-values are shown in general method of BP (A632, supplementary chapter IV G) and EP (general method 5.3, statistical analysis of re-sults of biological assays and tests). The signiicance level (α) generally is 0.05 or 0.01, and for a p-value result less than α, the null hypothesis must be rejected. One way to evaluate p is irst to calculate the cdf value of the data and
then subtract it from one (1 - cdf) (Fisher; Yates, 1971).
To check the validity of the test, the regression is studied through the precision of the slope (C), in which a test with a well-deined coeficient should be close to 1 (Farmacopeia Brasileira, 1988; British Pharmacopoeia, 2011; European Pharmacopoeia, 2011). The use of the statistic g (The International Pharmacopoeia, 2011; United States Pharmacopeia, 2011) is also described as a positive number and should have a value less than 1 or less than 0.1, indicating highly signiicant regression. The statistics
C and g are related by the expression g =(C - 1)/C or C
(1 - g) = 1. Table I shows the calculations according to different pharmacopeias.
To verify the linearity deviation, the parameter is ex-pressed as two sources of variation in the pharmacopeias: the irst, in the same direction (quadratic), and the other, in the opposite direction (quadratic difference). In BP and EP, from year 2000 on, these parameters were grouped into one, under the title non-linearity, requiring two degrees of freedom for its calculation.
The calculations according to the methods of IP and USP 34 are based on the use of orthogonal coeficients (Hewitt, 1977) to obtain the sum of squared deviations, which are attributed to several sources of variation. The coeficients are derived from the table of orthogonal poly -nomials, e.g., as in Fisher and Yates (1971). Statistical analysis is exempliied in papers published by Bliss (1956) and Hewitt (1977). This method, easily applied, is used in balanced assay, and the coeficients used are applied when the logarithms of the doses are equally spaced. One of the features of such coeficients is that each line repre -sents the contrast between individual responses, e.g., for the regression line, the sum of their coeficients, –1 + 0 + 1 – 1 + 0 + 1, is zero. Each pair of contrasts is orthogonal. The multiplication of coeficients for the regression and parallelism (1, 0, –1, –1, 0, 1) is –1, 0, –1, 1, 0, 1, whose total is zero. The divisors (ei) are the sums of the squares of the coeficients of individual responses. Thus, (–1)2 +
(0)2 + (1)2 + (–1)2 + (0)2 + (1)2 = 4.
TABLE I - Formula for calculating the precision of the slope (C or g) used by the Brazilian Pharmacopeia (FB), The International Pharmacopoeia (IP), United States Pharmacopeia (USP 34), British Pharmacopoeia (BP), and European Pharmacopoeia (EP)
Parameter Pharmacopeial code Formula
C FB
BP and EP
USP 34
g IP
LS and LU, linear contrasts to the reference standard (S3 – S1) and unknown (U3 – U1) preparation; t, Student’s t for n degrees of freedom (d.f.) in s2; n and f, number of replicates or number of Petri dishes or blocks; d, number of doses; T
b, sums of the products
of the coeficient eb by their corresponding treatment; eb, sums of the squares of the orthogonal coeficients of individual responses
in Table VII; i, interval in logarithms between successive log-doses, the same for both reference standard and unknown; h, number of preparations including reference standard.
For the validity test, each of therows ab, q, and aq
values should not exceed three times the variance value (s2). Otherwise, if the ratio of any of the three values is
greater than 3, then F3 should be calculated by
, (14)
where
s2 = [ Σy2 – (ΣT r
2 / k) – (Σ T t
2/f ) + T2/N ] / n (15)
and N is the total number of responses; n, in this case, is the number of degrees of freedom for residual error; k is thenumber of treatments; Tris thesum of all responses to the block (plate); Tt is the sum of all treatment responses;
and T is thetotal sum of the observations.
According to USP 34, F3 is applicable to a balanced
assay with three or four dose levels. To test validity, the calculated F3 value must not exceed the critical value
(United States Pharmacopeia, 2011), considering the number of degrees of freedom for s2. If this condition is
satisied, the precision of the slope C is then calculated, as previously reported (Farmacopeia Brasileira, 1988; British Pharmacopoeia, 2011; European Pharmacopoeia, 2011).
Potency
The ratio of a given reference standard dose to the corresponding unknown dose is designated by R. The
logarithm of the ratio of potency of the unknown, in quantities assumed to be equal to those of the reference standard, is designated by M’ and the mathematical equa-tions according to pharmacopeias USP 34, FB, IP, BP, and EP are (ci/Ta/Tb), (–yA –
–y
P/b), (F/b), ((A – P)/3b), (ci/Ta/
Tb), respectively.
Ideally, M’ should not signiicantly differ from zero. The logarithm of the ratio of relative potency or estimated potency is obtained by
M = M’ + log R (16) or
Potency (P) = antilog M = antilog M’ x R (17)
MATERIALS AND METHODS
The statistical calculations described in many pharmacopeias (Farmacopeia Brasileira, 1988; Brit-ish Pharmacopoeia, 2011; European Pharmacopoeia, 2011; The International Pharmacopoeia, 2011; United States Pharmacopeia, 2011) were applied to the results of a microbiological assay of the antibiotic oloxacin in tablet preparation using the cylinder-plate method (par-allel lines with three reference standard and unknown doses). The dilutions of the unknown (U), tablets labeled potency claimed 400 mg (R), and reference standard (S) were prepared at concentrations of (1) 20 µg mL-1,
(2) 30 µg mL-1, and (3) 45 µg mL-1. Each of the six doses
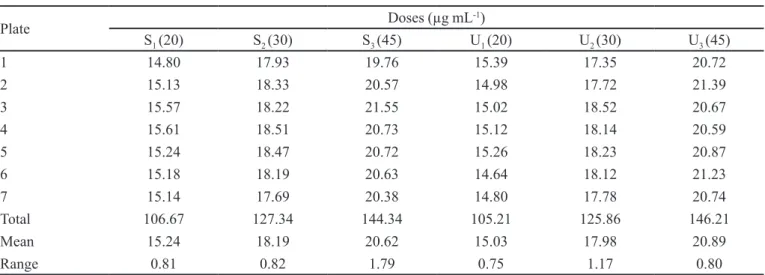
of seven Petri dishes. Table II describes the diameters of inhibition zones (y), in millimeter (mm), in addition to the total treatment values (columns), means, and range (difference between maximum and minimum) for each treatment.
To evaluate the results, preliminary calculations are presented for the purpose of preparing the tables required to complete the results. Calculations and graphs were per-formed using Excel and Minitab (Minitab, 2010).
CALCULATION AND RESULTS
Normality test
First, for the Shapiro-Wilk method, the treatment columns (doses) were sorted in ascending order (Table III). For the low-reference standard dose (S1), the sorted
responses were 14.80, 15.13, 15.14, 15.18, 15.24, 15.57, and 15.61, and the sum of the squared deviations of the responses was 0.4651. In the third column, the responses were sorted in descending order, n-i+1, until the fourth observation, and, in the fourth column data, are shown in ascending order until the fourth observation. The sum of the last column represents the constant B, i.e., the sum of the values obtained by multiplying the coeficients ai by
the difference between yn-i+1 and yi. (0.6523). The coef-icient b2 is 0.4255 and the statistic W, applying equation
(1), is
W = 0.4255/0.4651 = 0.915.
The graph of normal probability for the S1 dose was obtained and is shown in Figure 1.
TABLE II – Diameters of inhibition zone (mm) of the oloxacin microbiological assay using three-dose level (3x3)
Plate Doses (µg mL
-1)
S1 (20) S2 (30) S3 (45) U1 (20) U2 (30) U3 (45)
1 14.80 17.93 19.76 15.39 17.35 20.72
2 15.13 18.33 20.57 14.98 17.72 21.39
3 15.57 18.22 21.55 15.02 18.52 20.67
4 15.61 18.51 20.73 15.12 18.14 20.59
5 15.24 18.47 20.72 15.26 18.23 20.87
6 15.18 18.19 20.63 14.64 18.12 21.23
7 15.14 17.69 20.38 14.80 17.78 20.74
Total 106.67 127.34 144.34 105.21 125.86 146.21
Mean 15.24 18.19 20.62 15.03 17.98 20.89
Range 0.81 0.82 1.79 0.75 1.17 0.80
S, reference standard; U, unknown.
TABLE III - Sorted results for calculation of coefficient b of
the reference standard dose responses, S1, for the ofloxacin
microbiological assay
i n – i + 1 yn – i + 1 yi ai ai(yn – i + 1 – yi)
1 7 15.61 14.80 0.6233 0.5049
2 6 15.57 15.13 0.3031 0.1334
3 5 15.24 15.14 0.1401 0.0140
4 4 15.18 15.18 0.0000 0.0000
i, ordered ith response; n, number of observations; y, responses;
ai, coeficient used in the W statistic.
FIGURE 1 - Chart of normal probability of the S1 dose (diameter
of inhibition zone, mm) at 20 µg mL-1, for the ofloxacin
microbiological assay
After the statistical value AD was calculated, the
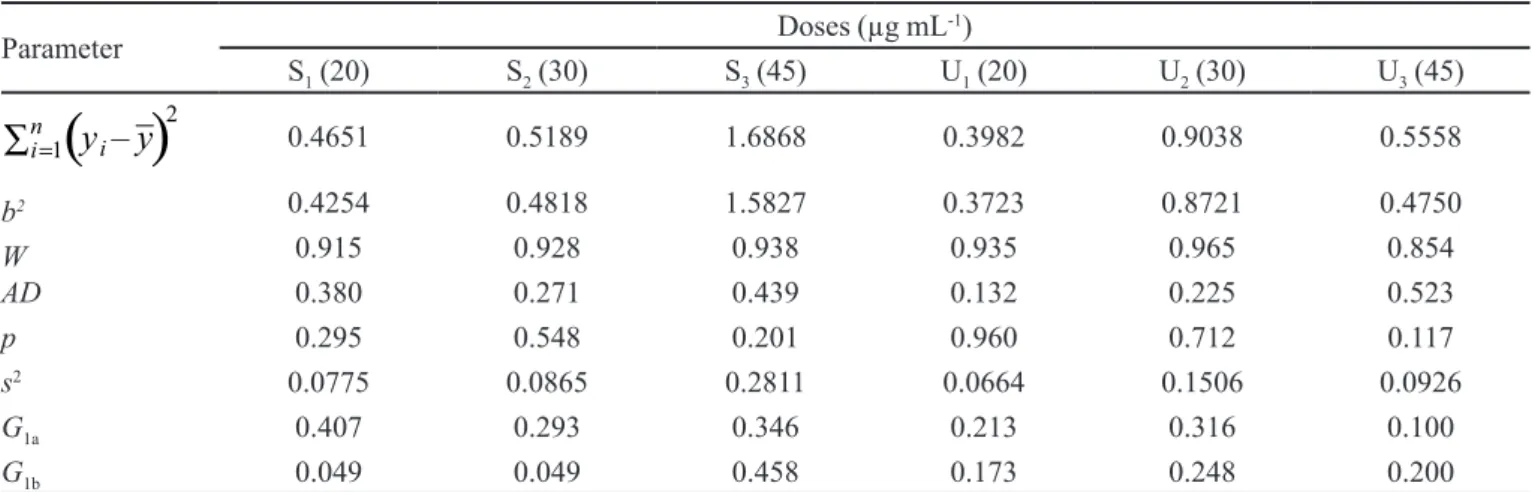
TABLE IV - Statistics obtained for each dose for the oloxacin microbiological assay, using three-dose level (3x3)
Parameter Doses (µg mL
-1)
S1 (20) S2 (30) S3 (45) U1 (20) U2 (30) U3 (45)
0.4651 0.5189 1.6868 0.3982 0.9038 0.5558
b2 0.4254 0.4818 1.5827 0.3723 0.8721 0.4750
W 0.915 0.928 0.938 0.935 0.965 0.854
AD 0.380 0.271 0.439 0.132 0.225 0.523
p 0.295 0.548 0.201 0.960 0.712 0.117
s2 0.0775 0.0865 0.2811 0.0664 0.1506 0.0926
G1a 0.407 0.293 0.346 0.213 0.316 0.100
G1b 0.049 0.049 0.458 0.173 0.248 0.200
S, reference standard; U, unknown; b2, square of the constant used in the Shapiro-Wilk test (W); AD, Anderson-Darling test statistic;
p, Anderson-Darling test p-value; s2, variance; G
1a, Dixon’s statistic for the irst observation; G1b, Dixon’s statistic for the second observation.
AD’ was estimated according to equations (4) and (6), taking the value of statistic AD (0.439), for the S3 dose.
AD’ = 0.439 (1 + 0.75/7 + 2.25/49) = 0.5062 p = exp [0.9177- (4.279 x 0.5062) – (1.38 x 0.50622)] = 0.201
Homogeneity of the variance test
Since each treatment in the assay is a sampling val-ue, the variances for each treatment group were calculated. According to equation (9), the following was obtained:
CCochran = 0.0775/0.7547 = 0.103
Table IV summarizes the results of ; constant B2; statistics W, AD, G; probability p; and
vari-ance (s2) for all treatment groups in the assay.
Detecting outliers
To detect outliers by criterion 1, the responses were sorted in ascending order. The maximum difference (range) was then calculated for each treatment. It was observed that for the high reference standard dose (S3) there were responses that could be considered possible outliers, e.g., values 19.76 mm and 21.55 mm. In the box plot of Figure 2, one can notice the presence of such two points for the S3 dose.
Hence, the ordering of data for veriication, in mm, is 19.76, 20.38, 20.57, 20.63, 20.72, 20.73, 21.55. Con-sidering the irst observation as a suspect value (lower value), 19.76 mm, G1 (n = 7) was estimated, according to equation (10):
G1 = (20.38 – 19.76) / (21.55 – 19.76) = 0.346.
For the second suspect value (higher value), 21.55,
G1 is
G1 = (21.55 – 20.73) / (21.55 – 19.76) = 0.458.
Table IV shows the calculated values of G1 for high S3 dose and for the other treatment groups.
For veriication by criterion 2, considering that the S3 dose showed the largest variation, the R-value was
cal-culated by the ratio of the maximum range and the sum of all ranges.
R = 1.79/6.14 = 0.292
FIGURE 2 - Box plot of the S3 (reference standard) and U3
Replacing outliers
The calculation for the replacement of the responses
y = 19.76 to 21.55 of dose S3 values, identiied as outliers in the box plot (Figure 2), was carried out. The responses resulted in the order (---; 20.57; ---; 20.73; 20.72; 20.63; 20.38), excluding the outliers.
The average of the remaining ive responses was 20.61, and this value was inserted into the first gap to calculate the third gap. The new order is now (20.61; 20.57; ---; 20.73; 20.72; 20.63; 20.38), and the sum of total responses is 123.64.
Applying equation (13), the value of the third gap was recalculated:
y’ = [(7 x 88) + (6 x 123.64) – 734.93] / [(7 – 1)(6 – 1)] = 20.76,
for which Tr’ = 88 (109.55 – 21.55); Tt’ = 123.64 (145.19 – 21.55); and T’ = 734.93; f = 7; k = 6.
Eliminating the value added in the first column (average 20.61) in place of the response y = 19.76, the fol-lowing sequence (---; 20.57; 20.76; 20.73; 20.72; 20.63; 20.38) was obtained. To calculate the new value of the irst gap, and again applying the pharmacopeial calculations, this value became
y’ = [ (7 x 86.19) + (6 x 123.79) – 735.08] /
[(7 – 1)(6 – 1)] = 20.37.
The S3 treatment values, after replacement of dis-crepant responses, became (20.37; 20.57; 20.76; 20.73; 20.72; 20.63; 20.38).
However, for calculations of ANOVA and potency of the unknown, the responses 19.76 and 21.55 were not replaced. The two observations have not been pointed out as outliers in the Dixon test (criterion 1). Additionally, the responses were found to be homoscedastic in the test of variance homogeneity.
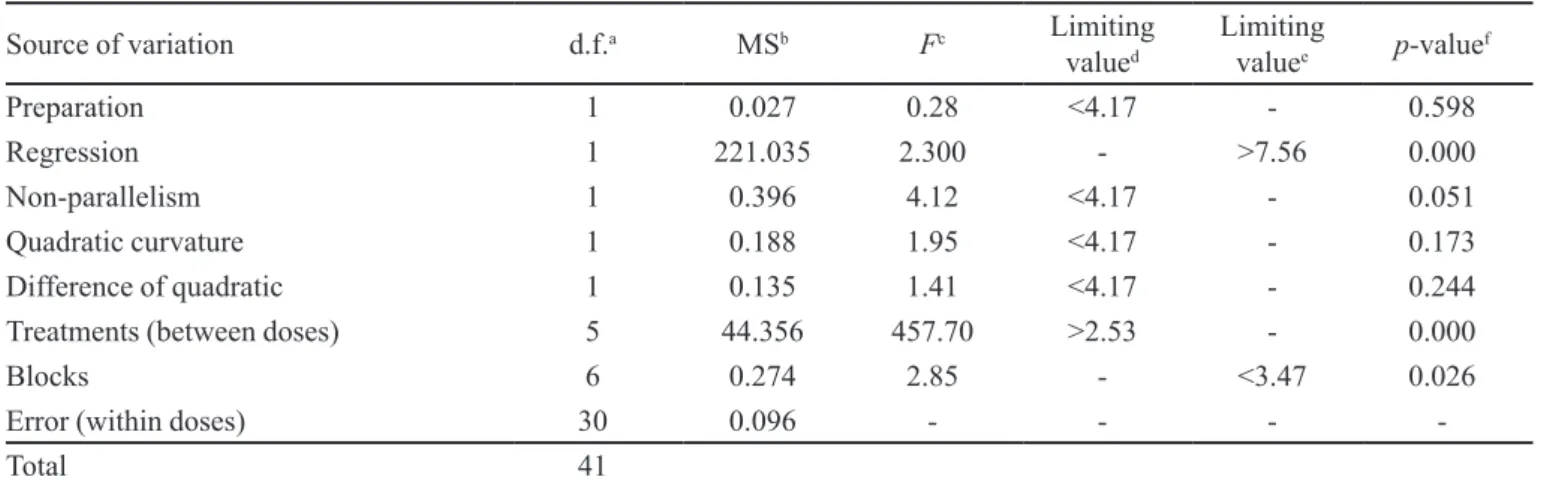
Analysis of variance
Tables V and VI show the results of the ANOVA performed according to FB, BP and EP respectively, con-sidering all possible sources of variation.
Table VII shows the results of the sum of squares allocated to sources of variation due to preparation, re-gression, parallelism, and curvature in the same direction and opposite direction, following calculations using the orthogonal coeficients recommended by IP and USP 34.
The total values (Ti2/e
i f) for ab, q, and aq were
0.396, 0.188 and 0.135, respectively. The ratios of each total to the variance (0.096), as in equation (15), were 4.125 (0.396/0.096), 1.958 (0.188/0.096), and 1.406 (0.135/0.096). Considering that the ratio of total value of ab to the variance (4.125) was greater than3, F3 was
calculated according to equation (14):
F3 = (0.396 + 0.188 = 0.135) / (3 x 0.096) = 2.50.
DISCUSSION
Normality test
The values of W statistics, according to the Shap-iro-Wilk test, were greater (values near 1) than the critical
TABLE V - Analysis of variance (ANOVA) for the oloxacin microbiological assay according to the Brazilian Pharmacopeia (FB)
Source of variation d.f.a MSb Fc Limiting
valued
Limiting
valuee p-value
f
Preparation 1 0.027 0.28 <4.17 - 0.598
Regression 1 221.035 2.300 - >7.56 0.000
Non-parallelism 1 0.396 4.12 <4.17 - 0.051
Quadratic curvature 1 0.188 1.95 <4.17 - 0.173
Difference of quadratic 1 0.135 1.41 <4.17 - 0.244
Treatments (between doses) 5 44.356 457.70 >2.53 - 0.000
Blocks 6 0.274 2.85 - <3.47 0.026
Error (within doses) 30 0.096 - - -
-Total 41
a: d.f., degrees of freedom; b: MS, mean square; c: F, variance ratio; d: critical F-value at signiicance level 0.05; e: critical F-value
TABLE VII - Coefficients and orthogonal contrasts for the ofloxacin microbiological assay, according to the International
Pharmacopoeia (IP) and the United States Pharmacopeia (USP 34)
Source of
variation Orthogonal coeficients ei Ti Ti
2/e
i f
a -1 -1 -1 1 1 1 6 -1.07 0.027
b -1 0 1 -1 0 1 4 78.67 221.035
ab 1 0 -1 -1 0 1 4 3.33 0.396
q 1 -2 1 1 -2 1 12 -3.97 0.188
aq -1 2 -1 1 -2 1 12 3.37 0.135
a, difference between reference standard and unknown; b, difference between all highest and lowest doses (slope); ab, difference
between slopes; q, common curvature of both preparations; aq, contrast between curvature of the two preparations; ei, sum of
squares of coeficients in each row; Ti, sum of the products of individual coeficients in each row with their corresponding total
treatment; f, number of replicates or block (Petri dishes).
TABLE VI - Analysis of variance (ANOVA) for the oloxacin microbiological assay according to the British Pharmacopoeia (BP)
and the European Pharmacopoeia (EP)
Source of variation d.f.a MSb Fc Limiting
valued
Limiting
valuee p-value
f
Preparation 1 0.027 0.28 <4.17 - 0.601
Regression 1 221.032 2300.91 - >7.56 0.000
Non-parallelism 1 0.396 4.12 <4.17 - 0.051
Non-linearityg 2 0.161 1.68 <3.32 - 0.203
Treatments (between doses) 5 44.356 457.70 >2.53 - 0.000
Blocks 6 0.275 2.86 - <3.47 0.025
Error (within doses) 30 0.096 - - -
-Total 41
a: d.f., degrees of freedom; b: MS, mean square; c: F, variance ratio; d: critical F-value at signiicance level 0.05; e: critical F-value
at signiicance level 0.01; f: p, calculated probability; g: same direction and opposite direction.
value (W is 0.803 for α = 0.05) (Shapiro & Wilk, 1965).
The chart of normal probability (Figure 1) represents the responses for dose S1 (x-axis) versus percentages (y-axis)
of the values that are less than or equal to them, along the reference line (central line). The plotted points form a reasonably straight line and the p-value for statistics AD
was 0.380. A normal distribution with a mean of 15.24 and a standard deviation of 0.2784 appeared to it the data well. The probability p calculated for all treatment groups was greater than the signiicance level α = 0.05, as shown in Table IV. Thus, the responses were not transformed. One can state that the unknown preparation comes from a normal population (p > 0.100), at a signiicance level
of 5%.
Homogeneity of variance test
The statistic value according to Cochran (C = 0.372)
was lower than the critical value (C is 0.418 for d.f. = 6 and α = 0.05) (Fisher, Belle, 1993). Although there was a discrepant difference for dose S3, the null hypothesis of equality of variances was not rejected, i.e., the data did not provide enough evidence that the treatments presented different variances.
Detection and replacement of outliers
In the test for the detection of outliers, the results led to conlicting interpretations. Calculations made by criterion 1 suggested that the responses listed as discrep-ant (19.76 and 21.55) were consistent with the rest of the data and should not be eliminated, because the calculated values of G1, i.e., G1a = 0.346 and G1b = 0.458 (Table IV), were smaller than the critical value (G1 is 0.586 for n = 7)
By criterion 2, however, the R-value (0.292) was greater than the critical value (R was 0.288 for n = 7 and
k = 6) (Farmacopeia Brasileira, 1988; United States Pharmacopeia, 2011), suggesting that the responses are not consistent with other data and should be treated as outliers. The option to null and to replace these values is not recommended, since the data were not fully recog-nized as outliers (Ludbrook, 2008), i.e., both criteria were contradictory. In the case of lossof some responses, the replacement of missing values is justiied to avoid break -ing the orthogonality (Finney, 1978). Otherwise, this may hamper the use of orthogonal coeficients in the ANOVA. In an evaluation of the data obtained, it was found that (i) the tests of normality and homogeneity of variance were satisfactory, and (ii) the replacement of two dose responses in the S3 column contradicted the recommendation of the pharmacopeia that advocates “to replace the lost response, at most one in each treatment or, up to 5% or 10% of total responses”. Thus, an option was made to keep the data originally obtained in the assay by accepting them as a genuine and predictable part of the experimental data.
To check the impact on the replacement of these responses, values were replaced from 19.76 and 21.55 to 20.37 and 20.76, respectively. The replacement of such responses did not signiicantly alter the potency, but the ANOVA showed a relevant deviation from parallelism (F
calculated was 6.54, greater than the critical value F criti-cal = 4.17) between the reference standard and unknown regression lines.
Analysis of variance
Considering ANOVA in all pharmacopeial methods, observations were made for each source of variation, as follows:
Preparation: The calculated F-value (F = 0.28) was lower than the critical value (F1,30;0.05 = 4.17) (Farmacopeia
Brasileira, 1988; British Pharmacopoeia, 2011; European Pharmacopoeia, 2011). This indicates that the preparations are similar or that the unknown has a potency close to that of the reference standard.
Regression: The calculated F-value (F = 2300) was higher than the critical value at 1% significance level (F1,30;0.01 = 7.56) (Farmacopeia Brasileira, 1988; British
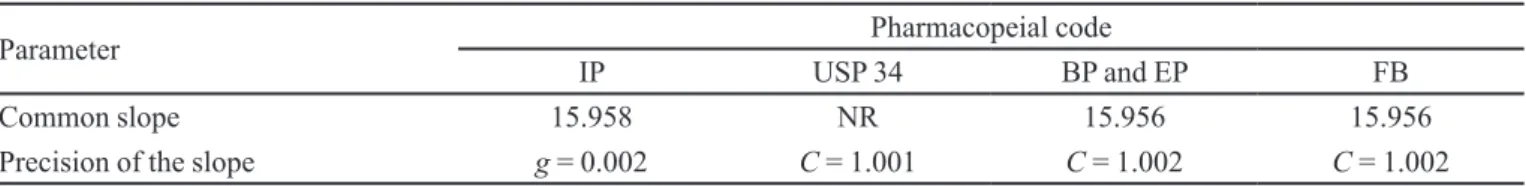
Pharmacopoeia, 2011; European Pharmacopoeia, 2011), indicating that the dose-response curve was highly signii-cant. Table VIII shows the values of common slope b. The calculation was not performed according to USP 34, since this parameter is not a requirement for testing the validity of the model by parallel lines–balanced assay, according to general methods of the pharmacopeia.The signiicance of the regression was conirmed by statistic C or g, i.e., C is very close to 1 and g is less than 1. Considering the aver-age of C (1.002) and g (0.002) in Table VIII, the value for expression C (1 - g) is 0.999996 or [1.002 (1 - 0.002)] ≈ 1.
Deviation from parallelism: Ideally, lines should be completely parallel, and there should be no deviation from parallelism. Therefore, a difference of at least one unit in the F-value calculated for the critical value should be established. The calculated F-value (F = 4.12) was lower, but very close to the critical value (F1,30;0.05 = 4.17) (Farma-copeia Brasileira, 1988; British Pharmacopoeia, 2011; European Pharmacopoeia, 2011). In the graph response versus concentration it was observed that lines cross each other, suggesting a possible deviation of parallelism (Figure 3). The calculated F-value (4.12) was very close
TABLE VIII - Comparative results of common slope and precision of the slope (g or C) according to several pharmacopeial codes,
applied for the oloxacin microbiological assay
Parameter Pharmacopeial code
IP USP 34 BP and EP FB
Common slope 15.958 NR 15.956 15.956
Precision of the slope g = 0.002 C = 1.001 C = 1.002 C = 1.002
NR, not required.
FIGURE 3 - Regression curves fitted to the ofloxacin
microbiological assay, using three-dose level (3x3) for the
to the critical value, indicating a deviation of parallelism, i.e., it exists, but is not signiicant. The p-value was greater than 0.05, conirming that the deviation from parallelism is not signiicant.
Deviation from linearity: No deviation in the same direction and opposite direction was observed because the calculated F-values (F = 1.95 and 1.41) were smaller than the critical value (F1,30;0.05 = 4.17) (Farmacopeia, 1988). According to BP and EP, the calculated F-value (1.68) was also smaller than the critical value (F2,30;0.05 = 3.32) (British Pharmacopoeia, 2011; European Pharmacopoeia, 2011).
Treatments: The calculated F-value (F = 457) was greater than the critical value (F5,30;0.05 = 2.53)
(Farmaco-peia, 1988; British Pharmacopoeia, 2011; European Phar-macopoeia, 2011), indicating that it is a major inluence on the regression curve, as expected.
Blocks(plates): According to FB, BP, and EP, the calculated F-values (F = 2.84 and 2.85) were lower than the critical value (F6,30;0.01 = 3.47) (Farmacopeia
Brasileira, 1988; British Pharmacopoeia, 2011; European Pharmacopoeia, 2011). Hence, there is no difference in the experimental model due to the source of variation, blocks. Even if it existed, the assay would not be consid-ered invalid, since each block is an experimental unit that includes all doses, one for each treatment. Therefore, this is an independent assay, the differences of which affect the treatments equally. Considering that every source of variation that affects the response can inluence the slope, the differences between blocks are adjusted when using the balanced model.
For the interpretation of the validity of the assay, ac-cording to IP and USP 34, only the analysis of sources of variation parallelism, and linearity deviation in the same direction and opposite direction are taken into consideration. The sum of squared deviations, obtained by using orthogo-nal coeficients (USP 34), is equivalent to all other sources of variation based on the least squares method, denoted by the pharmacopeias BP, EP, and FB. The found F3-value (2.50) is smaller than the critical value (F3 is 2.92 for d.f.=
30) (United States Pharmacopeia, 2011), which determines that there are no parameters that invalidate the assay.
Evaluation of potency and confidence limits
As expected, the results from the application of pharmacopeial statistical methods are quite similar. The expressions for the potency calculations adopted by the pharmacopeias are apparently different, but the variables have the same meaning and are therefore related. Equal-ity demonstrations of these expressions have not been presented in this work.
The ANOVA indicated no difference between the potency of the reference standard and sample prepara-tion of oloxacin tablets. The results of relative potency (antilog M’ x R; R = 400 mg) and their conidence limits (in percentage), according to each pharmaceutical code, are as follows: FB, 99.27 (96.50 to 102.11); BP and EP, 99.27 (96.50 to 102.11); IP, 99.28 (97.22 to 102.86); and USP 34, 99.27 (96.50 to 102.11).
CONCLUSION
The reliability of the results of antibiotic potency assays depends on the control of the variables that can affect such results. The replacement of outliers should not be a rule, especially when the results of ANOVA are satisfactory and do not invalidate the assay performed. It is important to note that the outliers are random and that replacement does not result in biased results. Therefore, the decision to accept or reject the data, presumably atypical, should be based on statistical analysis, as well as reasonable and appropriate interpretation of results by an experienced analyst.
For the parallel lines and three-dose level model, according to the pharmacopeias cited, one must observe that (i) the statistical calculations for determination of antibiotic potency are based on the regression analysis us-ing the least squares method and on the use of orthogonal coeficients suitable for the balanced model; and (ii) the different statistical methods used are similar regarding the results obtained for potency and conidence interval.
It is important to mention that alternative statisti-cal methods, as long as they are valid, are recognized by pharmacopeias. Finally, this work is a contribution to the choice of the most appropriate statistical calculation to be used.
REFERENCES
BARTLETT, M.S. Properties of suficiency and statistical testes. Proc. R. Soc. A., v.160, n.901, p.268-282, 1937.
BLISS, C.I. The calculation of microbial assay. Microbiol. Mol. Biol. Rev., v.20, n.4, p.243-258, 1956.
BLISS, C.I.; COCHRAN, W.G.J.; TUKEY, W. A rejection
criterion based upon the range. Biometrika,v.43, n.3/4,
p.418-422.
BURKE, S. Missing values, outliers, robust statistics &
nonparametric methods. LC-GC Eur., online suppl.59,
p.19-24, 2001.
COCHRAN, W.G. Testing a linear relation among variances, Biometrics, v.7, n.1, p.17-32, 1951.
DIXON, W.J. Analysis of extreme values. Ann. Math. Stat., v.21, n.4, p.488-506, 1950.
DIXON, W.J. Ratios involving extreme values. Ann. Math. Stat., v.22, n.1, p.68-78, 1951.
EFSTATHIOU, C.E. Estimation of type I error probability from
experimental Dixon’s “Q” parameter on testing for outliers
within small size data sets. Talanta, v.69, n.5, p.1068-1071, 2006.
European Pharmacopoeia. 7.ed. Strasbourg: Council of Europe, 2011. p.551-579.
FARIAS, A.A.; CESAR, C.C.; SOARES, J.F. Introdução à
estatística. 2.ed. Rio de Janeiro: LTC, 2003. 340 p.
Farmacopeia Brasileira. 4.ed. São Paulo: Atheneu, 1988. pt.1,
p.VI.1-VI.10.
FINNEY, D.J. Statistical method in biological assay. 3.ed.
London: C. Grifin, 1978. 508 p.
FISHER, R.A.; YATES, F. Tabelas estatísticas para pesquisa
em biologia, medicina e agricultura. São Paulo: Polígono,
1971. 150 p.
FISHER, L.D.; BELLE, G.V. Biostatistics: a methodology
for the health sciences. 2.ed. New York: John
Wiley-Interscience, 1993. 991 p.
GADDUM, J.H. Bioassays and mathematics. Pharmacol. Rev.,
v.5, n.1, p.87-134.
HEWITT, W. Microbiological assay for pharmaceutical
analysis: a rational approach. New York: Interpharm/CRC
Press, 2004. 244 p.
HEWITT, W. Microbiological assay: an introduction to
quantitative principles and evaluation. New York: Academic
Press, 1977. 284 p.
LUDBROOK, J. Outlying observations and missing values: how
should they be handled? Clin. A. Exp. Pharmacol. P., v.35, n.5-6, p.670-678, 2008.
MASSART, D.L.; VANDEGINSTE, B.G.M.; BUYDENS, L.M.C.; DE JONG, S.; LEWI, P.J.; SMEYERS-VERBEKE, J. Some important hipothesis tests. In: _____ Handbook of chemometrics and qualimetrics: Part A. 1.ed. Amsterdam: Elsevier science BV, 1997. p.93-112.
MILLER, J.N. Outliers in experimental data and their treatment. Analyst, v.118, n.5, p.455-461, 1993.
MINITAB: software para aprimoramento de qualidade. State College: Minitab, 2010. Available at: <http://www.minitab. com/pt-BR>. Accessed on: 10 Feb. 2011.
SHAPIRO, S.S.; WILK, M.B. An analysis of variance test for
normality (complete samples). Biometrika, v.52, n.3/4,
p.591-611, 1965.
THE INTERNATIONAL PHARMACOPOEIA. Suppl.1
Available at: <http://apps.who.int/phint/en/p/about/>.
Acessed on: 12 Feb. 2011.
UNITED STATES PHARMACOPEIA. 34.ed. Rockville: The
United States Pharmacopeial Convention, 2011. p.95-106.
Received for publication on 16th September 2011