ABSTRACT: Genome association analyses have been successful in identifying quantitative trait loci (QTLs) for pig body weights measured at a single age. However, when considering the whole weight trajectories over time in the context of genome association analyses, it is important to look at the markers that affect growth curve parameters. The easiest way to consider them is via the two-step method, in which the growth curve parameters and marker effects are esti-mated separately, thereby resulting in a reduction of the statistical power and the precision of estimates. One efficient solution is to adopt nonlinear mixed models (NMM), which enables a joint modeling of the individual growth curves and marker effects. Our aim was to propose a genome association analysis for growth curves in pigs based on NMM as well as to compare it with the traditional two-step method. In addition, we also aimed to identify the nearest candidate genes related to significant SNP (single nucleotide polymorphism) markers. The NMM presented a higher number of significant SNPs for adult weight (A) and maturity rate (K), and provided a direct way to test SNP significance simultaneously for both the A and K parameters. Furthermore, all significant SNPs from the two-step method were also reported in the NMM analysis. The ontology of the three candidate genes (SH3BGRL2, MAPK14, and MYL9) derived from significant SNPs (simultaneously affecting A and K) allows us to make inferences with regards to their contribution to the pig growth process in the population studied.
Keywords: SNP markers, body weight, longitudinal data 1Federal University of Viçosa − Dept. of Animal Science, Av.
Peter Henry Rolfs, s/n − 36570-000 − Viçosa, MG − Brazil. 2University of Nariño − Dept. of Animal Science, Ciudad Universitaria, Clle 18 Cr 50 − San Juan de Pasto − Colombia.
3University of Zaragoza − Dept. of Anatomy, Embryology and Genetics, E-50013 − Zaragoza − Spain.
4Embrapa Dairy Cattle, R. Eugênio do Nascimento, 610 − 36038-330 − Juiz de Fora, MG − Brazil.
5Embrapa Forestry, Estrada da Ribeira, 111, km 111, C.P. 319 – 83411-000 − Colombo, PR − Brazil.
*Corresponding author <[email protected]>
Edited by: Gerson Barreto Mourão
Genome association study through nonlinear mixed models revealed new candidate
Fabyano Fonseca e Silva1*, Maria Fernanda Betancur Zambrano1,2, Luis Varona3, Leonardo Siqueira Glória1, Paulo Sávio Lopes1,
Marcos Vinícius Gualberto Barbosa Silva4, Wagner Arbex4, Sirlene Fernandes Lázaro1, Marcos Deon Vilela de Resende5, Simone
Eliza Facioni Guimarães1
Received January 19, 2016
Accepted March 02, 2016
Introduction
Differences in individual growth curves reflect partly genetic influences, with multiple genes contrib-uting at different levels to the overall growth trajectory. In the current post-genomic era, the understanding of the genetic architecture of pig growth cannot be limited simply to the detection of QTLs for body weights at a specific age (Ai et al., 2012; Yoo et al., 2014). It can be extended for a more general purpose by considering whole growth trajectories over time as phenotypes.
Traditionally, the easiest way to consider the whole growth trajectory directly in animal breeding models is the two-step method, in which fitting the individual growth curve (step 1) and genetic analysis (step 2) are considered separately. However, the growth-curve coefficients and genetic effects are not estimated jointly in the same model, and this may result in a reduction of statistical power and precision of estimates (Varona et al., 1999; Blasco et al., 2003; Ibañez-Escriche and Blasco, 2011). One efficient solution is to adopt nonlinear mixed models, which enables a joint modeling of the individual growth curves and genetic effects. Although this class of models has already been adopted for the traditional (Varona et al., 1999; Blasco et al., 2003) and genomic (Ibañez-Escriche and Blasco, 2011) prediction of breeding values, there are no reports about their use in genome association analyses.
Another interesting point in these analyses is the identification of the candidate genes most closely related to significant SNPs. There are studies considering this gene identification for growth curve parameters in hu-mans (Das et al., 2011a) and cattle (Crispim et al., 2015), but for pig growth curves, this approach has not been employed in previous studies.
In this context, we aimed to propose a genome association analysis for growth curves in pigs based on nonlinear mixed models and the traditional two-step method. Additionally, we aimed to identify candidate genes related to significant SNPs whose biological func-tions can be useful in explaining the genetic basis of postnatal growth in pigs.
Materials and Methods
Experimental population and phenotypic data
als were crossed to produce the F2 population, of which 345 animals were weighed at birth and at 21, 42, 63, 77, 105, and 150 days of age. The use of these animals was reviewed and approved by the Bioethics committee of the Department of Animal Science (DZO-UFV) in agree-ment with the Guide to the Care and Use of Experimen-tal Animals of the Canadian Council on Animal Care.
DNA extraction, genotyping, and SNP quality control
Genomic DNA was extracted from the white cells of parental, F1, and F2 animals; more details can be found in Band et al., 2005b. The low-density customized SNPChip with 384 markers was based on the Illumina Porcine SNP60 BeadChip (San Diego, CA, USA, Ramos et al., 2009). These SNPs were selected according to QTL positions that had been previously identified in this pop-ulation by using meta-analyses (Silva et al., 2011) and fine mapping (Hidalgo et al., 2013; Verardo et al., 2015). Thus, although a small number of markers have been used, the customized SNPchip based on previously iden-tified QTL positions ensures appropriate coverage of the relevant genome regions in this population. From these, 66 SNPs were discarded because of a low-genotyping call rate (< 0.95), and from the remaining 318 SNPs, 81 were discarded due to a minor allele frequency (MAF) < 0.05. Thus, 237 SNP markers were distributed on the Sus scrofa chromosomes (SSC) as follows: SSC1 (56), SSC4 (54), SSC7 (59), SSC8 (30), SSC17 (25), and SSCX (13). The average distance between markers within each chromosome was equal to 5.17, 2.37, 2.25, 3.93, 2.68, and 11.0 Mb, respectively, for SSC1, SSC4, SSC7, SSC8, SSC17, and SSCX.
Proposed genome association analyses through nonlinear mixed models (NMM)
The NMM are based on a mean curve that is fitted to the population, so that the individual curves, incor-porating the random effects of each individual, appear as deviations from this mean curve. Similarly, particular curves for fixed effects, like SNPs in genome association analyses and other systematic effects (contemporary groups), can also be directly accessed.
Five of the most widely used nonlinear regression models (Brody, Gompertz, logistic, von Bertalanffy, and Richards) to describe animal growth curves were fitted to the phenotypic data (345 animals weighed at birth and at 21, 42, 63, 77, 105, and 150 days of age) by using the nlme (Linear and Nonlinear Mixed Effects Models) R (R Development Core Team, 2015) software package. The nonlinear logistic mixed model outperformed the oth-ers in relation to the AIC (Akaike Information Criterion) and BIC (Bayesian Information Criterion) criteria and was chosen to describe the pig growth curves. The basic form of the logistic model (Ratkowsky, 1983) is defined as follows:
1 exp(
i
ij ij
i i ij
A
w e
b K t
= +
+ −
, (1)
where wij is the weight of the animal i at age (t) j; Ai is the mature (adult) weight (kg); Ki is the maturing rate (a growth precocity measure, or the general growth rate); bi is the integration parameter, which has no biological interpretation but is essential to providing the sigmoid shape of the curve; and eij is a residual term, assumed to be independent and normally distributed, (0, 2)
ij e
e N σ .
In the context of NMM, the parameters (Ai, bi, and Ki) in (1) can be modeled by using a linear mixed model, which considers the fixed and random effects of interest. In the present study, the contemporary group (combina-tion of sexes, batches, and halothane gene genotypes), five principal components (PC1, PC2, …, PC5) of the geno-type matrix (M) and SNP were assumed to be fixed ef-fects, while the individual animal effects were assumed to be random effects. The fixed PC effects were used to account for population-specific (substructures) variations in the distribution of alleles on the SNPs under investiga-tion. Such population substructures mainly arise as a con-sequence of varying frequencies in minor alleles due to systematic ancestry differences, and the presence of these substructures can cause spurious SNP associations (Price et al., 2006). Thus, by adding the PCs as fixed covariates in the models that were used for genome association analy-ses, we can point to groups of individuals that differ at the level of minor allele frequencies (Patterson et al., 2006).
The contemporary group (CG) effects were con-sidered to correct the phenotype for non-genetic effects that can influence the significance of SNP effects, and the individual random effects are included to correct for the influence of observational units (in this case, the animals) associated with the sampled phenotype. In fact, these random effects work like a special residual term that is specific to each growth curve parameter. In sum-mary, NMM account simultaneously for both fixed and random effects of the growth curve parameters, which support the joint estimation of these parameters of in-terest (for example, adult weight and maturity rate) to-gether with SNP effects.
In view of these considerations, the genome asso-ciation analysis model for growth curve parameters was proposed by accommodating fixed and random effects for the parameters A and K. This corresponds to a linear model to explain variations in these parameters, within a general nonlinear model that describes the growth be-havior of the animals over time. The null model (i.e., without SNP effects) was defined as follows:
(
)
{
1 exp}
i
i
A A
ij ij
b K K ij
CG PC
w e
CG PC t
µ + + + ξ
= +
+ µ − µ + + + ξ . (2)
and principal components (as a covariate), respectively; and ξAi and ξKi are the specific residual terms (random individual effects) for the parameters A and K. These are assumed to be jointly distributed as
( )
0,i i A K N ξ Σ ξ ,
where 0 is a vector of zero means and Σ is a residual covariance between these parameters:
2 , 2 ,
A A K
A K K
σ σ
=
σ σ
∑
,where 2
A σ and 2
K
σ are the specific residual variances of each parameter, and σA,K is the residual covariance be-tween them.
At this point, it is worth emphasizing that another advantage of NMM over the traditional two-step method is this joint modeling of residual effects, since the cor-relation between growth curve parameters exists and must be incorporated, when modeling, into the genetic models (Varona et al., 1999; Blasco et al., 2003; Ibañez-Escriche and Blasco, 2011). Note that for parameter b, it was assumed that the model contained only a general mean (µb) since this parameter showed no variation be-tween individuals, contributing to several convergence problems. Furthermore, this parameter does not have biological interpretations like the A and K parameters.
The full model that was contrasted with the null model presented in (2) was defined as follows:
(
)
{
µ + + + + ξ}
= +
+ µ − µ + + + + ξ
1 exp
i i
A A
ij ij
b K K ij
SNP CG PC
W e
SNP CG PC t
. (3)
This model assumes that the parameters A and K are also affected by SNP effects, in addition to the fixed and random effects described in (2). It is important to note that this model suggests that the same SNP marker simultaneously affects both the adult weight (A) and ma-turity rate (K) parameters. Thus, due to this significance, one given SNP can be characterized as a relevant marker which explains the growth process in pigs. On the other hand, intermediary models that assume the SNP marker separately affect A (model in 4) or K (model in 5) and can also be proposed as follows:
(
)
{
1 exp}
µ + + + + ξ
= +
+ µ − µ + + + ξ
i
i
A A
ij ij
b K K ij
SNP CG PC
W e
CG PC t
, (4)
(
)
{
1}
i
i
A A
ij ij
b K K ij
CG PC
W e
exp SNP CG PC t
µ + + + ξ
= +
+ µ − µ + + + + ξ ,
(5)
To draw conclusions regarding the statistical sig-nificance of each SNP, the models in (3), (4), and (5) were compared with the null model in (2) by using the like-lihood ratio test (LRT) under a general null hypothesis (H0: there is no effect of the SNP marker), contrasted with specific alternative hypotheses (H1AK: SNP effect
si-multaneously on A and K parameters; H1A: SNP effect only on A parameter; H1K: SNP effect only on K param-eter). The testing of hypotheses H1AK, H1A, and H1K can be performed, respectively, by the assessment of the follow-ing LRT statistics:
2 21
3
AK
max of the likelihood of model
LRT n
max of the likelihood of model
= − , 2 21 4 A
max of the likelihood of model
LRT n
max of the likelihood of model
= −
, and
2 21
5
K
max of the likelihood of model
LRT n
max of the likelihood of model
= −
These LRT values are assumed to be chi-squared (χ2) distributed with D degrees of freedom, where D is
the difference between the number of parameters of the two models compared.
Following the general philosophy of the genome association analyses, the models in (2), (3), (4), and (5) were fitted (by the Maximum Likelihood Method in the package nlme of R) separately for each of the SNP markers considered, thus leading to the problem of multiple independent statistical tests. Adjustments for these multiple comparisons are needed to avoid spuri-ous SNP associations due to the application of a large number of tests. A strategy to correct for the simultane-ous inference of many tests is the false discovery rate (FDR), which provides a practical balance between the true and false positive rates that were considered in these tests. The FDR control is accomplished by using a direct correction of original p-values, which shall be called q-values. In the present study, the original p-val-ues from LRT tests were transformed into q-valp-val-ues (the FDR correction) by using the function q-value of the R/ bioconductor software. The 5 % significance level was used as a threshold.
Genome association analyses through the tradition-al two-step method
In the traditional two-step method, which is differ-ent from the NMM, there are two distinct analyses; the first one is related to individual fitting (independently for each animal) of the nonlinear model in (1) and the sec-ond one to the fitting of traditional genome association analysis linear models while assuming the phenotypes to be the estimates that were provided by the previous analysis. These linear models which were considered in the second step were determined as follows:
ˆ
i
i A A
A = µ +SNP+CG+PC+ ξ and
ˆ
i
i K K
The significance of each SNP was accessed via a simple Student’s t-test. Since these models were also fit-ted independently for each SNP, the FDR correction was also used to address the problem of multiple tests. The previously mentioned linear models were implemented by using the GWAS (Genome Wide Association Studies) function of the package rrBLUP in the R software. The original p-values that were reported in the output were transformed into q-values (FDR correction) as they had been previously done for NMM. Although the poorer performance of the two-step method has already been reported in the context of other mixed models in animal breeding (Varona et al., 1999; Blasco et al., 2003; Ibañez-Escriche and Blasco, 2011), to date there has been no mention of this performance when considering genome association analysis models.
SNP derived candidate gene annotation
We exploited the biological mechanism of the pig growth curve by taking into consideration the functions of the annotated genes underlying the significant SNP markers (q-value < 0.05). To track the genes that were within or close to the markers, we used the package Map-2NCBI (Hanna and Riley, 2014) of the R software based on the Sscrofa10.2 assembly of the pig genome sequence. Information about the identity and function of an-notated genes at mapped SNP markers were obtained from the chromosomal positions at the Ensembl Genome Browser 2015 (http://www.ensembl.org/index.html). Lists of the genes that are located closest to the significant SNPs were extracted while allowing for a maximum distance of 1 Mb between the SNP and the annotated genes. Putative genes that were identified for pig breeds were established by a BLAST Homology search of known, identified human gene transcripts, which were downloaded from the ge-nome databanks of the National Center for Biotechnology Information (NCBI) (http://www.ncbi.nlm.nih.gov/books/ NBK143764/). The biological function of these genes and their possible relation to growth curve traits were inves-tigated, and where no information was available for the Sus scrofa genes, human, rat, and mouse biological func-tion annotafunc-tions were used to proceed with the in-silico functional analyses. The Animal QTL database(Hu et al., 2013) was accessed to verify previous QTL that were re-ported for growth curve traits in the surrounding regions of the significant SNPs. With this approach, it was pos-sible to identify the biological mechanisms and functions involving the identified genes as well as to highlight the most relevant genes that are putatively associated with growth curve parameters in pigs.
Results
To determine the nonlinear model that best de-scribes the growth curve of the studied pig population, the AIC and BIC goodness of fit measures were used. The following values were obtained for these criteria: Brody (AIC = 1297.36 and BIC = 1313.16), Gompertz (AIC =
1291.42 and BIC = 1309.11), logistic (AIC = 1282.18 and BIC = 1301.01), von Bertalanffy (AIC = 1293.42 and BIC = 1310.00), and Richards (AIC = 1284.56 and BIC = 1304.88). These results revealed the superiority of the logistic model, which was chosen to describe the pig growth curves in the subsequent analyses.
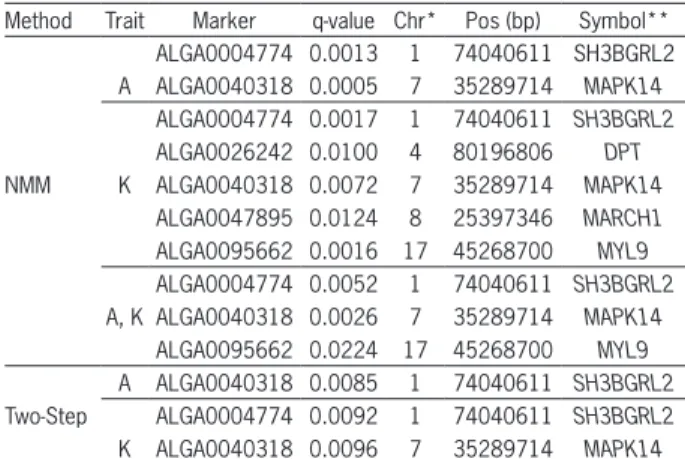
The list of significant SNPs based on nonlinear mixed models (NMM) and the traditional two-step meth-od that affect the adult weight (A) and maturity rate (K) in pigs, as well as their genome positions and related genes, (using the NCBI nomenclature) is shown in Table 1.
The NMM provided significant SNPs for param-eter A, which were located on SSC1 and SSC7, whereas for parameter K the SNPs were located on SSC1, SSC4, SSC7, SSC8, and SSC17 (Table 1). On the other hand, when using the two-step method, the significant SNP for parameter A was located only on chromosome SSC1, whereas for parameter K, the SNPs were located on chromosomes SSC1 and SSC7 (Table 1). The number of significant SNPs from NMM was higher than the num-ber from the two-step approach, and the identification of markers simultaneously affecting parameters A and K (model in 3) provided extra information about chro-mosome regions governing the growth trajectory in pigs. Of the significant SNPs simultaneously affecting A and K parameter estimates (i.e. using the NMM view-point), we found the three genes SH3BGRL2, MAPK14, and MYL9 in the chromosome regions of these SNPS. In the same context, two SNPs (ALGA0026242 and ALGA0047895) were identified from significant SNPs that affected only the maturing rate parameter (K).
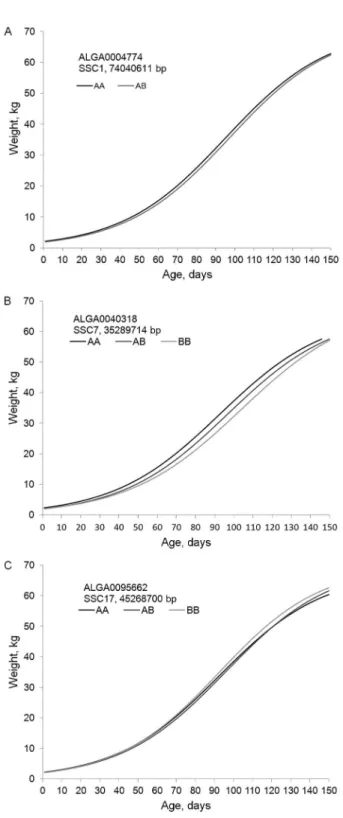
With the aim of visualizing the estimated effect of each significant SNP on the whole growth trajectory in pigs, genotypic curves for these markers were plot-ted in Figure 1. We opplot-ted to show only significant mark-ers that had simultaneously influenced the adult weight
Table 1 − Significant SNP associations for adult weight (A) and maturity rate (K) across different genome association analyses methods (nonlinear mixed models-NMM and two-step).
Method Trait Marker q-value Chr* Pos (bp) Symbol** ALGA0004774 0.0013 1 74040611 SH3BGRL2 A ALGA0040318 0.0005 7 35289714 MAPK14
ALGA0004774 0.0017 1 74040611 SH3BGRL2 ALGA0026242 0.0100 4 80196806 DPT
NMM K ALGA0040318 0.0072 7 35289714 MAPK14
ALGA0047895 0.0124 8 25397346 MARCH1 ALGA0095662 0.0016 17 45268700 MYL9 ALGA0004774 0.0052 1 74040611 SH3BGRL2 A, K ALGA0040318 0.0026 7 35289714 MAPK14
(A) and maturity rate (K). Thus, we used the markers ALGA0004774, ALGA0040318, and ALGA0095662 from genome association analyses based on NMM as
present-ed in Table 1 (trait A,K). Each estimatpresent-ed curve was ob-tained by using the following:
(
)
{
ˆ ˆ}
ˆ
ˆ
ˆ ˆ
1 exp
A g
gj
b k g j
SNP X
W
SNP X t
µ + ×
=
+ µ − µ + ×
,
where the estimated SNP effect was reported by the fit-ting of NMM and Xg, which represents each possible genotype (0, 1, and 2; respectively for the genotypes AA, AB, and BB according to A-B notation from Illumina Porcine SNP60 BeadChip). This equation was applied to each significant SNP, thus generating three different curves, one for each genotype. The larger the difference between these three curves, the larger the marker effect on the growth curve of the animals.
Based on the functional study of genes underly-ing the significant SNP markers, a number of candidate genes could be identified and these are shown in Table 1.
Discussion
Genome association analyses through nonlinear mixed models and the two-step method
The growth of pigs is a process that depends, among others, on genetic effects acting over time. The inclusion of a time dimension in the model would al-low us to address questions related to genetic effects throughout the life span of the animals. We presented a modeling framework that integrates growth curve analy-ses and SNP association studies simultaneously under a nonlinear mixed model (NMM) approach.
Table 1 shows that, when compared with the tra-ditional two-step, NMM detected a higher number of sig-nificant SNP associations for both the adult weight (A) and maturity rate (K) traits. Furthermore, NMM also provides a direct way to test the SNP significance simultaneously for both A and K, and all significant SNPs that were identi-fied for A and K by using the two-step method were also detected in the NMM analysis. Thus, the two-step method did not reveal new significant markers in relation to NMM.
In summary, the standard two-step method, when considering growth curve analyses, has several drawbacks. It depends on how well the fixed nonlinear model fits in the first step, since the estimates provided are considered to be the phenotypes in the second step (genome associa-tion study). Thus, a non-satisfactory fit in the first step di-rectly results in non-reliable phenotypes in the second step, and consequently, in inaccurate estimates of SNP effects. It does not provide an explicit estimate of individual-level variations in the parameter estimates, which can be seen as the random individual effect under an NMM approach. Thus, ignoring the individual deviation estimates can lead to underestimated standard errors of parameter estimates, which in this case are the SNP effects.
One of the major advantages of the NMM approach is that it can discern the influence of genotypes on rel-evant loci over the growth curve trajectory, thus revealing age-related changes due to genetic influences on body size
during post-natal growth development. It can have great implications for the design of an efficient marker assisted selection (MAS) program in pigs, since the information on individual genotypes at relevant loci (Figure 1) can be used as an extra-criterion for the estimated breeding val-ues (EBV) with regards to the selection of the most desir-able animals from a genetic viewpoint.
Generally, a marker assisted selection (MAS) strat-egy can be achieved by ranking the animals by EBVs (or one related selection index) for growth performance, and the subsequent mating of selected males and females can be targeted by using SNP-specific genotypes to fa-cilitate the fixation of favorable alleles (after identifying the gametic linkage disequilibrium phase). For example, in Figure 1 it is possible to note the differences in the curve shapes when considering the genotypes for each one of the significant SNPs. Particularly for the SNPs ALGA0004774 (Figure 1A) and ALGA0040318 (Figure 1B), the growth curve for the genotype AA outperformed the other genotypes (AB and BB), while for the SNP ALGA0095662, the genotype BB showed better results in terms of the growth curve shape in pigs.
Although this type of interpretation (Figure 1C) is valid and relevant for MAS, it has not been exploited in the field of animal breeding. On the other hand, in hu-man genetics, the SNP effect with genotype differentia-tion trajectories over time has been studied to detect the genetic influence on dynamic traits. Das et al. (2011a) plotted and interpreted age-specific trajectories of the body mass index (BMI) in different sexes for three geno-types at each significant SNP that was detected from the various chromosomes. Analogously, Das et al. (2011b) fitted mean curves for different genotypes and comput-ed the additive and dominant SNP effects over time for blood pressure in the different sexes. Both of these stud-ies exploited the estimation of the SNP effect over time by using polynomial random regression models (that are theoretically linear) because disease trajectories over time do not show a well-known longitudinal behavior. In light of the present study, when working with growth curves whose longitudinal profiles are proven to be sig-moidal, the use of nonlinear mixed models can be seen as a new insight into genome association analyses. Thus, mainly in the field of animal breeding, the use of NMM can increase knowledge of the genetic architecture of other important economical and longitudinal traits such as milk and egg production.
In addition to all of the practical connotations of pig breeding plans and MAS from genome association analyses through NMM, the identified significant SNPs can also be exploited while asking and addressing bio-logical questions by identifying candidate genes behind these SNPs as well as by interpreting their functions in the genetics of pig growth.
SNP derived candidate gene annotation
In relation to the SH3BGRL2 (SH3 Domain Bind-ing Glutamate-Rich Protein) gene located at SSC1 (Table
1), Mazzocco et al. (2002) mentioned that some proteins that are coded from this gene are highly homologous to the N-terminal region of the SH3BGR protein and ap-pear to be related to thioredoxin, one of whose functions may be to promote the growth hormone in tissue-cul-ture cells. In the context of growth related genes, several studies have found significant QTL affecting the weight and feed efficient traits in this same region of the SH3B-GRL2 gene. Geldermann et al. (2010) found QTL for car-cass weights when considering different F2 pig popula-tions and Beeckmann et al. (2003) reported QTL related to feed intake by using F2 families based on crosses of Meishan, Pietrain, and Wild Boar.
The protein encoded by the MAPK14 (Mitogen-Activated Protein Kinase) gene is a member of the MAP (Mitogen-Activated Protein) kinase family. MAP kinases act as an integration point for multiple biochemical sig-nals and are involved in a wide variety of cellular pro-cesses such as proliferation, differentiation, transcrip-tion, regulatranscrip-tion, and development. In this context, Evans et al. (2003) identified significant QTL in the region of the MAPK14 gene for average daily gain (ADG) when considering commercial populations based on Large White, Landrace, Hampshire, Pietrain, and Meishan pigs. Analogously, Fontanesi et al. (2014) also found sig-nificant QTL for ADG when considering a population of Italian Large White pigs.
Regarding the MYL9 (Myosin Regulatory Light Chain) gene, Fan et al. (2011) reported an important role of this gene in pathways involving bone and cartilage development, muscle growth, and development while considering different spatial and temporal stages. In this same region, Onteru et al. (2013) reported significant QTL for ADG when considering Yorkshire derived lines. Similarly, Pierzchala et al. (2003) detected significant QTLs for ADG in this region when using purebred pigs of the three genetically diverse founder groups: Meis-han, Pietrain, and European Wild Boar.
In summary, whereas the genome association anal-yses is an unbiased search of the entire genome without any assumptions about the role of a certain gene, the candidate gene approach allows researchers to investi-gate the validity of genes regarding the genetic basis of a complex trait. Thus, when combining these two ap-proaches in the same study, we have the advantage of identifying candidate genes from the same population in which significant markers were identified for the traits of interest. Since the first critical step in conducting can-didate gene studies is the choice of a suitable gene which may plausibly play a relevant role in the traits studied, the ontology of the three genes (SH3BGRL2, MAPK14, and MYL9) derived from significant SNPs (simultaneous-ly affecting A and K in Table 1) allows us to make infer-ences about their contribution to the pig growth process in the population that was considered.
analyses could be carried out by considering contrasting conditions, such as groups of animals that are genetically different in relation to their growth curve shapes. These groups can be selected, for example, by means of the predicted genomic breeding values for the growth curve parameter as presented by Silva et al. (2013).
Acknowledgements
This study was supported mainly by CAPES/DGU (Coordination for the Improvement of Higher Education Personnel - Brazil / General Direction of University Policy - Spain). We also thank CNPq (Brazilian National Council for Scientific and Technological Development) and FAPEMIG (Minas Gerais State Foundation for Research Support).
References
Ai, H.; Ren, J.; Zhang, Z.; Ma, J.; Guo, Y.; Yang, B.; Huang, L. 2012. Detection of quantitative trait loci for growth- and fatness-related traits in a large-scale White Duroc × Erhualian intercross pig population. Animal Genetics 43: 383-391. Beeckmann, P.; Schroffel, J.; Moser, G.; Bartenschlager, H.;
Reiner, G.; Geldermann, H. 2003. Linkage and QTL mapping for Sus scrofa chromosome. Journal of Animal Breeding and Genetics 120: 1-10.
Blasco, A.; Piles, M.; Varona, L. 2003. A Bayesian analysis of the effect of selection for growth rate on growth curves in rabbits. Genetics Selection Evolution 35: 21-41.
Crispim, A.C.; Kelly, M.J.; Guimarães, S.E.F.; Silva, F.F.; Fortes, M.R.S.; Wenceslau, R.R.; Moore, S. 2015. Multi-trait GWAS and new candidate genes annotation for growth curve parameters in Brahman cattle. Plos One 10: 1-19.
Das, K.; Li, J.; Wang, Z.; Tong, C.; Fu, G.; Li, Y.; Xu, M.; Ahn, K.; Mauger, D.; Li, W. 2011a. A dynamic model for genome-wide association studies. Human Genetics 129: 629-639.
Das, K.; Li, J.; Fu, G.; Wang, Z.; Wub, R. 2011b. Genome-wide association studies for bivariate sparse longitudinal data. Human Heredity 72: 110-120.
Evans, G.J.; Giuffra, E.; Sanchez, A.; Kerje, S.; Davalos, G.; Vidal, O.; Illán, S.; Noguera, J.L.; Varona, L.; Velander, I.; Southwood, O.I.; Koning, D.J.; Haley, C.S.; Plastow, G.S.; Andersson, L. 2003. Identification of quantitative trait loci for production traits in commercial pig populations. Genetics 164: 621-627. Fan, B.; Onteru, S.K.; Du, Z.Q.; Garrick, D.J.; Stalder, K.J.
2011. Genome-wide association study identifies loci for body composition and structural soundness traits in pigs. Plos One 6: e14726.
Fontanesi, L.; Schiavo, G.; Galimberti, G.; Calo, D.G.; Russo, V.A. 2014. Genome wide association study for average daily gain in Italian large white pigs. Journal of Animal Science 92: 1385-1394. Geldermann, H.; Cepica, S.; Stratil, A.; Bartenschlager, H.;
Preuss, S. 2010. Genome-wide mapping of quantitative trait loci for fatness, fat cell characteristics and fat metabolism in three porcine F2 crosses. Genetics Selection Evolution 42: 31. Hanna, L.L.H.; Riley, D.G. 2014. Mapping genomic markers to
closest feature using the R package Map2NCBI. Livestock Science 162: 59-65.
Hu, Z.L.; Park, C.A.; Wu, X.L.; Reecy, J.M. 2013. Animal QTLdb: an improved database tool for livestock animal QTL/ association data dissemination in the post-genome era. Nucleic Acids Research 41: 871-879.
Hidalgo, A.M.; Lopes, P.S.; Paixão, D.M.; Silva, F.F.; Bastiaansen, J.W.; Paiva S.R.; Faria, D.A.; Guimarães, S.E.F. 2013. Fine mapping and single nucleotide polymorphism effects estimation on pig chromosomes 1, 4, 7, 8, 17 and X. Genetics and Molecular Biology 36: 511-519.
Ibañez-Escriche, N.; Blasco, A. 2011. Modifying growth curve parameters by multitrait genomic selection. Journal of Animal Science 89: 661-668.
Mazzocco, M.; Maffei, M.; Egeo, A.; Vergano, A.; Arrigo, P.; Di, L.R.; Ghiotto, F.; Scartezzini, P. 2002. The identification of a novel human homologue of the SH3 binding glutamic acid-rich (SH3BGR) gene establishes a new family of highly conserved small proteins related to thioredoxin superfamily. Gene 291: 233-239.
Onteru, S.K.; Gorbach, D.M.; Young, J.M.; Garrick, D.J.; Dekkers, J.C.; Rothschild, M.F. 2013. Whole genome association studies of residual feed intake and related traits in the pig. Plos One 8: e61756.
Patterson, N.; Price, A.L.; Reich, D. 2006. Population structure and eigenanalysis. Plos Genetics 2: 2074-2093.
Pierzchala, M.; Cieslak, D.; Reiner, G.; Bartenschlager, H.; Moser, G.; Geldermann, H. 2003. Linkage and QTL mapping for Sus scrofa chromosome 17. Journal of Animal Breeding and Genetics 120: 132-137.
Price, A.L.; Patterson, N.J.; Plenge, R.M.; Weinblatt, M.E.; Shadick, N.A.; Reich, D. 2006. Principal components analysis corrects for stratification in genome-wide association studies. Nature Genetics 38: 904-909.
R Development Core Team. 2015. R: a language and environment for statistical computing. Available at: https://cran.r-project. org/ [Accessed Sept 14, 2015]
Ratkowsky, D.A. 1983. Nonlinear Regression Modeling: A Unified Practical Approach. Marcel Dekker, New York, NY, USA. Silva, K.M.; Knol, E.F.; Merks, J.W.M.; Guimarães, S.E.F.;
Bastiaansen, J.W.M.; Van Arendonk, J.A.M.; Lopes, P.S. 2011. Meta-analysis of results from quantitative trait loci mapping studies on pig chromosome 4. Animal Genetics 42: 280-292. Silva, F.F.; Resende, M.D.V.; Rocha, G.S.; Duarte, D.A.; Lopes,
P.S.; Brustolini, O.J.; Thus, S.; Viana, J.M.; Guimarães, S.E.F. 2013. Genomic growth curves of an outbred pig population. Genetics and Molecular Biology 36: 520-527.
Varona, L.; Moreno, C.; Garcia-Cortés, L.A.; Yague, G.; Altarriba, J. 1999. Two-step vs. joint analysis of Von Bertalanffy function. Journal of Animal Breeding and Genetics 116: 331-338. Verardo, L.; Silva, F.F.; Varona, L.; Resende, M.D.V.; Bastiaansen,
J.W.; Lopes, P.S.; Guimarães, S.E.F. 2015. Bayesian GWAS and network analysis revealed new candidate genes for number of teats in pigs. Journal of Applied Genetics 56: 123-132. Yoo, C.K.; Park, H.B.; Lee, J.B.; Jung, E.J.; Kim, B.M.; Kim, H.I.;