PLANTING DENSITY AND INITIAL GROWTH OF TWO TREE SPECIES
ADAPTED TO THE SEMI-ARID REGION
1Paulo Sérgio Lima e Silva2, Alexandre Emanuel Régis Holanda3, Haroldo Nogueira de Paiva4, Fábio Henrique Tavares de Oliveira5 e Odaci Fernandes de Oliveira6
ABSTRACT– Planting densities influence several aspects of forest formation, including management practices, timber yield, quality, and extraction, and consequently its production costs. The objective of this study was to evaluate Mimosa caesalpiinifolia and Gliricidia sepium growth as a function of planting density (400,
600, 800, 1000, and 1200 plants ha-1) and plant age. The species were evaluated every 90 days for plant height (PH), crown diameter (CD) and root collar diameter (RCD) (10 cm above the ground), with the first evaluation performed at 90 days and the last at 720 days. When plants were one year of age and beyond, evaluations were conducted also for stem diameter at breast height (DBH) (1.30 m above the ground). A randomized block design with split-plots and three replicates was adopted. Species were assigned to plots, planting densities were assigned to subplots, and evaluation ages were assigned to subsubplots. The four traits in both species had their values decreased as planting density increased, but continually increased as plant age increased. For PH and RCD there was an alternation between species superiority, with gliricidia being superior to sabiá at some ages, while the opposite occurred at other ages. As to CD the species only differed in the last measurement, gliricidia being superior. With regard to DBH, gliricidia was superior starting from the second measurement. There was an effect of the species × ages interaction for the four traits and also an effect of the densities × ages interaction for CD and DBH.
Keywords: Mimosa caesalpiinifolia Benth, Gliricidia sepium (Jacq.) Steud and Caatinga.
DENSIDADE DE PLANTIO E CRESCIMENTO INICIAL DE DUAS ESPÉCIES
ARBÓREAS ADAPTADAS AO SEMIÁRIDO
RESUMO – A densidade de plantio influencia vários aspectos da formação das florestas, incluindo tratos culturais, rendimento e qualidade da madeira, sua extração e, consequentemente, custos de produção. O objetivo do trabalho foi avaliar o crescimento da Mimosa caesalpiniifolia e da Gliricidia sepium, em razão da densidade de plantio (400, 600, 800, 1.000 e 1.200 plantas ha-1) e da idade da planta. As espécies foram
avaliadas quanto à altura da planta (AP) e quanto aos diâmetros da copa (DCP) e do colo (DCO) (a 10 cm do nível do solo), de 90 em 90 dias, sendo a primeira avaliação realizada aos 90 dias e a última aos 720 dias. A partir de 1 ano de idade das plantas, foi avaliado também o diâmetro do caule à altura do peito (DAP) (a 1,30 m do nível do solo). Utilizou-se o delineamento de blocos casualizados com parcelas subsubdivididas e três repetições. As espécies foram aplicadas às parcelas, às densidades de plantio, às subparcelas, às idades de avaliação e às subsubparcelas. O aumento da densidade de plantio reduziu as quatro características estudadas nas duas espécies, que aumentaram continuamente com o incremento da idade das plantas. Na AP e no DCO, houve alternância de superioridade das espécies, com a gliricídia sendo superior à sabiá
1 Recebido em 07.04.2011 aceito para publicação em 04.06.2012.
2 Universidade Federal Rural do Semi Árido (antiga ESAM), Departamento de Ciências Vegetais. E-mail: <[email protected]>. 3 Universidade Federal do Ceará, Centro de Ciências, Departamento de Biologia. E-mail: <[email protected]>. 4 Universidade Federal de Viçosa, Centro de Ciências Agrárias, Departamento de Engenharia Florestal. E-mail: <[email protected]>. 5 Universidade Federal Rural do Semiárido, Departamento de Ciências Ambientais e Tecnológicas, Laboratório de Fertilidade do Solo e Nutrição de plantas. E-mail: <[email protected]>.
em algumas idades, ocorrendo o inverso em outras idades. No DCP, as espécies somente diferiram na última mensuração, com superioridade da gliricídia. No DAP, a gliricídia foi superior a partir da segunda mensuração. Houve efeito da interação espécies x idades nas quatro características e da interação densidades x idades em DCP e DAP.
Palavras-chave: Mimosa caesalpiniifolia Benth, Gliricidia sepium(Jacq.) Steud e Caatinga.
1. INTRODUCTION
The northeastern region of Brazil has 1,558,196 km2, which represents just over 18% of the area of the country. The Brazilian semiarid region has an area of 982,563 km2, with approximately 90% of it located in the Northeast (IBGE, 2007). The Caatinga biome has an area of 844,453 km2 and is fully inserted in the Brazilian semiarid region, including nine states (IBGE, 2004). This biome is becoming degraded for various reasons, including the practice of shifting agriculture, where new areas are constantly being deforested by small growers and by large agricultural companies, and the exploitation of forest resources, which are attractive because they generate additional income and are important sources of energy.
Sabiá (Mimosa caesalpiniifolia Benth.) is a rugged, fast-growing legume native to the Brazilian Northeast, providing forage, timber, pollen, and nectar for bees, and is used in folk medicine and as an ornamental plant (MAIA, 2004). In spite of its importance for the Semi-Arid Region of Brazil, sabiá is considered a species with a tendency to become extinct, like other species (SANTOS et al., 2007), due to its intense utilization (MAIA, 2004). Gliricidia (Gliricidia sepium (Jacq.) Steud.) is also a rugged, fast-growing legume that provides timber and forage. It was introduced into Brazil from Central America in the 1980’s and has attracted the attention of growers from several parts of the world, including the Brazilian Northeastern region (KILL; MENEZES, 2005).
The growth evaluation of these species as a function of their planting densities provides information for the commercial exploitation of their products, especially timber and forage, and for their utilization in agroforestry systems. The commercial exploitation of both species would result in social and economic benefits and would help reduce degradation in the Caatinga. Reforestation programs are frequently encouraged worldwide because of their environmental and social benefits (creation of jobs and income), preservation of biodiversity, production of timber and biofuels, and carbon
sequestration (CALDER, 2007). Demand for firewood, timber, forage, and other products has increased the use of multiple-use, fast-growing tree species in several tropical countries (FAO, 2011). Agroforestry systems can also contribute towards reducing deforestation and environmental degradation problems (MIRANDA; VALENTIM, 2000) and often require the addition of fast-growing trees; it is therefore interesting to identify the most suitable tree species (MIRANDA; VALENTIM, 2000).
The objective of this study was to evaluate sabiá and gliricidia growth during the first two years of age as a function of planting density and plant age.
2. MATERIAL AND METHODS
The study was conducted at Fazenda Experimental “Rafael Fernandes” (Experimental Farm), Universidade Federal Rural do Semi-Árido, located 20 km away from the municipal seat of Mossoró (5° 3' 38'’ latitude, -37° 23' 46'’ longitude, and 18 m elevation). According to Gaussen’s bioclimatic classification, the climate in the Mossoró region is type 4ath, or distinctly xerothermic, which means tropical hot with a pronounced, long dry season, lasting from seven to eight months and with a xerothermic index between 150 and 200. The bioclimate in the region is a BSwh, that is, hot, with heavier precipitations delayed toward the fall (Köppen, 1948). The mean maximum temperature in the region is between 32.1 and 34.5°C, with June and July as the coolest months, while the mean annual precipitation is around 825 mm (CARMO FILHO; OLIVEIRA, 1989).
Sabiá (obtained from natural populations in Mossoró-RN) and gliricidia seeds (obtained from Assessoria e Serviços a Projetos em Agricultura Alternativa-AS-PTA, a non-governmental organization with a branch in Campina Grande-PB), were sown in January 2008. The seeds were sown in black plastic bags, 25 cm tall and 15 cm in diameter, perforated in their bottom third. The bags were filled with substrate consisting of 1/3 manure and 2/3 soil. The soil was classified as a Red-Yellow Podzol, according to the Brazilian Soil Classification System (EMBRAPA, 1999) and as a Ferric Lixisol, according to the Soil Map of the World (FAO, 1988).
Transplanting was performed in March 2008, to a soil of the same type previously referred, in a pristine area that was manually deforested. The soil analysis indicated: The seedlings were transplanted to non-fertilized pits measuring 40 cm × 40 cm × 40 cm.
Both species were submitted to the following planting densities (plants ha-1): 400 (row spacing of 5.0 m × 5.0 m), 600 (4.0 m × 4.17 m), 800 (4.0 m × 3.12 m), 1000 (4.0 m × 2.5 m), and 1200 (3.0 m × 2.77 m). A randomized complete block design was adopted with five replicates and split-split plots (species in plots, planting densities in subplots, and plant ages in subsubplots). Each subplot consisted of three 30.0 m-long rows of plants. The
evaluation (usable) area in each subplot was considered as the space occupied by the plants on the central row, with the elimination of one plant at each end. Control of pests and diseases was performed as needed. Weeds were controlled by hoeing with a harrow attached to a tractor, between plant rows and lines, and by manual hoeing in the vicinity of each plant.
Evaluations were conducted every three months after seeding for plant height, root collar diameter (measured at 10 cm above the ground with a digital caliper rule), and crown diameter, in all plants of the usable area of each subplot. When plants were one year of age and beyond, evaluations were conducted also for stem diameter at breast height (1.30 m above the ground). Plant height was considered as the distance from ground level to the top part of the tree. Root collar diameter, stem diameter, and crown diameter were estimated as the means between two perpendicular measurements, one taken along the row of plants anf the other taken perpendicularly to the first.
The data were submitted to analysis of variance using SAEG-software developed by Universidade Federal de Viçosa (RIBEIRO JÚNIOR, 2001), while regression analyses were made with the software developed by Jandel (1992). The regression equations were selected based on the following criteria: biological explanation of the phenomenon, simplicity of the equation, and testing of equation parameters by Student’s t test at 5% probability.
3. RESULTS
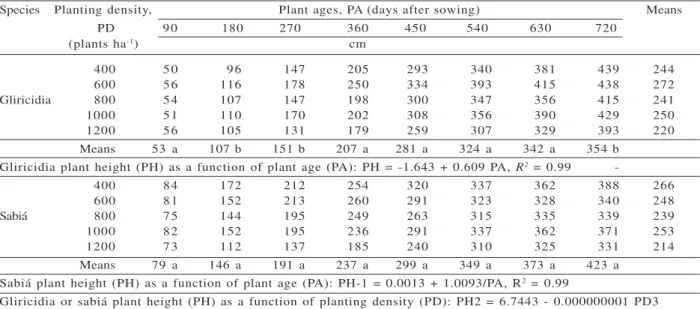
With regard to plant height, there was an effect of plant age and of plant age × species interaction. The species did not differ with regard to plant height in the first measurement (90 days of age), but at subsequent ages sabiá was superior in three out of seven measurements (Table 1). Apparently, gliricidia tends to match sabiá in terms of plant height during rainy periods, but in dry periods sabiá showed higher growth in height. Although the analysis of variance did not indicate a planting density effect, the regression analysis indicated that plant height decreased as planting density increased. Due to the lack of a species × planting densities interaction, a single equation was fitted for both species (Table 1).
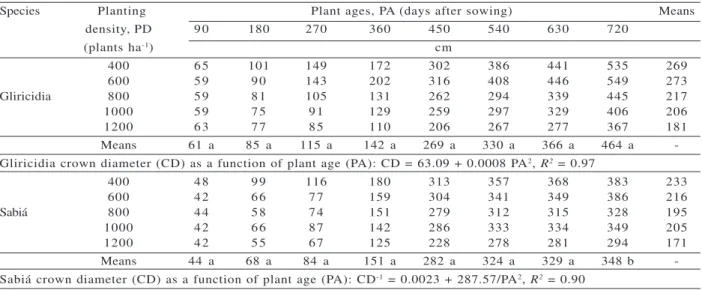
species for crown diameter was only detected in the last measurement, in which sabiá was superior (Table 2). Due to the lack of a species × planting densities interaction, a single equation was fitted for both species; the equation indicated a decrease in crown diameter as planting density increased (Table 2). At all ages, crown diameter in both species decreased as planting density increased; also, at all densities, crown diameter increased as plant age increased (Table 3). However, both decreases and increases had different magnitudes, which resulted in the occurrence of a plant age × planting densities interaction.
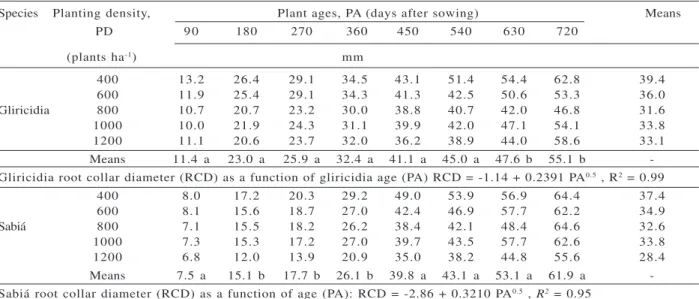
With regard to root collar diameter, the analysis of variance indicated effects of planting density (PD), age (PA), and of the species × PA interaction. At some ages gliricidia had, on average, greater root collar diameter than sabiá, but at other ages the opposite occurred (Table 4). As in the case of plant height, such alternation in superiority between one species and the other for stem diameter could be associated with higher growth of gliricidia during rainy periods and higher growth of sabiá during dry periods. In both species, there were increases and decreases in
root collar diameter as plant age and planting density increased, respectively.
As to stem diameter at breast height, there were effects of species (S), planting density (PD, as indicated by the regression analysis), plant age (PA), and of the S × PA and PD × PA interactions. Gliricidia was superior to sabiá starting on the second measurement (Table 5). Stem diameter increased with age in both species, but at higher magnitude in gliricidia, which resulted in the S × PA interaction (Table 5). In both species, increased planting density equally reduced that trait; for this reason, a single regression equation was fitted for both (Table 5). The increases in stem diameter at breast height as a function of age decreased as planting density increased (Table 5). The decrease in that trait as planting density increased was more intense as age increased (Table 5).
Some authors (LEITE et al., 2006) observed an increase in tree survival percentage as a result of increased planting densities. In our study this was not the case, probably because the plants were very young (only two years old).
1Means followed by the same letter in the columns do not differ from one another at 5% probability by Tukey’s test. All equation parameters are significant at 5% probability by Student’s t test.
1 Médias seguidas pela mesma letra nas colunas não diferem entre si, a 5% de probabilidade, pelo teste de Tukey. Todos os parâmetros
das equações são significativos a 5% de probabilidade, pelo teste t de Student.
Table 1 – Plant height means (PH) for leguminous tree species as a function of plant age (PA) and planting density (PD)1. Tabela 1 – Médias da altura da planta (y) de espécies leguminosas arbóreas em função da idade da planta e da densidade
de plantio1.
Species Planting density, Plant ages, PA (days after sowing) Means
PD 9 0 180 270 360 450 540 630 720
(plants ha-1) cm
400 5 0 9 6 147 205 293 340 381 439 244
600 5 6 116 178 250 334 393 415 438 272
Gliricidia 800 5 4 107 147 198 300 347 356 415 241
1000 5 1 110 170 202 308 356 390 429 250
1200 5 6 105 131 179 259 307 329 393 220
Means 53 a 107 b 151 b 207 a 281 a 324 a 342 a 354 b Gliricidia plant height (PH) as a function of plant age (PA): PH = -1.643 + 0.609 PA, R2 = 0.99
-400 8 4 172 212 254 320 337 362 388 266
600 8 1 152 213 260 291 323 328 340 248
Sabiá 800 7 5 144 195 249 263 315 335 339 239
1000 8 2 152 195 236 291 337 362 371 253
1200 7 3 112 137 185 240 310 325 331 214
Means 79 a 146 a 191 a 237 a 299 a 349 a 373 a 423 a Sabiá plant height (PH) as a function of plant age (PA): PH-1 = 0.0013 + 1.0093/PA, R2 = 0.99
1All equation parameters are significant at 5% probability by Student’s t test.
1Todos os parâmetros das equações são significativos a 5% de probabilidade, pelo teste t, de Student.
Table 3 – Crown diameter means (CD) for two leguminous tree species as a function of plant age (PA) and planting density (PD)1.
Tabela 3 – Médias do diâmetro da copa de espécies arbóreas leguminosas em função da idade da planta e da densidade de plantio1.
Planting density, Plant ages, PA (days after sowing) Crown diameter (CD), in each density, PD (plants ha-1) 90 180 270 360 450 540 630 720 as a function of plant age (PA)
cm
400 5 6 100 133 176 308 371 403 459 CD-1 = 0.0018 + 274.63/PA2, R2= 0.94
600 5 1 7 8 110 164 310 375 397 468 CD-1 = 0.0015 + 323.31/PA2, R2= 0.94
800 5 2 7 0 9 0 141 271 303 327 395 CD-1 = 0.0022 + 288.89/PA2, R2= 0.88
1000 5 1 7 0 8 9 136 273 315 331 377 CD-1 = 0.0022 + 274.79/PA2, R2= 0.87
1200 5 3 6 6 7 6 117 217 273 279 331 CD0.5 = 5.25 + 0.019 PA, R2= 0.95
Crown diameter, in each age, as a function of planting density (PD) Age (days after sowing) Equation, R2
9 0 CD2 = 2580.48 + 74921900/PD2, R2= 0.59
180 CD = 62.02 + 6014250/PD2, R2 = 0.99
270 CD2 = 5022.35 + 2129950000/PD2, R2 = 0.96
360 CD = 205.20 - 0.073 PD, R2 = 0.97
450 CD2 = 96673.51 - 0.000028 PD3, R2 = 0.92
540 CD2 = 142513.55 - 0.0486 PD2, R2 = 0.81
630 CD = 417.03 - 0.000097 PD2, R2 = 0.90
720 CD = 483.92 - 0.00011 PD2, R2 = 0.93
Table 2 – Crown diameter means (CD) for leguminous tree species as a function of plant age (PA) and planting density (PD)1. Tabela 2 – Médias do diâmetro da copa (y) de espécies leguminosas arbóreas em função da idade da planta e da densidade
de plantio1.
1Means followed by the same letter in the columns do not differ from one another at 5% probability by Tukey's test. All equation parameters are significant at 5% probability by Student's t test.
1 Médias seguidas pela mesma letra, nas colunas, não diferem entre si, a 5% de probabilidade, pelo teste de Tukey. Todos os parâmetros das equações são significativos a 5% de probabilidade pelo teste t, de Student.
Species Planting Plant ages, PA (days after sowing) Means
density, PD 9 0 180 270 360 450 540 630 720
(plants ha-1) cm
400 6 5 101 149 172 302 386 441 535 269
600 5 9 9 0 143 202 316 408 446 549 273
Gliricidia 800 5 9 8 1 105 131 262 294 339 445 217
1000 5 9 7 5 9 1 129 259 297 329 406 206
1200 6 3 7 7 8 5 110 206 267 277 367 181
Means 61 a 85 a 115 a 142 a 269 a 330 a 366 a 464 a -Gliricidia crown diameter (CD) as a function of plant age (PA): CD = 63.09 + 0.0008 PA2, R2 = 0.97
400 4 8 9 9 116 180 313 357 368 383 233
600 4 2 6 6 7 7 159 304 341 349 386 216
Sabiá 800 4 4 5 8 7 4 151 279 312 315 328 195
1000 4 2 6 6 8 7 142 286 333 334 349 205
1200 4 2 5 5 6 7 125 228 278 281 294 171
Means 44 a 68 a 84 a 151 a 282 a 324 a 329 a 348 b -Sabiá crown diameter (CD) as a function of plant age (PA): CD-1 = 0.0023 + 287.57/PA2, R2 = 0.90
Gliricidia or sabiá crown diameter (CD) as a function of planting density (PD): CD2 = 7.9751 - 0.0040 PD, R2 = 0.93
Table 4 – Root collar diameter (RCD) means for leguminous tree species as a function of plant age (PA) and planting density (PD)1. Tabela 4 – Médias do diâmetro do colo de espécies leguminosas arbóreas em função da idade da planta e da densidade de plantio1.
1Means followed by the same letter in the columns do not differ from one another at 5% probability by Tukey’s test. All equation parameters are significant at 5% probability by Student’s t test.
1 Médias seguidas pela mesma letra nas colunas não diferem entre si, a 5% de probabilidade, pelo teste de Tukey. Todos os parâmetros das equações são significativos a 5% de probabilidade, pelo teste t, de Student.
4. DISCUSSION
Similarly to this study, some authors (LEITE et al., 2006; RONDON, 2002) observed a reduction in plant height as planting density increased (Table 1). In other studies, however (HUMMEL, 2000; MAKINEN; HEIN, 2006; RONDON, 2006) no effect of planting density was observed on tree height. Such discrepancies are due to differences in the species evaluated and in environmental conditions, including the planting densities tested.
At all ages, crown diameter in both species decreased as planting density increased (Table 2); also, at all densities, crown diameter increased as plant age increased (Table 3). Tree crown width is an important measure for several key factors in stand management (PRETZSCH et al., 2002). On an individual tree basis, it helps to describe competition between trees and by being related to branch thickness (CONDÉS; STERBA, 2005); it also indirectly affects timber quality, and thus the economic value of a tree. On a stand basis, it serves to evaluate crown closure, which is on the one hand a general competition measure, and on the other an important measure of habitat quality (CONDÉS; STERBA, 2005)
Like in the present work, reductions in stem diameter (Table 4) and crown diameter (Table 5) were also observed in other studies (HUMMEL, 2000; MAKINEN; HEIN, 2006; RONDON, 2006). Forest trees usually exhibit a significant relationship between their crown diameters and stem diameters (HEMERY et al., 2005). The possible applications and uses of a knowledge of this relationship include decisions on spacings, estimates of branchwood and fwelwood and uses in arboriculture (HEMERY et al., 2005). For example, It is possible to calculate the space occupied by the crown of each tree at any mean diameter, and assuming that no overlap occurs, the number of trees per hectare. The increase in interest in sustainable sources of energy has increased the interest in using “residues”, essentially the crownwood of hardwood stands. Crown diameter and crown length would be obvious predictor variables for branchwood volumes. The ability to predict crown diameters would assist in decisions on spacing when planning the spacing of single tree and tree avenues (HEMERY et al., 2005).
Increased planting density decreased the four traits used to evaluate growth in both species (Tables 1 to 5). The influence of plant age was positive for the four
Species Planting density, Plant ages, PA (days after sowing) Means
PD 9 0 180 270 360 450 540 630 720
(plants ha-1) mm
400 13.2 26.4 29.1 34.5 43.1 51.4 54.4 62.8 39.4 600 11.9 25.4 29.1 34.3 41.3 42.5 50.6 53.3 36.0 Gliricidia 800 10.7 20.7 23.2 30.0 38.8 40.7 42.0 46.8 31.6 1000 10.0 21.9 24.3 31.1 39.9 42.0 47.1 54.1 33.8 1200 11.1 20.6 23.7 32.0 36.2 38.9 44.0 58.6 33.1 Means 11.4 a 23.0 a 25.9 a 32.4 a 41.1 a 45.0 a 47.6 b 55.1 b -Gliricidia root collar diameter (RCD) as a function of gliricidia age (PA) RCD = -1.14 + 0.2391 PA0.5 , R2 = 0.99
400 8.0 17.2 20.3 29.2 49.0 53.9 56.9 64.4 37.4 600 8.1 15.6 18.7 27.0 42.4 46.9 57.7 62.2 34.9
Sabiá 800 7.1 15.5 18.2 26.2 38.4 42.1 48.4 64.6 32.6
1000 7.3 15.3 17.2 27.0 39.7 43.5 57.7 62.6 33.8 1200 6.8 12.0 13.9 20.9 35.0 38.2 44.8 55.6 28.4 Means 7.5 a 15.1 b 17.7 b 26.1 b 39.8 a 43.1 a 53.1 a 61.9 a -Sabiá root collar diameter (RCD) as a function of age (PA): RCD = -2.86 + 0.3210 PA0.5 , R2 = 0.95
Gliricidia or sabiá root collar diameter (RCD) as a function of planting density (PD): RCD2 = 7.400 + 2948.86/PD, R2 = 0.87
traits evaluated, corroborating the information obtained by other authors (HUMMEL, 2000; LEITE et al., 2006). Increased planting densities increase the competition between plants for water, light, and nutrients, which may result in smaller growth. Below the soil surface, plants influence the availability of water and nutrients to neighboring plants or inhibit the access of roots from other plants to the resources, via allelopathy (SCHENK, 2006). For example, tree roots in some way
reduced growth and vigor of most grasses even when water and nutrients were maintained at optimum levels. In addition to direct competition, biochemical inhibition (allelopathy) may be involved (WHITCOMB, 1972). Water deficit, caused by competition between roots, would induce stomatal closure, reducing photosynthesis (SILVA et al., 2004), consequently reducing growth in plant species. Above ground, competition between plants is for light. Another way by which plants interfere
Species Planting density, Plant ages, PA(days after sowing) Means PD (plants ha-1) 360 450 540 630 720
400 13.6 23.2 25.7 26.4 31.1 40.0
600 19.1 28.7 30.4 31.1 33.3 47.6
Gliricidia 800 16.3 22.8 24.4 24.7 25.5 37.9
1000 15.5 25.5 26.8 27.2 34.5 41.2
1200 13.0 21.0 23.5 24.1 25.2 35.6
Means 15.5 a 24.2 a 26.1 a 26.7 a 28.7 a
-Gliricidia breast-height stem diameter (BHD) as a function of plant age (PA): BHD2 = 10.12 - 984312.03/PA2 , R2 = 0.97
400 17.2 26.0 284 28.4 29.0 43.0
600 15.2 20.9 22.6 22.8 24.3 35.3
Sabiá 800 12.9 17.0 18.2 18.9 20.2 29.1
1000 13.1 21.3 22.7 23.0 23.5 34.5
1200 12.3 18.0 19.8 19.8 20.4 30.1
Means 14.1 a 20.6 b 22.3 b 22.6 b 23.5 b
-Sabiá breast-height stem diameter (BHD) as a function of plant age (PA): BHD2 = 6.92 - 624330.41/PA2 , R2 = 0.97
Gliricidia or sabiá breast-height stem diameter (BHD) as a function of planting density (PD): BHD2 = 721.82 - 0.28PD, R2 = 0.63
Planting density, Plant ages, PA (days after sowing) Breast-height stem diameter (BHD), in PD (plants ha-1) 360 450 540 630 720 each density, as a function of age (A) 400 15.4 24.6 27.1 27.4 30.1 BHD2 = 10.9 - 1096700.0/ PA, R2 = 0.98
600 17.2 24.8 26.5 27.0 28.8 BHD2 = 10.0 - 895780.3/ PA, R2 = 0.97
800 14.6 19.9 21.3 21.8 22.9 BHD2 = 6.3 - 529174.3/ PA, R2 = 0.98
1000 14.3 23.4 24.7 25.1 26.0 BHD2 = 8.8 - 850031.7/ PA, R2 = 0.94
1200 12.7 19.5 21.6 22.0 22.8 BHD2 = 6.6 - 641274.9/ PA, R2 = 0.98
Breast-height stem diameter (BHD), in each age, as a function of planting density (PD) Plant ages, PA (days after sowing) Equations, R2
360 BHD2 = 2.61 - 0.0000000005 PD3, R2 = 0.74
450 BHD2 = 6.41 - 0.00006 PD1.5, R2 = 0.50
540 BHD2 = 3.54 + 1586.7/ PD, R2 = 0.59
630 BHD2 = 3.74 + 1582.5/ PD, R2 = 0.58
720 BHD2 = 3.47 + 2292.0/ PD, R2 = 0.71
Experimental coefficient of variation (CV) for species = 19.1%; CV for densities = 4.0%; CV for ages = 6.2%
Table 5 – Breast-height stem diameter (BHD) means (mm) for leguminous tree species as a function of plant age (PA) and planting density (PD)1.
Tabela 5 – Diâmetro do caule, à altura do peito, de espécies leguminosas arbóreas em função da idade da planta e da densidade de plantio1.
1Means followed by the same letter in the columns do not differ from one another at 5% probability by Tukey’s test. All equation parameters are significant at 5% probability by Student’s t test.
with the growth of neighboring plants would be via emission of biogenic volatile organic compounds. These compounds may act both as allelochemicals and as signals for detection of neighboring plants (KEGGE; PIERIK, 2009).
5. CONCLUSIONS
The four traits (plant heigh, ph, crow diameter, CD, root collar diameter, RCD, and diameter at breast height, DBH) in both species (Mimosa caesalpiinifolia and Gliricidia sepium)had their values decreased as planting density increased, but continually increased as plant age increased. For plant height and root collar diameter there was an alternation between species superiority, with gliricidia being superior to sabiá at some ages, while the opposite occurred at other ages. As to crown diameter the species only differed in the last measurement, gliricidia being superior. With regard to stem diameter, gliricidia was superior starting from the second measurement. There was an effect of the species × plant ages interaction for the four traits and also an effect of the planting densities × plant ages interaction for crown diameter and stem diameter.
6. REFERENCES
CALDER, I.R. Forests and water – ensuring forest benefits outweigh water costs. Forest Ecology and Management, v.251, n.1-2, p.110-120, 2007.
CARMO FILHO, F. do and OLIVEIRA, O. F.
Mossoró: um município do semi-árido nordestino.
Mossoró, Fundação Guimarães Duque/ESAM, 1989. 62 p. (Coleção Mossoroense, Série B, 672).
CARMO FILHO, F. do and OLIVEIRA, O. F.
Mossoró: um município do semi-árido nordestino. Mossoró, Fundação Guimarães Duque/ESAM, 1989. 62 p. (Coleção Mossoroense, Série B, 672).
CONDÉS, S.; STERBA, H. Derivation of compatible crown width equations for some important tree species of Spain. Forest Ecology and Management, v.217, n.1, p.203-218, 2005.
EMBRAPA. Centro Nacional de Pesquisa do Solo.
Sistema brasileiro de classificação de solos. Brasília: Serviço de Produção de
Informação, 1999. 412p.
FAO. Soil map of the world; revised legend. Rome: UNESCO, 1988. 119p.
FAO. State of the world’s forests. Rome, 2011. 179p.
HEMERY, G.E.; SAVILL, P.S.; PRYOR, S.N.
Applications of the crown diameter-stem diameter relationship for different species of broadleaved trees. Forest Ecology and Management, v.215, n.1, p.285-294, 2005.
HUMMEL, S. Height, diameter and crown dimensions of Cordia alliodora associated with tree density. Forest Ecology and
management, v.127, n.1, p.31-40, 2000.
INSTITUTO BRASILEIRO DE GEOGRAFIA E ESTATÍSTICA (IBGE). Mapas de biomas do Brasil, primeira aproximação. Rio de janeiro, 2004.
INSTITUTO BRASILEIRO DE GEOGRAFIA E ESTATÍSTICA (IBGE). Contagem da população. Rio de janeiro, 2007.
JANDEL. Jandel TBLCURVE. Table Curve 3.0. Curve fitting software. Corte Madera, Jandel Scientific, 1992. 280p.
JIANG, Z.; WANG, X.; FEI, B.; REN, H.; LIU, X. Effect of stand and tree attributes on growth and wood quality characteristics from a spacing trial with Populus xiaohei. Annals of Forest
Sciences, v.64, n.8, p.807-814, 2007.
KEGGE, W.; PIERIK, R. Biogenic volatile organic compounds and plant competition. Trends in Plant Science, v. 15, n. 3, p. 126-132, 2009.
KIILL, L.H.P.; MENEZES, E.A. (Eds.). Espécies vegetais exóticas com potencialidades para o Semi-Árido brasileiro. Brasília: Embrapa Informação Tecnológica, 2005. 340 p.
KÖEPPEN, W. Climatologia; con un estudio de los climas de la tierra. México : Fondo de CulturaEconomica, 1948. 478 p.
LEITE, H.G.; NOGUEIRA, G.S.; MOREIRA, A.M. Efeito do espaçamento e da idade sobre variáveis de povoamentos de Pinus taeda L. Revista
LELES, P.S.S.; REIS, G.G.; REIS, M.G.F.; MORAIS, E.J. Crescimento, produção e alocação de matéria seca de Eucalyptus camaldulensis e E. pellita sob diferentes espaçamentos na região de cerrado, MG.
Scientia Forestalis, n.59, p.77-87, 2001.
MAIA, G.N. Caatinga; árvor es e arbustos e suas utilidades . São Paulo: D & Z Computação Gráfica e Editora, 2004. 413p.
MAKINEN, H.; HEIN, S. Effect of wide spacing on increment and branch properties of young Norway spruce. European Journal of Forest Research, v.125, n.3, p.239-248, 2006.
MAN, V.N.; HAO, N.V. Effect of plant spacing on the growth and yield of four legume trees in the grey soil of Eastern South Vietnam. Livestock Research for Rural Development, v.5, n.1, p.16-24, 1993.
MIRANDA, E.M.; VALENTIM, J.F. Dsempenho de doze espécies arbóreas nativas e introduzidas com potencial de uso múltiplo no Estado do Acre, Brazil.
Acta Amazônica, v.30, n.3, p.471-480, 2000.
MIRANDA, M.J.A.C.; NAHUZ, M.A.R. Estudo da influência do espaçamento de plantio de
Eucalyptus saligna Smith nos índices de rachamento após o desdobro e após a secagem.
Scientia Forestalis, n.55, p.107-116, 1999.
PRETZSCH, H.; BIBER, P.; DURSKÝ, J. The single tree-based stand Simulator SILVA: construction, application and evaluation. Forest Ecology and Management , v.162, n.1, p.203-218, 2002.
RIBEIRO JÚNIOR, J.I. Análises estatísticas no SAEG. Viçosa, Universidade Federal de Viçosa, 2001. 301p.
RONDON, E.V. Estudo de biomassa de Tectona grandis L.f. sob diferentes espaçamentos no estado de São Paulo. Revista Árvore, v.30, n.3, p.337-341, 2006.
RONDON, E.V. Produção de biomassa e crescimento de árvores de Schizolobium amazonicum (Huber) Ducke sob diferentes espaçamentos na região de mata. Revista Árvore, v.26, n.5, p.573-576, 2002.
SANTOS, C.A.F.; OLIVEIRA, V.R.; KIILL, L.H.P.; SÁ, I.I.S. Variabilidade genética, com base em marcadores RAPD, de três espécies arbóreas ameaçadas de extinção no semi-á r i d o b r a s i l e i r o . S c i e n t i a F o r e s t a l i s, n.74, p.37-44, 2007.
SCHENK, H. J. Root competition: beyond resource depletion. Journal of Ecology, v. 94, n. 4, p. 725-739, 2006.
SILVA, A.A. da; VARGAS, L.; WERLANG, R.C. Manejo de plantas daninhas na cultura do milho. In: GALVÃO, J.C.C.; MIRANDA, G. V. Te c n o l o g i a s d e p ro d u ç ã o d o
milho. Viçosa, UFV, 2004. 366p. cap.8, p.269-310.
SIMÕES, J.W.; BRANDI, R.M.; MALINOVSKY, J.R. Formação de florestas com
espécies de rápido crescimento. Brasília: IBDF/PNUD/FAO, 1976. 74p. (Série divulgação PNUD/FAO/IBDF/BRA-45, 6).