1 Recebido para publicação em 14.5.2012 e aprovado em 18.10.2012.
2 Student in the Plant Science Graduate Program, Universidade Federal Rural do Semiárido – UFERSA, <aline_danny@yahoo.com.br>; 3 Professor, Universidade Federal Rural do Semiárido – UFERSA, Caixa Postal 137, 59600-970 Mossoró-RN, CNPq fellow; <paulosergio@ufersa.edu.br>; 4 Professor, UFERSA, <odaci@uol.com.br>; 5 Professor, Universidade do Estado do Rio Grande do Norte – UERN, <irondantas@uern.br>; 6 Professor, UFERSA, <plmorais@hotmail.com>.
W
EEDSU
NDER THEC
ANOPIES OFT
REES
PECIESS
UBMITTED TOD
IFFERENTP
LANTINGD
ENSITIES ANDI
NTERCROPPING1Plantas Daninhas sob Copas de Espécies Arbóreas Submetidas a Consórcios e Densidades de
Plantio Diferentes
SOUZA, A.D.2, SILVA, P.S.L.3, OLIVEIRA, O.F.4, DANTAS, I.M.5, and MORAIS, P.L.D.6
ABSTRACT - Assessing the growth and floristic composition of species that grow under the canopy of trees is important for weed control (WC). The objective of this study was to assess two experiments (E1 and E2), when the trees were two years and one year of age, respectively. In E1, sabiá (S) and gliricidia (G) were submitted to planting densities from 400 to 1.200 plants ha-1. In E2, growing systems consisting of S, G, and neem (N) combinations were compared: SSS, GGG, NNN, GSG, NSN, SGS, NGN, SNS, and GNG (each letter represents a row of plants). A random block design was adopted, with three (E1) and four (E2) replicates. In E1, treatments were arranged as split-plots (species in plots). In E2, the degrees of freedom for treatments (8) were partitioned into growing systems (treatments that involved the same species) and between growing system groups (2). Twenty-one weed species were found in E1. Gliricidia attained greater plant height than sabiá, but these species did not differ in canopy diameter, number of weed species per plot, and weed green and dry biomass of the shoot. Higher planting densities resulted in the reduction of all those traits. Twenty-six weed species were found in E2. Growing systems that included gliricidia showed canopies with greater diameters than growing systems that included neem. There were no differences between growing systems for number of weed species per plot and for weed green and dry biomass of the shoot.
Keywords: Mimosa caesalpiinifolia, Gliricidia sepium, Azadirachta indica, growth, floristic composition, understory.
RESUMO - Avaliações do crescimento e da composição florística de espécies que vegetam sob a copa das árvores são importantes no controle de plantas daninhas (PD). O objetivo deste trabalho foi realizar essas avaliações em dois experimentos (E1 e E2), quando as árvores tinham idades de dois anos e um ano, respectivamente. Em E1, sabiá (S) e gliricídia (G) foram submetidas a densidades de plantio de 400 a 1.200 plantas ha-1. Em E2, foram comparados sistemas de cultivo de S, G e nim
(N): SSS, GGG, NNN, GSG, NSN, SGS, NGN, SNS e GNG (cada letra representa uma fileira de plantas). Utilizou-se o delineamento de blocos ao acaso com três (E1) e quatro repetições (E2). Os tratamentos foram dispostos em parcelas subdivididas em E1 (espécies nas parcelas). No E2, os graus de liberdade de tratamentos (8) foram desdobrados em sistemas de cultivo (tratamentos que envolveram uma mesma espécie) e entre grupos de sistemas de cultivo (2). No E1 ocorreram 21 espécies de PD. A gliricídia apresentou maior altura da planta do que a sabiá, porém as duas espécies não diferiram quanto a diâmetro da copa, número de espécies de PD por parcela e biomassas fresca e seca da parte aérea das PD. O aumento da densidade de plantio reduziu todas essas características. No E2 ocorreram 26 espécies de PD. Os sistemas de cultivo que incluíram a gliricídia apresentaram copas com maior diâmetro que aqueles em que a nim foi incluída. Não houve diferenças entre sistemas de cultivo quanto a número de espécies de PD por parcela e biomassas fresca e seca da parte aérea das PD.
INTRODUCTION
The assemblage of young plants, shrubs, and herbaceous vegetation found below the canopy of trees is referred to as understory
(or understorey) (Leopold & Salazar, 2008). In Brazil, some authors (Saporetti Jr. et al., 2003) use the Portuguese term sub-bosque to refer to understory; in this paper, understory will refer to both the English and Portuguese terms. Understory species interfere with the performance of tree crops and are thus considered to be weeds. Weed effects on the behavior of trees have been observed by some authors (Cantarelli et al., 2006). However, tree crops may also influence the understory (Silva et al., 2010a). There are three other aspects under which the tree-understory species relationship has been studied; these aspects provide information that is useful for weed control: silvopastoral systems, allelopathy, and natural ecosystems.
In all agroforestry systems there are understories that may function as weeds. However, in silvopastoral systems (trees + animals) it would not be proper to refer to understory species as weeds. They may provide food for the herd, although some understory species are considered weeds (such as species that are noxious to the cattle). Understory yield and quality in silvopastoral systems can be influenced by trees (Rozados-Lorenzo et al., 2007) and vice versa (Benavides et al., 2009).
Another aspect that justifies studying plant species that are found under the canopy of tree species regards allelopathy. Evidence of allelopathy can be found by observing spatial patterns in the field. In some cases, growth inhibition zones can be found below or around the canopy of an allelopathic plant, where neighboring plants are suppressed (Inderjit & Callaway, 2003). Therefore, the study of plants found under the tree canopy may help identify potentially useful species from an allelopathic point of view that may help controlling weeds. In agroecosystems, allelochemicals are viewed as alternatives to synthetic agrochemicals with the objective of achieving sustainable and ecological management in agricultural production (Maraschin-Silva & Aqüila, 2006).
Understory traits are also a source of interest from an ecological stand point. For
example, Larpkern et al. (2010) verified that certain understory species became predominant after degrading human actions. These species make degraded area recovery more difficult when they are not appropriately managed. Under natural conditions, allelo-pathy influences plant primary and secondary successions, and the structure, composition, and dynamics of plant communities (Scrivanti et al., 2003).
In general, cultural practices influence tree growth. Planting density influences several tree species traits, including growth (Rondon, 2006). Intercropping may also influence tree growth (Forrester et al., 2006; Kelty, 2006; Balbinot et al., 2010). If cultural practices influence tree behavior, those practices may also indirectly influence the behavior of understory species.
Sabiá (Mimosa caesalpiinifolia), gliricidia (Gliricidia sepium), and neem (Azadirachta indica) are tree species well adapted to the semi-arid region of Brazil and can be exploited for several purposes (Neves, 2004; Kill & Menezes, 2005). In order to exploit them economically and, in some cases, to allow their use in degraded area recovery, the most suitable cultural practices -including planting density and intercropping– must be understood.
The objectives of this study were to assess: a) tree species growth in response to planting densities and intercropping; b) growth and floristic composition of weeds found under the canopy of those tree species.
MATERIAL AND METHODS
According to Gaussen’s bioclimatic classification, the climate in the Mossoró region is type 4ath, or distinctly xerothermic, which means tropical hot with a pronounced, long dry season, lasting from seven to eight months and with a xerothermic index between 150 and 200. The bioclimate in the region is BSwh, that is, hot, with heavier precipitations delayed toward the fall (Köppen, 1948). The mean maximum temperature in the region is between 32.1 and 34.5 oC, with June and July being the coolest months, while the mean annual precipitation is around 825 mm (Carmo Filho & Oliveira, 1989). The soil at both experiment locations has been classified as Red-Yellow Argisol according to the Brazilian soil classification system (Embrapa, 2006).
In both experiments, seeds were sown in black plastic bags, 0.25 cm tall and 0.15 cm in diameter, perforated in their bottom third. The bags were filled with substrate consisting of 1/3 manure and 2/3 soil. The analysis of a soil sample from the experiment area indicated: pH = 6.8; Ca = 1.80 cmolc
-1dm-3;
Mg = 0.40 cmolc dm
-3; K = 0.10 cmol c dm
-3;
Na = 0.01 cmolc dm
-3; Al = 0.00 cmol c dm
-3;
P = 25 mg dm-3; Org. Matter = 1.90 g kg-1. The manure analysis indicated: pH (water) = 8.1; Ca = 4.0 cmolc dm
-3; Mg = 5.5 cmol c dm
-3;
K = 1.72 cmolc dm
-3; Na = 1.84 cmol c dm
-3;
Al = 0.00 cmolc dm
-3; P = 76.7 mg dm-3.
Three months after the seeding, seedlings were transplanted to pits measuring 0.40 m x 0.40 m x 0.40 m, in an area with the same soil described above. There was no fertilization. Data on tree species for plant height (distance from the ground to the highest part of the tree) and canopy diameter were recorded, for all plants in the usable area of the experimental unit. Canopy diameter was estimated as the means between two perpendicular measurements, one taken along the row of plants and the other taken perpendicularly to the first. Weeds were evaluated under the canopy of two trees from the usable area of each experimental unit. A circle with a 0.75 m radius was established around each tree, and we tried to locate the tree stem in the central position of the circle. Evaluations were made for fresh and dry weed biomass and index of occurrence. The weeds present in each circle were collected, clipped from ground surface,
identified and weighed. A sample from the collected material, weighing approximately 200 g, was placed in a forced air circulation oven adjusted at 75 oC until constant weight was achieved. The occurrence index was defined as the ratio between the number of plots where each weed species occurred and the total number of plots in the experiment (Silva et al., 2009). Even though growth is measured in terms of dry matter, we chose to present data for fresh biomass as well. We did this for two reasons: weed distribution in general was not uniform between plots in the same block. In addition, remarkable differences occurred between green and dry biomass in a given treatment.
The data were submitted to analysis of variance using the ESTAT statistical analysis system developed by UNESP (Universidade Estadual de São Paulo), and treatment means were compared by Tukey’s test at 5% probability. Regression and correlation analyses were performed using the software created by Jandel (1992). The regression equations were selected based on biological explanation of the phenomenon, simplicity of the equation, and testing of equation parameters by Student’s t test at 5% probability.
Planting density experiment
Sabiá and gliricidia were submitted to the planting densities (plants ha-1) of: 400 (row spacing of 5.0 m x 5.0 m), 600 (4.0 m x 4.17 m), 800 (4.0 m x 3.12 m), 1000 (4.0 m x 2.5 m), and 1.200 (3.0 m x 2.77 m). A randomized complete block experimental design in split-plots with three replicates was adopted (species in plots). Each subplot consisted of three 30.0 m-long rows of plants. The usable area was considered to be that occupied by the central row, and the plant at each end of the row was eliminated.
Intercropping experiment
of sabiá or gliricidia. A randomized block design was used with four replicates; the usable area was that occupied by the central row, with the elimination of one pit at each end. In the analysis of variance, the eight degrees of freedom for treatments were partitioned as follows: two degrees for each planting system group of each species (for example, in neem: neem – neem – neem, sabiá – neem – sabiá, gliricidia – neem – gliricidia) and two degrees for the comparison of groups of each species.
RESULTS AND DISCUSSION
Planting densities
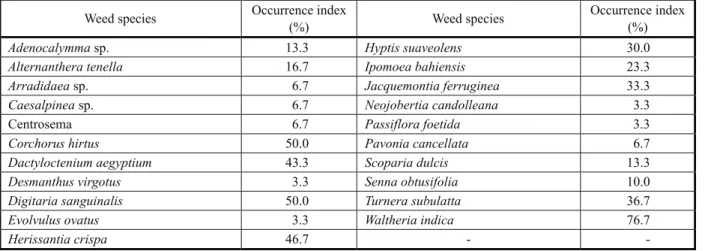
Twenty-one weed species occurred in the plots of the experiment that assessed tree species growth as a function of planting densities, with Waltheria indica as the most frequent species (Table 1). A smaller number of species was found as compared with similar studies (Sit et al., 2007; Silva et al., 2010a) but the number of more frequently occurring conformed to these studies.
Gliricidia showed a higher plant height (4.23 m) than sabiá (3.54 m; CV = 6.5%), but the two species did not differ with regard to canopy diameter (4.60 m and 3.48 m, respectively; CV = 17.9%), number of weed species per plot (5.2 and 4.5, respectively), weed fresh biomass of the above-ground part (268.9 g m-2
and 252.4 g m-2
, respectively; CV = 38.5%) and weed
dry biomass of the above-ground part (131.7 g m -2 and 112.3 g m-2, respectively; CV = 42.3%).
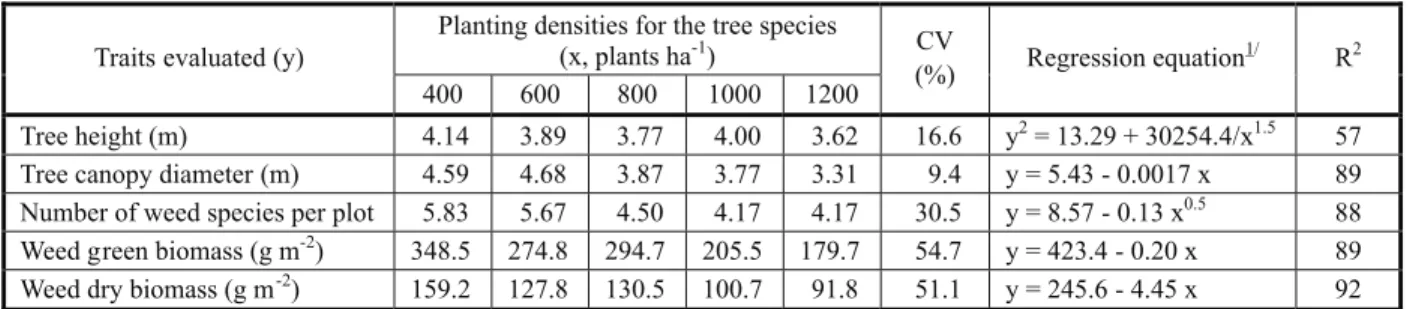
Increased planting densities reduced plant height and canopy diameter in the tree species evaluated, and also reduced the number of weed species per plot and weed fresh and dry biomass of the shoot under the canopy of those trees (Table 3). Rondon (2002) also observed reduced plant height as planting density of tree species increased. However, planting density had no effect on tree height (Makinen & Hein, 2006; Rondon, 2006). Such discrepancies are due to differences in the species assessed and in environmental conditions, including the planting densities tested. Reductions in canopy diameter in present studies have also been observed in other studies (Makinen & Hein, 2006; Rondon, 2006).
As planting density increases, competition for water, nutrients, light, and space increases, while tree and weed growth under the tree canopy decreases. Above the soil surface, there is competition for light and space. Denser plant stands caused by higher planting densities would result in mutual shading, with reduced photosynthesis rates, which would in turn result in smaller plant growth. In addition to competition for light, there is evidence that, in the presence of neighboring plants, modifications occur in the emission of biogenic, volatile organic compounds (produced by plants). These compounds may act both as allelochemicals and as signals for the
Table 1 -Occurrence index (ratio between the number of plots where a given weed species occurred and the total number of
experimental plots) of weed species under the canopies of two tree species at two years of age, submitted to different planting densities
Weed species Occurrence index
(%) Weed species
Occurrence index (%)
Adenocalymmasp. 13.3 Hyptis suaveolens 30.0
Alternanthera tenella 16.7 Ipomoea bahiensis 23.3
Arradidaeasp. 6.7 Jacquemontia ferruginea 33.3
Caesalpineasp. 6.7 Neojobertia candolleana 3.3
Centrosema 6.7 Passiflora foetida 3.3
Corchorus hirtus 50.0 Pavonia cancellata 6.7
Dactyloctenium aegyptium 43.3 Scoparia dulcis 13.3
Desmanthus virgotus 3.3 Senna obtusifolia 10.0
Digitaria sanguinalis 50.0 Turnera subulatta 36.7
Evolvulus ovatus 3.3 Waltheria indica 76.7
-detection of neighboring plants (Kegge & Pierik, 2009).
Below the soil surface, there is competition for water, nutrients, and space. In addition to the signals emitted by plants above the soil surface, detection of neighboring plants also involves several signals below the ground, such as water and/or nutrient depletions, as a consequence of effective absorption by neighboring root systems (Schenk, 2006) and organic exudates excreted by neighboring plants (Bais et al., 2006). Competition of roots may affect the availability of a given resource for plants, either by depletion of that resource or by mechanisms that inhibit the access of other roots to the resource (by allelopathy) (Schenk, 2006).
There must be interactions between the plant shoots and root system in the competition between plants for light, water, nutrients, and space. These interactions would influence the growth of different plant organs in a very particular manner. In the competition for light, stem growth in height
demands resources that would be used to form roots and leaves (Henry & Aarssen, 1997). On the other hand, water deficiency caused by competition of roots would encourage the closure of stomata, resulting in reduced photosynthesis (Silva et al., 2004), thus reducing the growth of roots, stems, and leaves.
A decreased number of weed species per plot as a consequence of increasing planting density (Table 3) would be due to interactions among tree species and weeds, but also due to changes in microclimate and in soil properties as modified by trees (Benavides et al., 2009).
Increased seeding densities in annual crops frequently reduce weed growth, as it has been noted for corn (Silva et al., 2010b). Little has been reported on the relationship between planting density and weed growth for perennial plants grown as monocrops. However, in experiments where pastures were intercropped with trees it was observed that increased tree densities in the pastures reduced vegetation growth under the canopy of those trees
Table 2 - Traits of two tree species assessed at two years of age, submitted to planting densities, and traits of weeds found under the canopies of those trees, coefficient of experimental variation and regression equations
Planting densities for the tree species (x, plants ha-1)
Traits evaluated (y)
400 600 800 1000 1200
CV
(%) Regression equation
1/ R2
Tree height (m) 4.14 3.89 3.77 4.00 3.62 16.6 y2= 13.29 + 30254.4/x1.5 57
Tree canopy diameter (m) 4.59 4.68 3.87 3.77 3.31 9.4 y = 5.43 - 0.0017 x 89
Number of weed species per plot 5.83 5.67 4.50 4.17 4.17 30.5 y = 8.57 - 0.13 x0.5 88
Weed green biomass (g m-2) 348.5 274.8 294.7 205.5 179.7 54.7 y = 423.4 - 0.20 x 89
Weed dry biomass (g m-2) 159.2 127.8 130.5 100.7 91.8 51.1 y = 245.6 - 4.45 x 92
1/ All coefficients are significant at 5% probability by Student’s t test.
Table 3 - Coefficient of linear correlation between the traits of two tree species submitted to different planting densities and the traits
of weeds under their canopies1/
Tree species Traits of weeds under the canopies of tree species
Name Traits Number of species per
plot
Green biomass of the shoot (g m-2)
Dry biomass of the shoot (g m-2)
Plant height (m) 0.71 * (0.69*) 0.03ns 0.08ns
Gliricidia
Canopy diameter (m) 0.42ns(0.58*) 0.17ns 0.05ns
Plant height (m) 0.02ns(0.03ns) 0.24ns 0.18ns
Sabiá
Canopy diameter (m) 0.22ns(0.21ns) 0.13ns 0.16ns
1/ *, ns = significant at 5% probability and non-significant by Student’s t test, respectively. Coefficients in parentheses were obtained from
(Benavides et al., 2009), just as observed in our study.
Although in general the coefficient of linear correlation does not indicate a cause and effect relationship, in gliricidia there was a positive correlation between plant height and number of weed species (NWS) under the canopy, as well as between canopy diameter and NWS (Table 4). Such relationship is unexpected, since it has been observed that gliricidia controls weed growth (Silva et al., 2010b). Possibly, gliricidia controls the growth of some species, but it may be even beneficial to others through a process known as facilitation (Callaway, 1995). The legume gliricidia could benefit some species by providing nitrogen to them, for instance. Although like gliricidia sabiá is a perennial legume, these two species must have several different traits that have not been assessed in this study.
Tree intercropping
Twenty-six weed species were recorded under the canopy of trees grown as monocrops and as intercrops (Table 4). It is interesting to mention that the most frequent species (Merremia aegyptia) is considered tolerant to a certain degree of shading (Kissmann & Groth, 1999). In general, competition for light is considered to be the main factor that limits plant growth under the canopy of trees.
There were no differences between growing systems or among growing system groups with regard to tree height (Table 5). However, on average, growing systems that included gliricidia showed canopies with greater diameters than those of neem (Table 5). The effect of intercropping on growth becomes more evident as the trees grow older, and has been reported for E. grandis stand intercropped with P. guachapele (Balieiro et al., 2004).At seven years, intercropped trees showed greater increase in diameter. After two
years, E. globulus plants showed greater
height and at four years they showed greater diameter when intercropped with A. mearnsii
(Forrester et al., 2004). Tree age may even affect the survival of species involved in the intercropping system (Balbinot et al., 2010).
In addition, there were no differences among growing systems and among growing system groups with regard to the number of weed species per plot and weed green and dry biomass of the shoot (Table 5). These traits may also be associated with the young age of the trees from this study. The reduced shading provided by the small tree canopies may exert little weed competition for light. In spite of that, there is evidence that gliricidia can control weeds when competing with them even at early growth stages, probably due to allelopathy (Silva et al., 2010b).
Table 4 - Occurrence index (ratio between the number of plots where a given weed species occurred and the total number of plots in
the experiment) of weed species under the canopies of three tree species at one year of age, grown as monocrops and as intercrops
Weed species Occurrence index
(%) Weed species
Occurrence index (%)
Adenocalymmasp. 8.3 Macroptilium martii 5.6
Alternantherasp. 44.4 Merremia aegyptia 86.1
Amaranthus viridis 2.8 Mimosa caesalpiniifolia 2.8
Blainvillea dichotoma 11.1 Mimosa quadrivaluis 55.6
Borreria verticillata 11.1 Molochia pyramidata 19.4
Centrosema brasilianum 5.6 Panicum maximum 2.8
Chamaecristasp. 1 2.8 Scoparia dulcis 2.8
Chamaecristasp. 2 8.3 Senna uniflora 27.8
Dactyloctenium aegyptium 27.8 Sida cordifolia 19.4
Hyptis suaveolens (L.) Point 13.9 Trianthema portulacostrum 2.8
Indigofera hirsuta L. 27.8 Turnera subulata 27.8
Ipomoea asarifolia 13.9 Urochloa mosambicensis 66.7
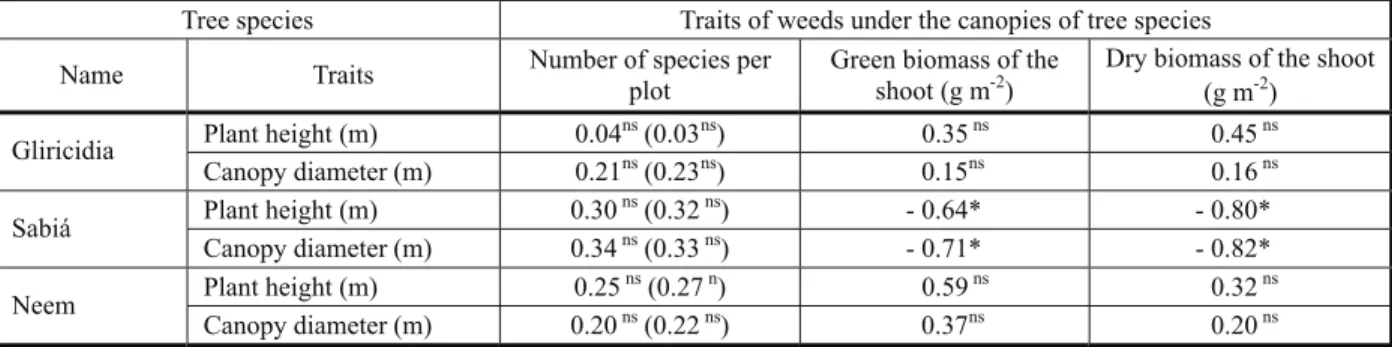
In sabiá, a negative linear correlation was found between plant height (PH) and green weed biomass (GB), PH and dry weed biomass (DB), canopy diameter (CD) and GB, and CD and DB (Table 6). This negative correlation may indicate that sabiá controls weeds better than gliricidia and neem. Nevertheless, sabiá did not differ from the other species in plant height and, on average, had canopies with intermediate diameters compared to the other species (Table 5). Although canopy diameter and tree height are important factors in the competition of trees with the weeds that grow under their canopies, several other canopy and root system traits might be involved in such competition, in addition to allelopathy. The number and distribution of branches, their density, angle, and leaf area are some of the canopy traits considered to be relevant to such competition (Reffye et al., 1995).
Even though competition is probably the most important process in the relationship between tree species and weeds, it is also
crucial to consider competitive reduction and facilitation as well. Competitive reduction may occur due to the stratification of leaves and roots, and to phenological differences (Kelty, 1992). Facilitation may occur due to an improvement in unfavorable environmental conditions, by an increase in the availability of resources, elimination of potential competi-tors, introduction of beneficial organisms, or herbivore protection (Callaway, 1995).
Based on the experiment on planting densities it can be concluded that gliricidia showed greater plant height than sabiá, but the two species did not differ in canopy diameter, weed frequency, and weed green and dry biomass of the shoot under the tree canopy. Higher planting densities resulted in reductions in all those traits. Based on the experiment on intercropping systems, it can be concluded that the growing systems did not influence tree height; however, the sabiá/ gliricidia/sabiá system showed the greatest canopy diameter, while the neem/neem/
Table 5 - Mean values for plant height and canopy diameter of tree species grown as monocrops and as intercrops in three-row plots, and number of species per plot and green and dry matter of the shoot of weeds found under the canopies of those trees. Assessments refer to the trees in the central row
In each group, in each column, means followed by the same letter do not differ from one another at 5% probability by Tukey’s test.
Weeds Trees
Number of species per plot Rows of tree species
(data in the table refer to the species in the central row, in the various
growing systems) Original data
Data transformed
toÖx + 0.5
Green matter (g m-2)
Dry matter (g m-2)
Plant height
(m)
Canopy diameter
(m)
Growing systems involving gliricidia
Gliricidia + Gliricidia + Gliricidia 5.50 2.44 a 1003.3 a 226.5 a 2.43 a 2.13 a
Sabiá + Gliricidia + Sabiá 5.50 2.42 a 622.8 a 186.0 a 2.63 a 2.53 a
Neem + Gliricidia + Neem 4.75 2.29 a 1183.0 a 306.3 a 2.66 a 2.04 a
Growing systems involving neem
Neem + Neem + Neem 4.75 2.29 a 1483.0 a 290.5 a 2.28 a 0.90 a
Gliricidia + Neem + Gliricidia 5.25 2.38 a 900.5 a 241.5 a 2.44 a 1.16 a
Sabiá + Neem + Sabiá 6.50 2.63 a 1042.8 a 271.0 a 2.10 a 0.98 a
Growing systems involving sabiá
Sabiá + Sabiá + Sabiá 5.50 2.43 a 730.8 a 194.0 a 2.67 a 2.29 a
Gliricidia + Sabiá + Gliricidia 5.50 2.45 a 911.0 a 246.0 a 1.86 a 1.56 a
Neem + Sabiá + Neem 5.25 2.38 a 842.3 a 232.0 a 2.15 a 1.90 a
Growing system groups
Growing systems involving gliricidia 5.25 2.38 a 936.3 a 239.6 a 2.57 a 2.24 a
Growing systems involving Neem 5.50 2.43 a 1142.1 a 267.7 a 2.27 a 1.02 b
Growing systems involving Sabiá 5.42 2.42 a 828.0 a 224.0 a 2.23 a 1.92 ab
neem, gliricidia/neem/gliricidia, and sabiá/ neem/sabiá systems had the smallest canopy diameters. The various growing systems did not influence weed frequency and weed dry biomass, but weed green biomass was smaller in the sabiá/gliricidia/sabiá system and greater in the neem/neem/neem system.
LITERATURE CITED
BAIS, H. P. et al. The role of root exudates in rhizosphere interactions with plants and other organisms. Ann. Rev. Plant Biol., v. 57, n. 1, p. 233-266, 2006.
BALBINOT, E. et al. Crescimento inicial de Eucalyptus tereticornis em plantios puros e consorciado com Mimosa caesalpiniifolia e Mimosa pilulifera, em Campos dos
Goytacazes – RJ. R. Árvore, v. 34, n. 1, p. 1-11, 2010.
BALIEIRO, F. C. et al. Dinâmica da serapilheira e transferência de nitrogênio ao solo, em plantios de
Pseudosamanea guachapele e Eucalyptus grandis. Pesq. Agropec. Bras., v. 39, n. 6, p. 597-601, 2004.
BENAVIDES, R.; DOUGLAS, G. B.; OSORO, K. Silvopastoralism in New Zealand: review of effects of evergreen and deciduous trees on pasture dynamics. Agrofor. Syst., v. 76, n. 2, p. 327-350, 2009.
CALLAWAY, R. M. Positive interactions among plants. Bot. Rev., v. 61, p. 306-349, 1995.
CANTARELLI, E. B. et al. Efeito do manejo de plantas daninhas no desenvolvimento inicial de Pinus taeda em várzeas
na Argentina. R. Árvore, v. 30, n. 5, p. 711-718, 2006.
CARMO FILHO, F.; OLIVEIRA, O. F. Mossoró: um município do semi-árido nordestino.Mossoró: Fundação Guimarães Duque/ESAM, 1989. 62 p. (Coleção Mossoroense, Série B, 672).
EMPRESA BRASILEIRA DE PESQUISA
AGROPECUÁRIA – EMBRAPA. Centro Nacional de Pesquisa do Solo. Sistema brasileiro de classificação de solos. 2.ed. Brasília: 2006. 412 p.
FORRESTER, D. I.; BAUHUS, J.; KHANNA, P. K. Growth dynamics in a mixed-species plantation of Eucalyptus globulus and Acacia mearnsii. For. Ecol. Manag., v. 193,
n. 1-2, p. 81-95, 2004.
FORRESTER, D. I. et al. Mixed-species plantations of
Eucalyptus with nitrogen-fixing trees: a review. For. Ecol. Manag., v. 233, n. 2-3, p. 211-230, 2006.
HENRY, H. A. L.; AARSSEN, L. W. On the relationship between shade tolerance and shade avoidance in woodland plants. Oikos, v. 80, n. 3, p. 575-582, 1997.
INDERJIT; CALLAWAY, R. M. Experimental designs for the study of allelopathy. PlantSoil, v. 256, n. 1, p. 1-11, 2003.
JANDEL. Jandel TBLCURVE. Table Curve 3.0. Curve fitting software. Corte Madalena: Jandel Scientific, 1992. 280 p.
KEGGE, W.; PIERIK, R. Biogenic volatile organic
compounds and plant competition. Trends Plant Sci., v. 15, n. 3, p. 126-132, 2009.
KELTY, M. J. The role of species mixtures in plantation forestry. For. Ecol. Manag., v. 233, n. 9, p. 195-204, 2006.
KELTY, M. J. Comparative productivity of monocultures and mixed-species stands. In: KELTY, M. J.; LARSON, B. C.; OLIVER, C. D., eds. The ecology and silviculture of mixed-species forests. Dordrecht: Springer, 1992. p. 125-141.
KIILL, L. H. P.; MENEZES, E. A., ed. Espécies vegetais exóticas com potencialidades para o Semi-Árido brasileiro. Brasília: Embrapa Informação Tecnológica, 2005. 340 p.
Table 6 - Coefficient of linear correlation between traits of tree species, grown as monocrops and as intercrops, and traits of weeds under their canopies1/
Tree species Traits of weeds under the canopies of tree species
Name Traits Number of species per
plot
Green biomass of the shoot (g m-2)
Dry biomass of the shoot (g m-2)
Plant height (m) 0.04ns(0.03ns) 0.35ns 0.45ns
Gliricidia
Canopy diameter (m) 0.21ns(0.23ns) 0.15ns 0.16ns
Plant height (m) 0.30ns(0.32ns) - 0.64* - 0.80*
Sabiá
Canopy diameter (m) 0.34ns(0.33ns) - 0.71* - 0.82*
Plant height (m) 0.25ns(0.27n) 0.59ns 0.32ns
Neem
Canopy diameter (m) 0.20ns(0.22ns) 0.37ns 0.20ns
1/ *, ns = significant at 5% probability and non-significant by Student’s t test, respectively. Coefficients in parentheses were found from
KISSMANN, K. G.; GROTH, D. Plantas infestantes e nocivas. 2.ed. São Paulo: BASF, 1997. Tomo II. 978 p.
KÖEPPEN, W. Climatologia; con un estudio de los climas de la tierra. México: Fondo de CulturaEconomica, 1948. 478 p.
LARPKERN, P.; MOE, S. R.; TOTLAND, Ø. Bamboo dominance reduces tree regeneration in a disturbed tropical forest. Oecologia, v. 165, n. 1, p. 161-168, 2010.
LEOPOLD, A. C.; SALAZAR, J. Understory species richness during restoration of wet tropical forest in Costa Rica. Ecol. Restor., v. 26, n. 1, p. 22-26, 2008.
MAKINEN, H.; HEIN, S. Effect of wide spacing on increment and branch properties of young Norway spruce.
Europ. J. For. Res., v. 125, n. 3, p. 239-248, 2006.
MARASCHIN-SILVA, F.; AQÜILA, M. E. A. Potencial alelopático de espécies nativas na germinação e crescimento inicial de Lactuca sativa L. (Asteraceae). Acta Bot. Bras., v. 20, n. 1, p. 61-69, 2006.
NEVES, E. J. M. Importância dos fatores edafo-climáticos para o uso do Nim (Azadirachta indica A. Juss) em programas florestais e agroflorestais nas diferentes regiões do Brasil.Colombo: EmbrapaFlorestas, 2004. p.99-107. (Boletim de Pesquisa Florestal, 49).
REFFYE, P. D. et al. A Model simulating above- and below-ground tree architecture with agroforestry applications.
Agrof. Syst., v. 30, n. 1, p. 175-197, 1995.
RONDON, E. V. Estudo de biomassa de Tectona grandis L. sob diferentes espaçamentos no estado de São Paulo.
R. Árvore, v. 30, n. 3, p. 337-341, 2006.
RONDON, E. V. Produção de biomassa e crescimento de árvores de Schizolobium amazonicum (Huber) Ducke sob
diferentes espaçamentos na região de mata. R. Árvore, v. 26, n. 5, p. 573-576, 2002.
ROZADOS-LORENZO, M. J.; GONZÁLEZ-HERNÁNDEZ, M. P.; SILVA-PANDO, F. J. Pasture production under different tree species and densities in an Atlantic silvopastoral system. Agrof. Syst., v. 70, n. 1, p. 53-62, 2007.
SAPORETTI Jr., A. W.; MEIRA NETO, J. A. A.;
ALMADO, R. Fitossociologia de sub-bosque de cerrado em talhão de Eucalyptus grandis W. Hill ex Maiden no município de Bom Despacho-MG. R. Árvore, v. 27, n. 6, p. 905-910, 2003.
SCHENK, H. J. Root competition: beyond resource depletion. J. Ecol., v. 94, n. 4, p. 725-739, 2006.
SCRIVANTI, L. R.; ZUNNINO, M. P.; ZYGADLO, J. A.
Tagetes minuta and Schinus areira essential oils as
allelopathic agents. Biochem. Syst. Ecol., v. 31, n. 6, p. 563-572, 2003.
SILVA, A. A.; VARGAS, L.; WERLANG, R. C. Manejo de plantas daninhas na cultura do milho. In: GALVÃO, J. C. C.; MIRANDA, G. V. Tecnologias de produção do milho. Viçosa, MG: Universidade Federal de Viçosa, 2004. p. 269-310.
SILVA, P. S. L. et al. Weed control via intercropping with gliricidia. I. Cotton crop. Planta Daninha, v. 27, n. 1, p. 87-104, 2009.
SILVA, P. S. L. et al. Weed community and growth under the canopy of trees adapted to the Brazilian Semi-Arid Region.
Planta Daninha, v. 28, n. 1, p. 69-76, 2010a.
SILVA, P. S. L. et al. Influence of corn sowing density and gliricidia intercropping on weed control. Planta Daninha, v. 28, n. 2, p. 271-279, 2010b.