regional committee
PAN AMERICAN
HEALTH
ORGANIZATION
XXIX Meeting
WORLD
HEALTH
ORGANIZATION
XXXV Meeting Washington, D.C.
September-October 1983
Provisional Agenda Item 21 CD29/24 (Eng.)
3 August 1983
ORIGINAL: ENGLISH-SPANISH
PRELIMINARY REPORT ON THE SITUATION IN THE REGION OF THE AMERICAS IN REGARD TO THE STRATEGIES OF
HEALTH FOR ALL BY THE YEAR 2000
I _ _ _ - LL
directing council
CD29/24 (Eng.)
INDEX
Page
I. INTRODUCTION
II. DESCRIPTION OF THE BASELINE SITUATION IN RELATION TO THE MINIMUM REGIONAL GOALS
III. SOME FACTORS INFLUENCING THE HEALTH SITUATION
IV. IMPLEMENTATION OF THE POLICIES
V. CONCLUSION
1
3
25
41
CD29/24 (Eng.)
I.
INTRODUCTION
The present report describes the current situation in the Region of the Americas in regard to the minimum regional goals for the status of health and the health service system, the social and economic factors that affect the health situation, and the characteristics of the policies, strategies, and health plans of the countries. In 1980 the XXVII Meeting of the Directing Council of the Pan American Health Organization approved the objectives, goals and regional strategies for attaining the global goal of Health for All By the Year 2000. The next year the Directing Council approved the Plan of Action for the implementation of the Regional Strate-gies. Chapter 3 on the System of Evaluation and Monitoring, in Part III of the Plan of Action, published as Official Document 179, underscores the need for systematic evaluation and monitoring of the process for attaining the goal.
Since the established regional objectives require raising the levels of health and well-being and promoting greater social equity, the regional evaluation of the achievements toward the global goal must be made in terms of national level-of-health averages. It must also take into account the degree to which there is a reduction of the differences between the levels of health and well-being of the population at large and those of the human groups in which less satisfactory living conditions prevail. The latter groups are the ones which the Regional Strategies have recognized as "Priority Human Groups."
In accordance with the World Health Organization, four regional evaluations will be conducted, one at the end of each 6-year period, with the first to be done in 1983 to acquire baseline information, and the others following in 1989, 1995 and 2001. These periods would coincide with the evaluations of the Seventh, Eighth and Ninth General Programs of Work of the World Health Organization.
The initial evaluation must establish a baseline for the monitor-ing, analysis and assessment of the progress being made toward attainment of the global goal, and also interpret the operation of the process. The information presented in this document may be complemented by data appear-ing in "Health Conditions in the Americas, 1977-1980," on the health situation, health services and a number of demographic and socioeconomic variables.l/ However, the data needed to establish that baseline with the characteristics described for it, do not exist in the countries at this
CD29/24 (Eng.) Page 2
CD29/24 (Eng.) Page 3
II.
DESCRIPTION OF THE BASELINE SITUATION IN RELATION TO THE MINIMUM REGIONAL GOALS
A. HEALTH STATUS
1. Minimum Goals
In establishing the Regional Strategies for attaining the goal of Health for All By the Year 2000, the Governments of the Region of the Americas adopted minimum regional goals and objectives. The minimum health status goals are as follows:
a) No country in the Region will have a life expectancy at birth of less than 70 years.
b) No country in the Region will have an infant mortality rate of more than 30 deaths per 1,000 live births.
c) In no country of the Region will the mortality rate in children aged 1-4 years be more than 2.4 deaths per 1,000.
In 1981 the Thirty-fourth World Health Assembly adopted 12 indica-tors for monitoring progress in the implementation of the Global Strategy of Health for All by the Year 2000. Besides those of life expectancy and
infant mortality,2/ the Assembly adopted the following goals for
nutritional status:
a) At least 90 per cent of all newborns will weigh at least 2,500 grams at birth.
b) At least 90 per cent of all children will have a weight-for-age in line with standards based on the reference values adopted by WHO.3/
The information available to the Region of the Americas for describing the baseline situation in relation to those goals and objectives will be considered in the following sections.
2/ Life expectancy at birth must be over 60 years. The infant mortality rate for all identifiable subgroups must be under 50 per 1,000 live births.
A WHO working group has recommended the use of growth tables compiled by the National Center for Health Statistics of the United States of America. See Development of Indicators for Monitoring Progress Toward Health for All By the Year 2000, "Health for All" series No. 4
CD29/24 (Eng.) Page 4
2. Available Information
The data available for compiling this description of the situation in relation to the minimum health goals are of national scope, that is, they are national averages. Nevertheless, the intention implicit in the global goals is to reduce inequalities among countries, and among human groups within any single country. Therefore, indicators to measure the present situation in the Region relative to the goals adopted by PAHO and WHO should be constructed for human groups. However, the data needed to do this are not available at this time, and this limitation must be kept very much in mind in considering the present report.
The health situation in relation to life expectancy and infant mor-tality has been described using data of the United Nations Population Division for the period 1980-1985. These are estimates based on population censuses, mortality and birth data, and studies of the trends of these vital occurrences in the countries. The purpose of this method is to off-set to the extent possible the underreporting of vital statistics. Where data of the Population Division are lacking, the description is based on data furnished by the countries in response to PAHO questionnaires, which are the source of the data on mortality among children 1-4 years old. In many cases, these data are impaired by the underreporting of deaths.
No data are available on the weight of either newborns or children under five years. Hence, it will be necessary to promote the collection of these data through representatives samples so that the countries may monitor their progress toward these goals.
3. Life Expectancy at Birth
CD29/24 (Eng.) Page 5
Table No. 1
LIFE EXPECTANCY AT BIRTH LATIN AMERICA AND THE CARIBBEAN
1980-1985
Life expectancy Population
at birth* Number of (in thousands)
(in years) Countries** Number %
70 and older 12 25,868 7.1
65.0 to 69.9 11 127,543 35.1
60.0 to 64.9 6 174,141 47.9
Under 60 5 35,428 9.7
Unknown 12 790 0.2
Total 46 363,770 100.0
*Source: World Population Prospects as Assessed in 1980 (United Nations, 1981).
**Includes countries and other political units.
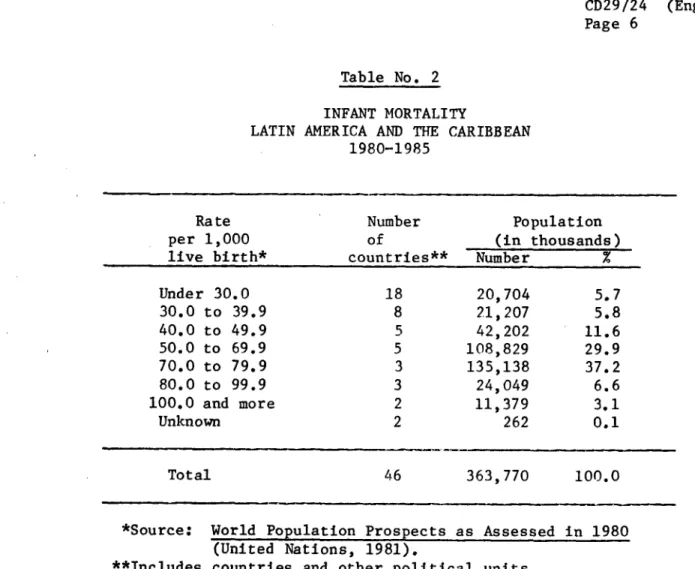
4. Infant Mortality
CD29/24 (Eng.) Page 6
Table No. 2
INFANT MORTALITY
LATIN AMERICA AND THE CARIBBEAN 1980-1985
Rate per 1,000 live birth*
Number of
countries**
Population (in thousands)
Number %
Under 30.0 30.0 to 39.9 40.0 to 49.9 50.0 to 69.9 70.0 to 79.9 80.0 to 99.9 100.0 and more
Unknown 18 8 5 5 3 3 2 2 20,704 21,207 42,202 108,829 135,138 24,049 11,379 262 5.7 5.8 11.6 29.9 37.2 6.6 3.1 0.1
Total 46 363,770 100.0
*Source: World Population Prospects as Assessed in 1980 (United Nations, 1981).
**Includes countries and other political units.
If Canada and the United States of America were included in the foregoing table, it would show that 44 per cent of the population of the Region of the Americas lives in countries and other political units with infant mortality rates of less than 30 per 1,000 live births.
Analysis of the principal causes of infant mortality in the categories shown in Table No. 2 brings out the following structure:
For countries with high infant mortality rates4 /
a) Enteritis and other diarrheal diseases are among the two leading causes of death in the six countries.
Rates of 70 and over per 1,000 live births. reporting data on causes of death.
4/
_ __
CD29/24 (Eng.) Page 7
b) Influenza and pneumonia are among the four leading causes of death.
c) Mortality from conditions arising in the perinatal period are among the three leading causes of death in five countries, and the fifth ranking cause in one of them.
d) Bronchitis, emphysema and asthma are in third and fourth place among the leading causes of mortality in five countries.
In countries with low infant mortality ratest/
a) Causes of perinatal mortality appear as the leading cause of death in the eight countries in this category.
b) Congenital defects are the second, third or fourth-ranking cause of death in eight countries.
c) Influenza and pneumonia are the second and third-ranking causes in five countries and the fifth in one country.
d) Enteritis and other diarrheal diseases are the second-ranking cause in three countries and the fourth in four.
e) Accidents are the fourth or fifth-ranking cause in four countries.
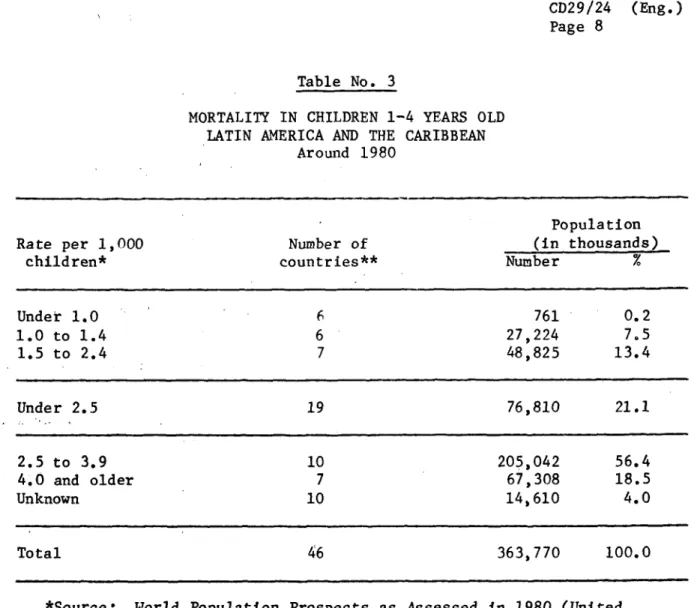
5. Mortality in children 1-4 years old
There are data for only 36 countries and other political units in Latin America and the Caribbean, representing 96 per cent of this sub-region's population. Nineteen countries and other political units (21.1 per cent of the population) have attained the goal of reducing mortality in children 1-4 years old to less than 2.5 per 1,000 children of those ages, as shown in the following table:
CD29/24 (Eng.) Page 8
Table No. 3
MORTALITY IN CHILDREN 1-4 YEARS OLD LATIN AMERICA AND THE CARIBBEAN
Around 1980
Population
Rate per 1,000 Number of (in thousands)
children* countries** Number %
Under 1.0 6 761 0. 2
1.0 to 1.4 6 27,224 7.5
1.5 to 2.4 7 48,825 13.4
Under 2.5 19 76,810 21.1
2.5 to 3.9 10 205,042 56.4
4.0 and older 7 67,308 18.5
Unknown 10 14,610 4.0
Total 46 363,770 100.0
*Source: World Population Prospects as Assessed in 1980 (United Nations, 1981).
**Includes countries and other political units.
More than half of the population of Latin America and the Caribbean (56.4 per cent) lives in countries and other political units with mortality rates of 2.5 to 3.9 per 1,000 children 1-4 years old. In the others (18.5 per cent) the rate ranges between 4.3 and 12.4 deaths per 1,000 children in this age group. The ranking of the countries in terms of these mortalities does not match their ranking in respect of infant mortality or life expec-tancy. Many countries where infant mortality is very high or the life expectancy very short have no data for mortality among children 1-4 years old, or else they report rates so low as to be inconsistent with the others. These considerations point to problems of underreporting of deaths in this age group. As previously noted, these data are furnished directly by the countries and, unlike the data for infant mortality and life expectancy, were not analyzed in the United Nations Population
CD29/24 (Eng.) Page 9
Canada and the United States of America are excluded from the fore-going analysis. If they were included, the proportion of the population living in countries and other political units in the Region of the Americas with rates under 2.5 (the regional goal) would be 53.1 per cent.
Analysis of the causes of death among children 1-4 years old in the categories of countries and other political units shown in Table No. 3 is as follows:
In countries with high mortality rates6/
a) Enteritis and other diarrheal diseases appear as the leading causes of death in the six reporting countries.
b) Influenza and pneumonia rank second and third among the leading causes of death.
c) Bronchitis, enphysema and asthma rank second, third and fourth as causes of death in five of the six countries.
d) Measles is the third or fourth-ranking cause of death in three of those countries.
e) Avitaminosis and other nutritional deficiencies rank fourth and fifth among the leading causes of death in five of the countries.
In countries with the lowest mortality rates7 /
a) Accidents are the leading cause of death in four countries and the second-ranking cause in one.
b) Influenza and pneumonia rank second or third among the leading causes of death in the five countries.
c) Congenital defects are the second, third or fourth-ranking cause in the five countries.
d) Cancer ranks second or third among the leading causes of death in three of the countries.
e) Enteritis and other diarrheal diseases rank first among the leading causes in one country and fourth and fifth in four countries.
6/ Rates of 4 and over per 1,000 children 1-4 years old. Six countries reporting data on causes of death.
CD29/24 (Engo) Page 10
B. THE HEALTH SERVICES SYSTEM
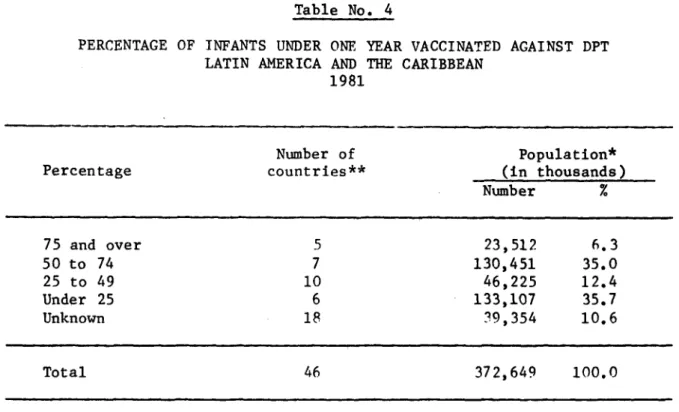
1. Immunization Coverage
a) Minimum Goals
The minimum regional goals establish that by the year 1990 immuni-zation services are to be provided to 100 per cent of the children under one year of age against diphtheria, whooping cough, tetanus, tuberculosis, measles and poliomyelitis. In addition, they must be provided against tetanus to 100 per cent of the expectant mothers in areas endemic for tetanus neonatorum in accordance with preestablished norms. The goal fur-ther states that ofur-ther vaccines are to be included in the service delivery system whenever warranted by the specific epidemiological situation.
b) Available Information
The data presented on vaccinations of children under one year of age are taken from the responses to quarterly and annual questionnaires for 1981 sent by the countries to PAFO under the Expanded Program on Immuniza-tion. There are no data on the number of vaccinations of expectant mothers against tetanus.
1.1 Vaccination against Diphtheria, Whooping Cough and Tetanus (DPT)
The available data on DPT are for 28 countries harboring 89.4 per cent of the population of Latin America and the Caribbean (Table No. 4). In 1981 only five countries and other political units, with 6.3 per cent of the subregional population, vaccinated 79 per cent or more of their chil-dren under one year of age with complete doses against diphtheria, tetanus and whooping cough. Countries and other political units making efforts to attain the regional goal, with coverages currently between 50 and 75 per cent, account for 35 per cent of that population. Countries with coverages of less than 50 per cent contain the remaining 48.1 per cent of the sub-regional population, which conveys the challenge posed by the 1Q90 goal.
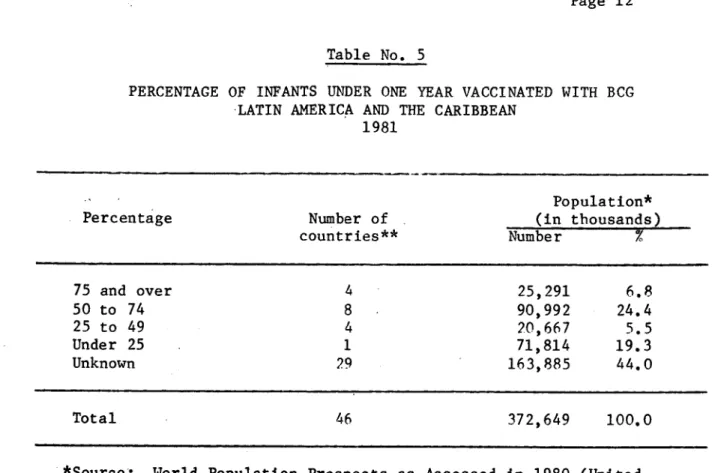
1.2 Vaccination against Tuberculosis (BCG)
CD29/24 (Eng.) Page 11
Table No. 4
PERCENTAGE OF INFANTS UNDER ONE YEAR VACCINATED AGAINST DPT LATIN AMERICA AND THE CARIBBEAN
1981
Number of Population*
Percentage countries** (in thousands)
Number %
75 and over 5 23,512 6.3
50 to 74 7 130,451 35.0
25 to 49 10 46,225 12.4
Under 25 6 133,107 35.7
Unknown 18 39,354 10.6
Total 46 372,649 100.0
*Source: World Population Prospects as Assessed in 1980 (United Nations, 1981).
**Includes countries and other political units.
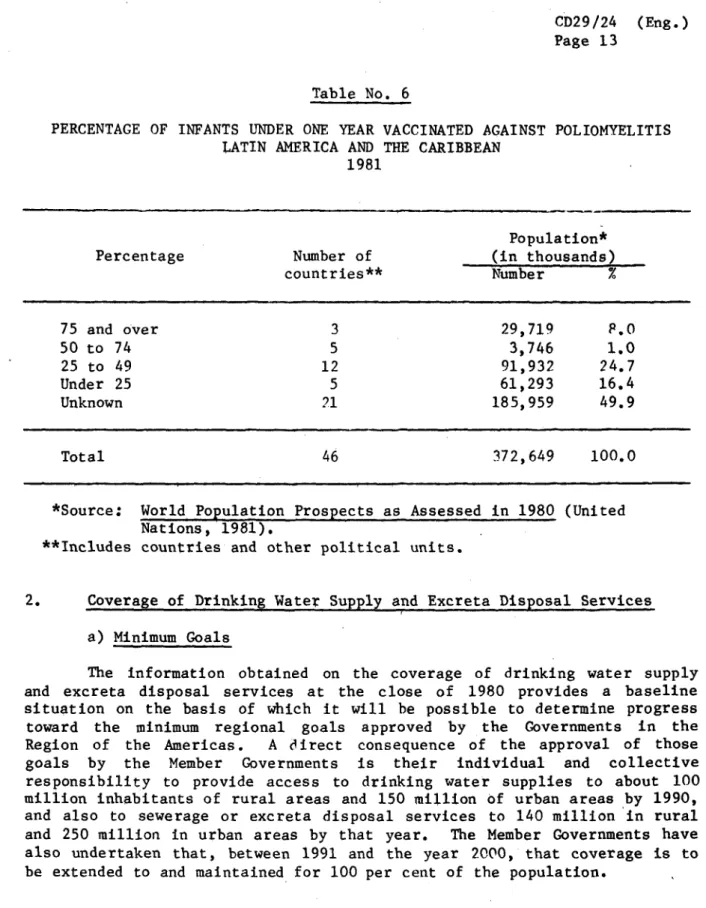
1.3 Vaccination against Poliomyelitis
CD29/24 (Eng.) Page 12
Table No. 5
PERCENTAGE OF INFANTS UNDER ONE YEAR VACCINATED WITH BCG LATIN AMERICA AND THE CARIBBEAN
1981
Population*
Percentage Number of (in thousands)
countries** Number %
75 and over 4 25,291 6.8
50 to 74 8 90,992 24.4
25 to 49 4 20,667 5.5
Under 25 1 71,814 19.3
Unknown 29 163,885 44.0
Total 46 372,649 100.0
*Source: World Population Prospects as Assessed in 1980 (United Nations, 1981).
**Includes countries and other political units.
1.4 Vaccination against Measles
CD29/24 (Eng.) Page 13
Table No. 6
PERCENTAGE OF INFANTS UNDER ONE YEAR VACCINATED AGAINST POLIOMYELITIS LATIN AMERICA AND THE CARIBBEAN
1981
Population*
Percentage Number of (in thousands)
countries** Number %
75 and over 3 29,719 P.0
50 to 74 5 3,746 1.0
25 to 49 12 91,932 24.7
Under 25 5 61,293 16.4
Unknown 21 185,959 49.9
Total 46 372,649 100.0
*Source: World Population Prospects as Assessed in 1980 (United Nations, 1981).
**Includes countries and other political units.
2. Coverage of Drinking Water Supply and Excreta Disposal Services
a) Minimum Goals
CD29/24 (Eng.) Page 14
Table No. 7
PERCENTAGE OF INFANTS UNDER ONE YEAR VACCINATED AGAINST MEASLES LATIN AMERICA AND THE CARIBBEAN
1981
Population*
Percentage Number of (in thousands)
countries** Number
75 and over 2 14,239 3.8
50 to 74 6 171,524 46.0
25 to 49 4 33,613 9.0
Under 25 6 112,847 30.3
Unknown 28 40,426 10.9
Total 46 372,649 100.0
*Source: World Population Prospects as Assessed in 1980 (United Nations, 1981).
**Includes countries and other political units.
b) Available Information
As part of the global monitoring of the International Drinking Water Supply and Sanitation Decade 1981-1990 (IDWSSD) established by WHO to determine, among other things, the progress of the countries toward these goals, the countries of Latin America and the Caribbean were asked in 1982 for information on their situation in the base year of 1980.
c) Analysis of the Information
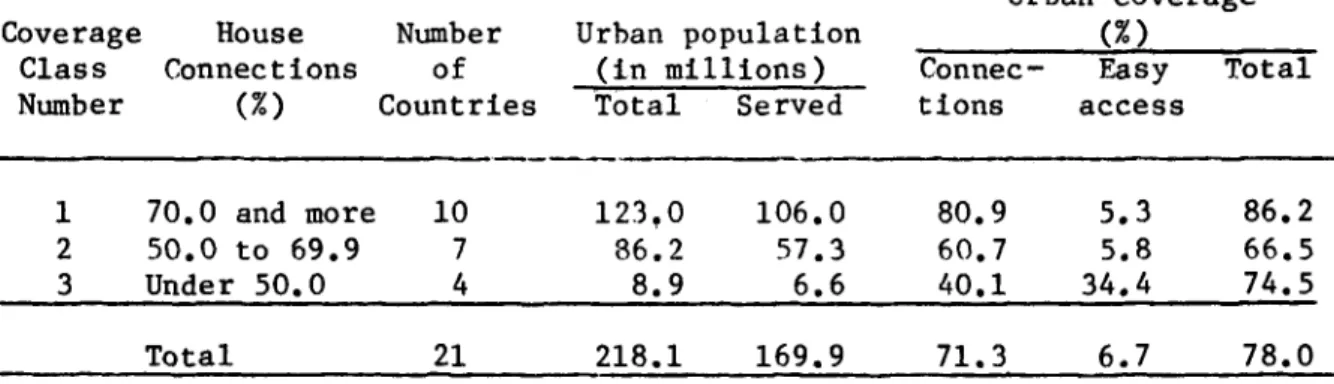
Analysis of the data returned by 21: countries aggregating about 95 per cent of the population of the Region--exclusive of Canada and the United States of America--yields the following findings;
i) Of the 333 million inhabitants of those 21 countries, 170 million, or 78 per cent of the urban population, were supplied with drinking water through house connections or through public standpipes not farther than 200 meters away from their homes.
ii) Of the total of 115 million inhabitants of rural areas,8/ 48.7 million inhabitants, or 42 per cent, were provided with drinking water supplies.
8/ The maximum population that an area may contain and qualify as rural
CD29/24 (Eng.) Page 15
iii) In 1980, the basis of the data considered, 56.3 per cent of the urban population was served by sewerage and excreta disposal facilities compared with only 11.0 per cent of the rural population.
Within each country, however, there were marked differences between the coverages of the two sectors, as shown in the following tables:
Table No. 8
COVERAGE OF URBAN DRINKING WATER SUPPLIES LATIN AMERICA AND THE CARIBBEAN
1980
Urban coverage
Coverage House Number Urban population (%)
Class Connections of (in millions) Connec- Easy Total
Number (%) Countries Total Served tions access
1 70.0 and more 10 123,0 106.0 80.9 5.3 86.2
2 50.0 to 69.9 7 86.2 57.3 60.7 5.8 66.5
3 Under 50.0 4 8.9 6.6 40.1 34.4 74.5
Total 21 218.1 169.9 71.3 6.7 78.0
*Source: Resfmenes sectoriales nacionales. Information based on replies from 21 countries to PAlO/WHO questionnaires.
The 21 countries considered were grouped in three classes for the proportions of their urban populations supplied with water through house connections, inasmuch as the indicators used are representative of 65 per cent of the total population considered. Moreover, these are the most reliable indicators, for they are generally constructed from the public utilities' customer lists. Thus, in class one, for house connection cover-age of 70 to 100 per cent, 6 of the 10 countries reported 100 per cent coverage, including population with easy access to water (not more than 200 meters away from their homes). The other four countries in the class reported proportions ranging between 83 and 97 per cent. The countries in this group, with 56.4 per cent of the total urban population, were closest to the decade goals for urban areas; in the remaining 11 countries the coverage of urban service through house connections was as low as 24 per cent. However, the average coverage for the urban area as a whole was
CD29/24 (Engo) Page 16
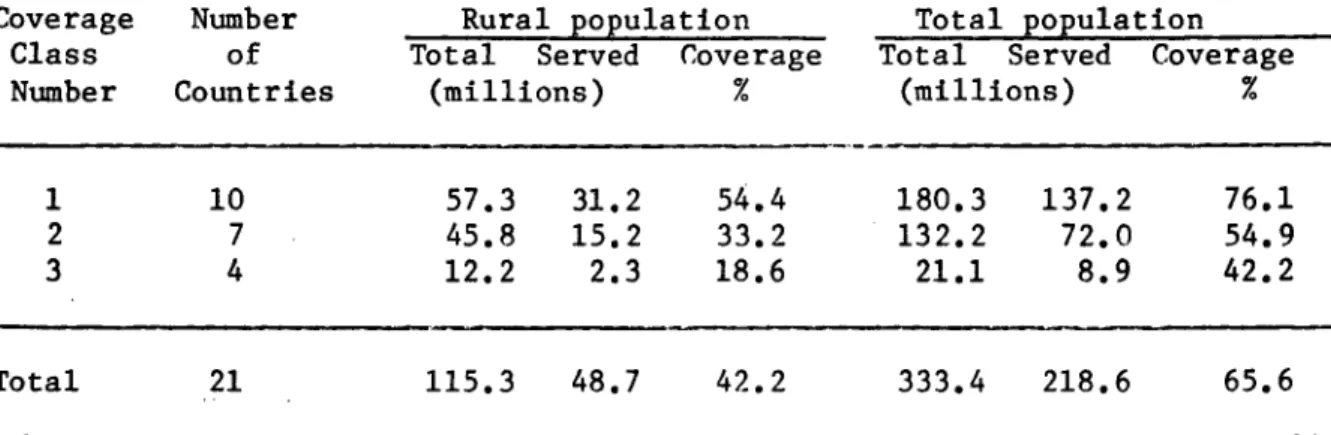
For the rural area, as already noted, this coverage was only 42.2 per cent. Though this coverage represented a smaller percentage of the national populations, its distribution paralleled that of the urban coverage in the same three classes of countries, as can be seen in the following table.
Table No. 9
COVERAGE OF RURAL AND AGGREGATE DRINKING WATER SUPPLIES LATIN AMERICA AND THE CARIBBEAN
1980
Coverage Number Rural population Total population
Class of Total Served Coverage Total Served Coverage
Number Countries (millions) % (millions) %
1 10 57.3 31.2 54.4 180.3 137.2 76.1
2 7 45.8 15.2 33.2 132.2 72.0 54.9
3 4 12.2 2.3 18.6 21.1 8.9 42.2
Total 21 115.3 48.7 42.2 333.4 218.6 65.6
*Source: Resdmenes sectoriales nacionales.
In the first class, which included 64 per cent of the rural popula-tion, five countries reported that 60 to 93 per cent of that population had access to drinking water sources. Two countries reported coverages of 50 to 60 per cent of that population. The data include house connections the numbers of which, though they are frequent in most countries, could not be precisely determined. The other three countries in this class, and the 11 countries in the two other classes, showed coverages of less than 50 per cent. Only 48.7 per cent of the total rural population had access to drinking water supplies in 1980. Averaging this percentage with the cover-age attained in the urban area yields an avercover-age covercover-age of 65.6 per cent, for a total of 218.6 million inhabitants served with drinking water supplies in the 21 countries considered.
I I
CHART NO. 1
PERCENTAGE OF WATER SUPPLY COVERAGE ACCORDING TO URBAN AND RURAL
POPULATION LATIN AMERICA AND THE CARIBBEAN
119801
~\\\U
\~~\\\\\\\1 \Y\\ \\\t\50 100
POPULATION (in millions)
200
NO. OF TOTAL PERCENTAGE COUN- POPULAT1ON
COVERAGE TRIES (In millions)
Less than 10
-10 to 19 1 5.0
20 to 29 1 3.1
30 to 39 2 5.8
40 to 49 2 15.6
50 to 59 8 128.9
60 to 69 2 9.8
70 to 79 2 119.9
80 to 89 8 36.8
90 to 100 8 26.6
TOTAL 34 351.5 500
(Log. Scale)
I
I
100-90 70 o u C U U z U C po~ < (L Z-IIZ H4 60 50 40 30 20 101 10 OQh)
(D %.
OQi
09
a
\\\\ \\\\\\\\\\ \\\\\\\\\\\\\\\\\\\\\\\ Cs
,wM 1
1
S&
I I
7
CD29/24 (Eng.) Page 18
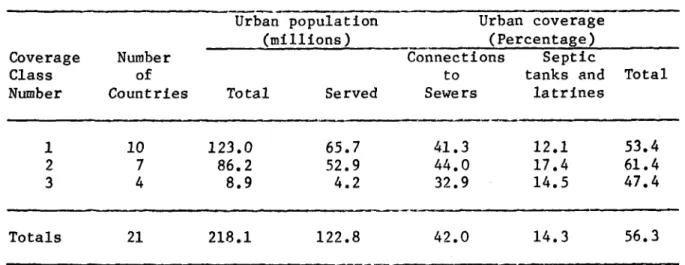
With respect to sewerage and sanitary excreta disposal services in urban areas, the differences between the population coverages with house connections to sewers in the three classes of countries are less pronounced, as can be seen in the following table.
Table No. 10
COVERAGE OF URBAN SEWERAGE AND EXCRETA DISPOSAL SERVICES LATIN AMERICA AND THE CARIBBEAN
1980
Urban population Urban coverage
(millions) (Percentage)
Coverage Number Connections Septic
Class of to tanks and Total
Number Countries Total Served Sewers latrines
1 10 123.0 65.7 41.3 12.1 53.4
2 7 86.2 52.9 44.0 17.4 61.4
3 4 8.9 4.2 32.9 14.5 47.4
Totals 21 218.1 122.8 42.0 14.3 56.3
*Source: Resfmenes sectoriales nacionales.
The same classification was used in determining differences between populations with house connections to water supplies and to sewers. It was found that, on an average, in class one the difference between the cover-ages of the two services was 40 per cent, that is, about 49 million inhab-itants of urban areas with house connections to water supplies did not have similar connections to sewers. In the latter group, only 15 million had septic tanks or latrines. Moreover, 7 of the 10 countries reported that 90 to 100 per cent of the population was served by sewerage and sanitary excreta disposal facilities, and the remaining countries contained large populations with coverages of scarcely 30 to 60 per cent, with all the health hazards implicit in that situation.
CD29/24 (Eng.) Page 19
Rural sanitation in the 21 countries considered existed for a mere 11 per cent of the total rural population, which amounts to 12.7 million inhabitants provided with adequate excreta disposal facilities. However, the information from some countries was unreliable because they did not keep adequate records, and in most cases the sanitary facilities were installed by individuals. Three of the 21 countries, with 36 per cent of the total rural population considered, reported no coverage figure at all; of the remaining countries, four reported coverages of 70 to 90 per cent, one a coverage of 60 per cent, and the others 30 per cent or lower.
This sanitation situation in the rural area, which contains 35 per cent of the total subregional population, lowers the index of coverage of sewerage and excreta disposal services of the urban and rural population to 40.7 per cent, or 136 million inhabitants in the 21 countries consid-ered. Adding existing information from another 13 countries in the Region reduces this percentage to 39.5 per cent of the total, with seven countries posting coverages in excess of P0 per cent and serving 29 million persons, three with coverages of 50 to 80 per cent and 40.3 million inhabitants served, and the remaining 24 countries with coverages below 50 per cent, with 69.7 million persons served out of a total of 139 million inhabitants. This situation is illustrated in Chart No. 2.
3. Coverage and Utilization of Health Services
a) Minimum Goals
The minimum regional goal approved by the Governments in this case establishes that access to health services will be extended to 100 per cent of the population.
b) Available Information
There is no information on the current situation of health services coverage. However, some data on health resources and their utilization, based on questionnaires prepared by PAHO and on official publications, are available and are analyzed in greater detail in "Health Conditions in the Americas, 1077-1980."
c) Analysis of the Information
The available information does not precisely convey the levels of coverage attained by the health services to date. At the beginning of the seventies it was estimated that 37 per cent of the population--more than 100 million persons--had no health services of any kind.
CHART NO. 2
PERCENTAGE OF SEWERAGE AND EXCRETA DISPOSAL ACCORDING TO
URBAN AND RURAL POPULATION
·
LATIN AMERICA AND CARIBBEAN
119801
I
NO. OF TOTAL
PERCENTAGE COUN- POPULATION COVERAGE TRIES (In millions)
Less than 10 10 7.8
10 to 19 4 13.9
20 to 29 4 135.1
30 to 39 4 98.0 40 to 49 2 6.4
50 to 59 1 2.9 60 to 69 1 25.0
70 to 79 1 27.9 80 to 89 4 30.3 90 to 100 3 4.2
TOTAL 34 351.5
50 100 200
POPULATION (in millions) 70
60
50
40
C
o
to
H
x
X
I:)
z
10
'4
500
(Log. Scale)
pa
obo
(D I m
0r O M~
CD29/24 (Eng.) Page 21
The capability to provide services is conveyed in a ratio of about two hospital beds to every 1,000 inhabitants and a number of establishments of different complexity identified as health centers, dispensaries and health posts, which provide ambulatory care in communities of different demographic and socioeconomic characteristics.
The indicators by which coverage is traditionally estimated are sub-ject to limitations in respect of the quantity, quality and timeliness of the information from which they are constructed. In many countries, infor-mation is lacking on the care services provided by ambulatory facilities, particularly those that reach out into the community and employ new kinds of auxiliary and voluntary personnel.
An approximation of the current situation is conveyed by some indicators of utilization of health services. The discharge rates for 12 countries in 1978 range between 3 and 17 discharges for every 100 inhab-itants. The outpatient consultations per inhabitant/year for 17 countries range between 0.2 and 5.0. In eight countries the proportion of infants under one year of age who receive care ranges between a low of 52.4 and a high of 100 per 100 live births, and that of children between 1 and 4 years of age receiving care in 10 countries between 9.6 and 38.0 per 100 children in that age group.
Another report on 9 countries indicates that the population living in localities of less than 2,000 inhabitants received medical care between 0.1 and 1.5 times per inhabitant/year. Based on geographic access to any type of health unit, the ratio in such localities may be one such unit to every 5,000 inhabitants.9/
It has to be borne in mind that the wide variety of institutions providing care services, in conjunction with the underdevelopment of truly sector-wide information systems, hampers the interpretation of indicators in regard to the mix of services available to different population groups and to the quality of those services. For example, it has been estimated that, in 16 countries where the social security systems are required to
provide direct care, that care is available to about 55 per cent of the population.
This coverage gap, which leaves unprotected chiefly the socioecono-mically depressed populations living in rural areas remote from urban centers and on the fringes of cities, results mainly from an insufficiency of facilities, though it is also associated with the organization of those facilities, which frequently are not responsive to the needs and conve-nience of the population. The problem does not lie solely in the numerical ratio of facilities to population, but includes also operational and quali-tative impediments to their efficiency and effectiveness, which do not show up in the conventional indicators. Besides, data on the availability
CD29/24 LEn )
Page 22
of services say very little about the actual coverage, which must result from a combination of a supply of services adequate to the needs of the different human groups and their actual use by individuals and the community.
From another standpoint, in most cases the coverage information is not detailed enough to allow the establishment of differences among indica-tors for different geographic areas, communities or population groups, in the countries or for the Region as a whole.
Finally, the information on services for the mentally ill, adoles-cents, the aged, and working people warrants the inference that these coverages are only incipient. In the occupational health field, most pro-grams cover only the workers in large firms affiliated to social security, which often do not exceed 20 per cent of the economically active popula-tion. This leaves without insurance coverage against the risks of occupa-tional accidents and occupaoccupa-tional disease the personnel of small firms and, in many cases, farm workers, who together with the former account for more than 50 per cent of the labor force.
d) Status of Drinking Water Supply and Excreta Disposal
Infrastructures
The different stages of the provision of drinking water supply and excreta disposal services to the aforementioned population, from overall and sectoral planning down to the design, construction, administration, operation and maintenance of systems, are the work of institutions in different sectors. These institutions include, among others, ministries and secretariats of planning, public health, public works, the interior or government, and ecology; water supply and sanitation agencies at the national, regional and local level; and other regional and urban development units.
The 21 countries considered reported about 260 participating institutions, not counting provincial, state or departmental governments, and the municipal governments, which, in conjunction with the rural water supply committtees or boards, also administer and operate services
directly. Only 10 per cent of these countries had decentralized
institutional structures in the form of autonomous regional and municipal mixed enterprises; 14 per cent of the countries were decentralizing in
this direction. Of the rest, nine had a national instituion in charge of the administration, operation and maintenance of these services in urban and rural areas, and seven divided them between two institutions: one for the urban and the other for the rural area. In addition to these national institutions, however, other regional and municipal agencies continue to exist, and share with the ministry of health and the communities the responsibility for the provision of these services under not always
clear-cut arrangements, in a situation that results in areas of
CD29/24 (Eng.) Page 23
regard, 9 of 17 countries describe as grave or very grave the constraints imposed by an inappropriate institutional framework, which in five of them is accompanied by an inadequate or outmoded juridical framework. Eight describe the intermittency of water supplies as a grave problem, and 13 report considerable constraints on the operation and maintenance of their services, while the other countries describe these constraints as moderate. Lack of community participation is regarded as a grave
shortcoming by 39 per cent of the countries.
Of the 21 countries considered, 17 provide data on manpower in the sector. These data indicate that in those 17 countries in 1980, the water supply and sanitation sector employed 228,400 persons, who supplied 219 million persons with water and 123 million urban and rural inhabitants with sewerage and excreta disposal services. This amounts to an aggregate average productivity (for water supply and excreta disposal combined) of 1,500 inhabitants per employee.
The distribution of this manpower among the various categories is illustrated in the following table:
Table No. 11
MANPOWER IN THE WATER SUPPLY AND SANITATION SECTOR, BY OCCUPATIONAL CATEGORIES, IN LATIN AMERICA AND THE CARIBBEAN
1980
Posts filled at close
Category of 1980 (thousands) Percentage
Planning and management 8.7 3.8
Technical staff 47.5 20.8
Skilled labor 118.9 52.1
Administrative personnel 49.1 21.5
Personnel based in the community 4.2 1.8
Total 228.4 100.0
Forty-three per cent of the countries regard as grave or very grave the constraints imposed on services by an insufficiency of trained staff at both the professional and intermediate levels.
CD29/24 (Eng.) Page 24
have defined their goals: nine have defined them to 1990 and the other 11 have defined them partially, some of them being restricted, by not yet having a plan, to the horizon of the national planning period, which usually runs from 4 to 5 years.
According to the investment projections worked out by 17 of the 21 countries, representing 92.6 per cent of the aggregate population considered, the national plans they have formulated for the decade call for combined investment of US$36,000 million at constant prices of 1980.
The figures and distribution foreseen by the countries for investments in drinking water supplies and sanitation in the urban and rural areas, respectively, are as follows:
Table No. 12
PROJECTIONS FOR INVESTMENTS IN DRINKING WATER SUPPLIES AND SANITATION IN 17 COUNTRIES OF LATIN AMERICA AND THE CARIBBEAN 1981-1990
(in millions of US$)
Drinking water supplies Sanitation
Total
investment Urban Rural Urban Rural
$ $ % 4.5 2,382 6.6 %
33,036 14,018 38.9 3,600 10.0 16,036 44.5 2,382 6.6
This would amount to an average annual investment of about US43,600 million during the decade, much more than has been reported by 52 per cent of the countries (with 67 per cent of the population) as invested in 1980, which was US$1,394 million. This combined with the financial constraints, which are regarded as very grave by 3 and as grave by another P of the 21
CD29/24 (Eng.) Page 25
III.
SOME FACTORS INFLUENCING THE HEALTH SITUATION
A. DEMOGRAPHIC ASPECTS
On the basis of the data available toward mid-1980 it is estimated that in that year the population of the Region of the Americas totaled 611.5 million inhabitants, and will rise to 864.5 million by the year 2000 (see Table No. 13).
These estimates and projections and all the analyses hereafter are based on the mean growth variant, that is, the population trends that seem most likely on the basis of past trends, the expected social and economic development, and the prevailing attitudes and population policies. Based on different assumptions of future fertility, mortality and migration rates, ;he estimates of the total population in the Region in the year 2000 would yield a low variant of 828 and a high of 891 million inhabitants.
The table also shows that population growth is greatest in the countries1 0/ of Latin America and the Caribbean, the population of which amounted to three fifths of the regional total in 1980, and should increase to two thirds by the end of the century. This relative increase reflects a faster growth of the population in the mainland countries of Latin America, inasmuch as the population of the Caribbean countries is growing at a rate close to the Regional average.
It is also apparent from the table that the population growth rates, though high, are in a down trend. The reason for this deceleration is that birth rates have fallen faster than mortality, as illustrated in Charts Nos. 3 and 4 for changes in life expectancy at birth and in the gross reproduction ratio.ll/ These two measures are not affected by the popu-lation age structure, and so afford better comparability over time than other mortality and fertility indicators.
Reduced mortality has resulted in an almost steady increase of the life expectancy at birth in the countries of Latin America and the Carib-bean, where between 1960 and 1980 it gained seven and a half years, and is projected to increase almost five years more over the next two decades, which would bring it to 69 years by the year 2000. In Canada and the United States of America, life expectancy at birth reached 70 years as
10/ Here and in the rest of the chapter, this term includes all political units.
Table No. 13
ESTIMATED AND PROJECTED TOTAL, URBAN AND RURAL POPULATION IN THE REGION OF THE AMERICAS 1980-2000
Total population
Region
Total Latin America and Caribbeana
Latin Americab Caribbeana Canada and USA
Number (in thousands) Distribution (X)
1980 1990 2000 1980 1990 2000 1980-
1990-1990 2000
611,487 733.022 864,492
363,770 459,372 565,829
333,056 30,714 247,717 422,679 36,693 273,650 522,461 43,368 298,663 100.0 59.5 54.5 5.0 40.5 100.0 62.7 57.7 5.0 37.3 100.0 65.5 60.5 5.0 34.5 1.83 2.36 2.41 1.79 1.00 1.66 2.11 2.14 1.69 0.88
Urban population
Total 428,i14 547,085 676,512 70.0 74.6 78.3 2.48 2.15
Latin America
and Caribbeana 237,753 328,195 428,464 65.4 71.4 75.7 3.28 2.70
Latin Americab 221,970 307,180 401,406 66.6 72.7 76.P 3.30 7.71
Caribbeana 15,783 21,015 27,058 51.4 57.3 62.4 2.90 2.56
Canada and USA 190,361 218,890 248,048 76.8 80.0 83.1 1.41 1.26
Poblaci6n rural
Total 183,373 185,937 187,980 30.0 25.4 21.7 0.14 0.11
Latin America and
Caribbeana 126,017 131,177 137,365 34.6 28.6 24.3 0.40 0.46
Latin Americab 111,086 115,499 121,055 33.4 27.3 23.2 0.39 0.47
Caribbeana 14,931 15,678 16,310
48.6 42.7 37.6 0.49 0.40
Canada and USA 57,356 54,760 50,615 23.2 20.0 16.9 (0.46) (0.79)
aIncludes Bermuda and St. Pierre and Miquelon
bIncludes all countries in the Hemisphere except Canada and the USA. CAverage annual geometric growth rate (X)
Source: Estimates and Projections of Urban, Rural and City Populations, 1950-2025: The 1980 Assessment. ST/FSA/SER.R/45. (New York, United Nations, Department of International Economic and Social Affairs, 1982).
I I
D o
0c
CD29/24 (Eng.) Page 27
early as 1960, and is projected to reach 74.3 years by the end of the century. These figures are averages for both sexes; in Latin America and the Caribbean women live about four years longer than men, compared with eight years longer for women in Canada and the United States of America.
The reduction of the natality rate is reflected in a steep drop of the gross reproduction rate (Chart No. 4). It is projected that the pro-nounced decline of this rate in the countries of Latin America and the Caribbean from 2.90 children in 1960 to 2.05 in 1980 will continue at a similar pace, while the figures for Canada and the United States of America, which began to decline 10 years earlier from an initial level of 1.63, should level off at about 1.0.
Fertility is decreasing faster than mortality, and the reduction in both rates is greater in the countries of Latin America and the Caribbean, which began the period with higher rates. Despite this remarkable drop in
fertility and the consequent deceleration of population growth, the popula-tion of Latin America should increase 57 per cent, that of the Caribbean 41 per cent, and that of Canada and the United States of America 21 per cent between 1980 and the end of the century.
The salient feature of this rapid population growth is that it will be predominantly urban.12/ As can be seen in Table No. 13 and Chart No. 5, the rural population of the countries in Latin America and the Caribbean will increase very little in absolute terms, and will decline relatively from more than a third of the total in 1980 to less than a fourth in the year 2000. During the same period, the rural population of the United States of America and Canada, because of the relative weight of the first of these two countries, will decrease not only relatively, but absolutely as well.
The urban population, on the other hand, will increase relatively from 70 per cent of the regional total in 1980 to 78 per cent in 2000 and should almost double in Latin America and the Caribbean, where the cities will account for almost 430 million people within 17 years. In the Region's developing countries the urban population will grow from less than two thirds to more than three fourths of the total. This development will
CHART NO. 3
LIFE EXPECTANCY AT BIRTH
1950-2025
CHART NO. 4
GROSS REPRODUCTION RATE
1950-2025
3.0
CANADA AND USA
e
z
I--o
0
To
C-CL
CD3
CD
0.
w
cn
4=co
rcu
AMERICA AND CARIBBEAN
2.0
1.0
III ,1 ,:,t 1l 11
60
70
80
90
2000 10
20
LATIN AMERICA AND CARIBBEAN
to,
CANADA AND USA
0f I
I
.II I I I I I I I I i1950
60
70
80
90
2000
10
20
YEAR
YEAR
80
=
70
I-: C
z
x
60
LL
o50
1950
CD29/24 (Eng.) Page 29
be more pronounced in the countries of mainland Latin America, where the level of urbanization, i.e., the proportion of urban population, will grow to about 77 per cent of the total in the year 2000, a proportion reached in the United States of America and Canada together in 1980. The pace of urbanization, which reflects the growth of the urban population relative to the rural, is somewhat slower in the countries of the Caribbean, where the urban population should increase from 51 to 62 per cent of the total over the same period.
This rapid pace of urbanization is also seen in the growth projected for cities of different sizes. Since this kind of estimate is more diffi-cult to project into the future for smaller cities, Table No. 14 presents data only for cities of one million inhabitants and over.13/ By the end of the century the population resident in cities of this size should account for almost half (49 per cent) of the urban population and almost two fifths (38 per cent) of the Region's total population. The proportions in the two developed countries are somewhat higher, those of the Caribbean country somewhat lower, and those of mainland Latin America fairly similar to the regional average. Except in the Caribbean subregion, the total population living in cities of this size is much larger than the rural population, as can be seen in Chart No. 5.
The greatest challenge, however, is expected from the increase in and growth of the largest cities. In 1980 the Region had 11 cities of more than four million inhabitants, aggregating 99 million persons. It is estimated that by the year 2000 this figure will have risen to 20 cities with an aggregate population of 184 million. Two thirds of this population --more than 122 million persons--should reside in the 12 major cities of mainland Latin America, which should double their population in the next two decades by a factor of 2.2. By that time the combined population of those 12 cities should be almost a million and a half more than the number of people that will then be living in the rural areas of that subregion.
Chart No. 6 shows the age and sex compositions of the urban popula-tion in the Region's developed and underdeveloped countries in the years 1980 and 2000. It can be seen that the population of both sexes becomes increasingly urban in the two groups of countries and that, as already seen, by the year 2000 the developing countries will have become about as urban as the developed ones. At the older ages, the level of urbanization in both groups of countries is much greater for women than for men, though there are marked differences in the urbanization profile between the sexes and the different ages. These differences in degree of urbanization result from a host of factors, which certainly include differences in migration and mortality rates.
Table No. 14
POPULATION IN CITIES OF ONE MILLION INHABITANTS AND MORE, NUMBERS OF CITIES, AND PROPORTIONS OF URBAN AND TOTAL POPULATION IN THE REGION OF THE AMERICAS
1980 AND 2000
1980 2000
Size Cities Population Percentage Percentage Cities Population Percentage Percentage Region (in millions) (number) (in thousands (urban) (total) (number) (in thousands) (urban) (total)
4.0 and more 11 99,342 23.2 16.2 20 184,214 27.2 21.3
Total 2.0 - 3.9 17 45,200 10.6 7.4 27 73,110 10.8 8.5
1.0 - 1.9 31 42,974 10.0 7.0 55 73,866 10.9 8.5
Latin 4.0 and more 6 55,840 23.5 15.4 12 122,450 28.6 21.6
America 2.0 - 3.9 8 21,458 9.0 5.9 14 38,602 9.0 6.8
and 1.0 - 1.9 13 17,551 7.4 4.8 29 38,921 0.1 6.9
Caribbean
Latin 4.0 and more 6 55,840 25.2 16.8 12 122,450 30.5 23.4
America 2.0 - 3.9 7 19,424 8.8 5.8 10 27,975 7.0 5.4
1.0 - 1.9 11 14,496 6.5 4.4 28 37,860 9.4 7.2
4.0 and more
-Caribbean 2.0 - 3.9 1 2,034 12.9 6.6 4 10,627 39.4 24.6
1.0 - 1.9 2 3,055 19.4 10.6 1 1,061 3.9 2.5
Canada 4.0 and more 5 43,502 22.8 17.6 8 61,764 24.9 20.7
and 2.0 - 3.9 9 23,742 12.5 9.6 13 34,508 13.9 11.6
USA 1.0 - 1.9 18 25,423 13.4 10.3 26 34,945 14.1 11.7
Source: Estimates and Projections of Urban, Rural and City Populations, 1950-2025: The 1980 Assessment, ST/ESA/SER.R/45. United Nations, Department of International Economic and Social Affairs, 1982).
(New York,
;? g
CD ZD
Ogo
t1%
0
OQ.r
CHART No. 5
ESTIMATED AND PROJECTED POPULATION ACCORDING TO URBAN AND RURAL RESIDENCE
1980 AND 2000
POPULATION
(in millions]
400
300
200
100
o0
67%
33%
URB.
RUR.
1980
7700
23%
1
URB.
RUR.
2000
Cities
by number
of inhabitants
U
Im
4.0
million
and
over
2.0- 3.9
million
1.0-1.9
million
77%
51% 49%
'
1
URB.
RUR.
1980
62%3
... 00 O
URB.
RUR.
2000
jjj:
23%
URB.
RUR.
1980
CANADA AND
USA
83%
17%
B. RUR.
2000
oqCD29/24 (Eng.) Page 32
CHART No. 6
LEVELS
OF URBANIZATION CLASSIFIED
BY
SEX AND AGE
1980 AND
2000
%
%
Urban
Urban
85
2000
70
.
70
i,,/
--
Women
1980
Go6a~ / 60
Latin America
and
AecaCANADA
and USA
and
Caribbean
55 55 I
0
10 20 30 40 50 60
70+
0 10
20
30 40 50 60 70+
CD29/24 (Eng.)
Page 33
Another feature of the population of the Americas is its progressive aging. Table No. 15 and Chart No. 7 depict the structure of the population by major age groups in 1980 and 2000. In all but the two most developed countries of the Region, it is seen that the proportion of those under 15, though decreasing, will remain high, particularly in rural areas. In the developed countries, people 65 years of age and older constitute about 11 per cent of the population, almost two and a half times the proportion of this age group elsewhere in the Region. It has been seen, the proportion of the rural population is higher in the countries of the Caribbean than in those of Latin America; nevertheless, the population of the Caribbean is slightly older, though that of the Latin American countries will age some-what faster. The number of persons in the Region 65 years of age and older will increase from 42 million to 61 million, and in the urban areas of the developing countries will more than double, from less than 11 million in 1980 to more than 22 million in the year 2000. The reason for this aging of the population is chiefly due to simultaneous declines in the fertility and mortality rates, though the migration of specific age groups may be a contributing factor; the large growth of the urban population appears to bear out this assumption.
-CD29 /24
Page 34
(Eng. )
Table No. 15
STRUCTURE OF THE URBAN AND RURAL POPULATION BY BROAD AGE GROUPS REGION OF THE AMERICAS
1980-2000
Population (in thousands)
Region Age Total Urban Rural
Groups 1980 2000 1980 2000 1980 2000
Under 15 201,592 261,762 131,052 194,671 70,540 67,091
Total 15-64 368,235 541,828 266,251 432,454 101,984 109,374
65 and over 41,712 60,962 30,848 49,434 10,864 11,528
Latin Under 15 144,760 196,101 88,484 141,155 56,222 54,946
America and 15-64 203,460 341,767 138,340 265,198 65,120 16,569
Caribbean 65 and over 15,538 27,879 10,864 22,030 4,674 5,849
Latin Under 15 133,270 182,475 83,264 133,573 50,006 48,902
America 15-64 185,869 314,639 128,779 247,521 57,090 67,118
65 and over 13,917 25,347 9,927 20,312 3,990 5,035
Under 15 11,436 13,626 5,220 7,582 6,216 6,044
Caribbean 15-64 17,591 27,128 9,561 17,677 8,030 9,451
65 and over 1,621 2,532 ,937 1,718 684 814
Canada Under 15 56,886 65,661 42,568 53,516 14,318 12,145
and 15-64 164,775 200,061 127,911 167,256 36,864 32,805
USA* 65 and over 26,174 33,083 19,984 27,404 6,190 5,679
*Includes Greenland, Bermuda, St, Pierre and Miquelon,
Source: Age and Sex Structure of Urban and Rural Populations. 1970-2000: The 1980 Assessment. ESA/P/WP,81. (New York, United Nations, Department of International Economic and Social Affairs,
I
I
CHART No. 7
STRUCTURE CLASSIFIED BY BROAD AGE GROUPS
OF URBAN AND RURAL POPULATION 1980-2000
65 and over
15-64
0-14
65 and over
15-64
0-14
65 and over
I
1
15-64
0-14
65 and over
15-64
-0-14
65 and over
15-64
0-14
65 and over
1
1
15-64
0-14
- ' & a...a--6
1980 2000 1980
2000
URB.
RUR.
1980 2000
URB.
1980 2000
RUR.
1980 2000
URB.
1980
2000
RUR.
CANADA AND USA
100
90
80
70
co -e -.a-60
50
40
30
20
10
0
OQ M
UCI
t7j
00
I
CD29/24 (Eng.) Page 36
B. OTHER FACTORS
Next, a number of tables will be presented illustrating the distri-bution of the political units of Latin America and the Caribbean, and of their populations in terms of the general fertility rate (Table No. 16), illiteracy (Table No. 17), per capita gross domestic product (Table No. 18), and availability of protein (Table No. 19). Owing to their obviously much higher level of development, this distribution leaves out Canada and the United States of America, which if included would be in the best cate-gory for each of those indicators, that is, in the lowest class for fertil-ity and illiteracy and in the highest for gross product and protein supplies. It will be recalled that these two countries contain 40 per cent of the Region's population, and including of them would mask the problems still facing the developing countries.
The figures shown speak for themselves, but they do ignore part of the problem. They say nothing about the grave consequences of the world economic recession for the developing countries, particularly the steady decline of their employment capacity and in the level and distribution of their incomes.
A recent analysis estimates at 20 per cent the total proportion of underutilization (overt unemployment and underemployment) of the economi-cally active population in 14 Latin American countries studied in 1980; in one of these countries the proportion was actually higher than 40 per cent.l4/ A previous study had estimated that, in 1970, 40 per cent of the households in 10 Latin American countries were below the poverty line, and almost half of them below the indigence line, in one of them the figures going to the extreme of 65 per cent for poor households and 45 per cent for indigent households.15/
Both studies were done before the recent worsening of the interna-tional economic situation, which from 1980 to 1983 may be characterized as a short-term contraction within a long-term one. The recurrent recessions of the seventies became progressively more severe and in the United States of America the recession of 1980 and 1981 became worse than any other in the postwar period.16/ This is all suggestive of an aggravation of the situation of unemployment and income distribution as described and,
14/ Norberto E. Carcfa, "Growing Labour Absorption with Persistent Unemployment," CEPAL Review (Santiago, Chile, United Nations, Economic Commission for Latin America, No. 18, December 1982), pp.
45-64.
15/ Oscar Altimir, "The Extent of Poverty in Latin America," CEPAL Manuals (Santiago, Chile, United Nations, Economic Commission for Latin America, 1979).
CD29/24 (Eng.) Page 37
consequently, of its adverse influence on the national averages of some countries, which as early as 1980 indicated that they had reached or surpassed the minimum goals for life expectancy at birth and infant mortality.
Table No. 16
GENERAL FERTILITY RATE IN LATIN AMERICA AND THE CARIBBEAN 1980-1985
Number Population*
Rate (a) of (in thousands)
countries** Number %
Under 90.0 6 44,798 12.3
90.0 - 119.9 4 13,971 3.8
120.0 - 149.9 4 30,792 P.5
150.0 - 179.9 5 164,680 45.3
180.0 - 219.9 7 101,599 27.9
220.0 and over 2 6,424 1.8
Unknown 18 1,506 0.4
TOTAL 46 363,770 100.0
(a)Annual number of live births per 1,000 women between ages
of 15 and 49 years.
*Source: Selected Demographic Indicators by Country,
ST/ESA/SER.A/38, (New York, United Nations, Depart-ment of Economic and Social Affairs, 1980).
CD29/24 Page 38
Table No. 17
ILLITERACY IN LATIN AMERICA AND THE CARIBBEAN
(Around 1980)
(Eng.)
Population*
Illiteracy (in thousands)
rate(a) Countries** Number Percentage
Under 5.0 10 12,556 3.5
5.0 - 9.9 9 32,535 8.9
10.0 - 14.9 6 17,633 4.8
15.0 - 19.9 6 101,088 27.8
20.0 - 29.9 5 163,648 45.0
30.0 - 39.9 4 16,702 4.6
40.0 and over 4 19,495 5.4
Unknown 2 113 ...
TOTAL 46 363,770 100.0
(a) In population over 14 years of age.
CD29/24 Page 39
(Eng.)
Table No. 18
PER CAPITA GROSS DOMESTIC PRODUCT LATIN AMERICA AND THE CARIBBEAN
1980
Number Population*
of in thousands
GDP/Inhabitant(a) Countries**
Number Percentage
2,000 and over 5 20,216 5.6
1,650 - 1,999 3 98,715 27.1
1,350 - 1,649 4 137,825 37.9
1,000 - 1,349 4 36,076 9.9
700 - 999 4 35,357 9.7
Under 700 4 19,867 5.5
Unknown 22 15,714 4.3
TOTAL 46 363,770 100.0
(a) United States dollars at constant prices of 1980.
*Source: Economic and Social Progress in Latin America (Washington, D.C., Inter-American Development Bank Report, 1982).
CD29/24 Page 40
(Eng.)
Table No. 19
PROTEIN SUPPLY
LATIN AMERICA AND THE CARIBBEAN 1978-1980
Number Population
of in thousands*
Proteins(a) countries**
Number Percentage
90.0 and more 2 27,096 7.5
70.0 - 89.9 12 114,703 31.5
50.0 - 69.9 19 172,461 47.4
Less than 50.0 4 19,874 5.5
Unknown 9 29,636 8.1
TOTAL 46 363,770 100.0
(a) Per capita protein supplies (in grams) per day.
*Source: FAO Production Yearbook. Vol. 35, FAO Statistical Series No. 40 (Rome, 1982).
CD29/24 (Eng.) Page 41
IV.
IMPLEMENTATION OF THE POLICIES
Ratification at the national level of the goal of health for all by the year 2000 affords an opportunity to translate national, regional and global policies into concrete measures. These measures are in two direc-tions: one toward removal of the major restrictions to the development and operation of health care delivery services, and the other toward the accelerated development of those programs and services. For a start, nine countries have established national strategies and six of them have formu-lated plans of action for their implementation; two countries report that they are formulating their national strategies; in eight it is reported that health strategies are a component of the national development plans; and, finally, eight countries say they are taking steps to adjust their health plans to the priorities and demands of primary care. As an illus-tration of these initial activities, in four countries seminars on the Regional Plan of Action have been held at the national level, in addition to two seminars on community participation and intersectoral articulation in countries of the Caribbean. In general, the countries advise that they are assessing the implications of the Plan of Action for their national
plan and situations.
Implementation of the strategies constitutes by definition not a static situation but a dynamic and highly changeable phenomenon, which the analyses that follow will endeavor to summarize. It must be mentioned firstly that the information obtained from the evaluation of the Ten-Year Health Plan for the Americas, and that generated since, is not enough for these purposes. This situation in itself conveys an idea of the innumer-able constraints on the development of health services. Moreover, it is necessary to match and harmonize the postulates of the Regional Plan of Action with national realities and plans in relation to objectives, goals and resources, as well as with the concepts and even the language of the Plan of Action.
A. PLANNING AND DEVELOPMENT IN THE HEALTH FIELD
CD29/24 (Eng.) Page 42
plans--has been solidly institutionalized in more than 80 per cent of the major institutions in the sector, to which it may be added that 20 coun-tries have national planning laws and health sector units operating under the national planning system. In this field almost all the countries report two situations that have to be remedied: on the one hand, a lack of coordination among the institutions that make up the health sector and, on the other, a lack of information for the planning, conduct and evaluation of plans and programs.
B. PRIMARY HEALTH CARE
The concept of primary health care is being adopted and beginning to be incorporated into plans and programs in all the countries.
Using different language, the countries report highly deliberate efforts, with variable progress, to review their priorities and apply resources to the development and operation of integrated services so as to make them more easily accessible to the population segments and groups that are most vulnerable from the epidemiological and socioeconomic standpoints. This effort is reported not only in the organization of services in geogra-phic areas where they were previously nonexistent, but in reorganizing the programs of conventional services as well. The trend most frequently seen is toward the expansion and strengthening of the service network with a view to making those services more easily accessible geographically, economically and culturally to the entire population, and to introducing in them a substantial component of promotion and prevention work with the family, in the community, and at places of work.
C. COMMUNITY ORGANIZATION AND DEVELOPMENT
This subject is conceptually much in evidence in health plans, but practical applications remain as scarce and as slow as at the end of the Ten-Year Health Plan, particularly in relation to extremely marginal com-munities. It may be said that the old causes of this problem subsist: