Baropodometric analyses of patients before and after
bariatric surgery
Ivan Leo Bacha,I,II,*Fernanda Antico Benetti,I Ju´lia Maria D’Andre´a GreveIII
IFaculdade de Medicina da Universidade de Sa˜o Paulo, Fisiopatologia Experimental, Sa˜o Paulo/SP, Brazil. IIUniversity of Alberta (UofA), Alberta
Internationally Educated Physiotherapists Bridging Program, Edmonton/AB, Canada. IIIFaculdade de Medicina da Universidade de Sa˜o Paulo,
Departamento de Ortopedia e Traumatologia, Laborato´rio para o Estudo do Movimento, Sa˜o Paulo/SP, Brazil.
OBJECTIVE:The aim of this study was to evaluate the vertical component of the ground reaction force, plantar pressure, contact area of the feet and double-support time using static and dynamic (gait) baropodometry before and after bariatric surgery.
METHODS:Sixteen individuals with a body mass index of between 35 and 55 were evaluated before and after bariatric surgery. Thirteen patients (81.3%) were female and three (18.8%) male and their average age was 46±10 (21-60) years. An FSCAN system (version 3848) was used for baropodometric analyses (1 km/h and 3 km/h). The peak plantar pressure and ground reaction force were measured for the rear foot and forefoot. The double-support time and foot contact area were measured during gait.
RESULTS:There were reductions in the ground reaction force in the forefoot and rear foot and in the foot contact area in all evaluations and of the double-support time at 3 km/h, as well as a significant reduction in the body mass index at six months post-surgery. The peak pressure did not vary at 1 km/h and at 3 km/h, reductions in peak pressure were observed in the left and right rear feet and left forefoot.
CONCLUSIONS: Weight loss after bariatric surgery resulted in decreases in the ground reaction force and contact area of the foot. Plantar pressure was decreased at 3 km/h, especially in the forefoot. There was an increase in rhythm because of a reduction in the double-support time at 3 km/h.
KEYWORDS: Obesity; Morbid; Biomechanics; Foot; Body weight; Bariatric Surgery; Gait.
Bacha IL, Benetti FA, D’Andre´a Greve JM. Baropodometric analyses of patients before and after bariatric surgery. Clinics. 2015;70(11):743-747
Received for publication onApril 1, 2015;First review completed onMay 19, 2015;Accepted for publication onAugust 25, 2015 E-mail: ivanbacha@yahoo.com.br, bacha.ivan@gmail.com
*Corresponding author
’ INTRODUCTION
Obesity is a chronic disease characterized by excessive accumulation of fat in the body (1,2). Overweight in combination with poor body alignment results in changes in load distribution and pressure on articular surfaces, causing muscle overload and contributing to joint degeneration (3-5). The main area of absorption and power dissipation in the foot is the longitudinal arch (6), which can become overwhelmed by increasing body weight.
According to Frey and Zamora (2007), most obese subjects complain of pain in the feet and ankles that is usually related to mechanical stress caused by excess weight (7). Weight gain in both men and women increases plantar pressure, which is associated with foot pain (8).
Baropodometry involves quantitative evaluation of the functioning of the foot by measuring plantar pressure in the gait and orthostatic states. Flexible insoles with sensors that respond to the mechanical deformation caused by the vertical component of the ground reaction force (9) are used in this evaluation. Baropodometry allows for the collection of data in real time, including data on plantar pressure and functioning of the foot during gait (10,11).
The overload on the musculoskeletal system of obese individuals predisposes them to abnormal gait patterns, including a loss of mobility, low cadence and imbalance, and these patterns are directly linked to diseases of the foot, such as osteoarthritis, tendonitis, fasciitis, and even diabetic foot complications (6,12-16). Lai et al. evaluated the three-dimensional gaits of obese adults and normal individuals and determined that the obese group had a slower gait, shorter stride length, increased stance phase and double support (17).
The surgical treatment of obesity is indicated in patients with a body mass index (BMI) of greater than 40 kg/m2or of 35 kg/m2 in the presence of comorbidities. The goals of surgical treatment are not only weight reduction but also improvement of comorbidities and quality of life (18). Obese
DOI:10.6061/clinics/2015(11)05
Copyright&2015CLINICS–This is an Open Access article distributed under the terms of the Creative Commons License (http://creativecommons.org/licenses/by/ 4.0/) which permits unrestricted use, distribution, and reproduction in any medium or format, provided the original work is properly cited.
patients undergoing stomach reduction surgery experience a sharp decrease in body weight over a short period of time that can modify proprioception and lead to changes in posture, alignment, balance and muscle flexibility (18). Weight loss also contributes to changes in posture, body image and gait (19-20).
Although the reduction of obesity is a factor for improved health, rapid modification of the human body may require a period of adaptation to the new conditions and evaluation of gait using baropodometry can be useful to determine the impact of rapid weight loss on the feet of obese patients (21). The aim of this study was to evaluate the vertical component of the ground reaction force, plantar pressure, contact area of the feet and double-support time using static and dynamic (gait) baropodometry before and after bariatric surgery.
’ METHODS
Sixteen patients of both genders were assessed at the Bariatric and Metabolic Surgical Unit of the Hospital das Clínicas at the University of São Paulo School of Medicine. The evaluations were performed immediately before and at
six months after surgery. The inclusion criteria were as follows: provision of written informed consent; an age of between 20 and 60 years; a BMI of between 35 and 55 kg/m2; a cognitive level high enough to understand the procedures and follow the guidelines provided; and identification as an independent household walker. Patients who were unable to perform the tests were excluded.
All participants signed the consent form and the study was approved by the CAPPesq of the HCFMUSP (no. 0860/09). The sample consisted of 16 individuals who underwent bariatric surgery, including 13 (81.3%) females and three (18.8%) males. The average age was 46±10 (21-60) years.
Initially, a clinical review was conducted that included anthropometric measurements of body mass (kg) and height (m) in patients wearing only swimsuits, the use of the Feiss line to assess the extent of the medial longitudinal plantar arch and assessment of the BMI.
After the clinical evaluation, all volunteers were subjected to static and dynamic baropodometric assessments using an FSCAN system (Figure 1) version 3848, which measures the peak values of pressure and the ground reaction force in the rear foot and forefoot, the double-support time and the foot contact area. Flexible insoles were cut according to the sizes of each volunteer’s feet (Figure 2) and were placed inside of the shoes. Each insole was 0.18 mm thick and had 960 sensors that were sensitive to mechanical strain. The sensors were evenly distributed as a screen over the entire surface of the foot.
Static and dynamic acquisitions were performed (1 km/h and 3 km/h) and each dynamic acquisition captured six to seven steps. We selected the four core steps of each acquisition for analysis.
Statistical analysis
The subjects were characterized with regard to age and gender. Foot types, as determined according to the Feiss line, were analysed using McNemar’s test.
The distributions of the quantitative variables in both the initial and final evaluations (six months after surgery) were normal, permitting application of the paired t-test. The Shapiro-Wilk distribution of normality test was also conducted. The peak of the static ground reaction force in the right rear foot, peak
Figure 1 -FSCAN system version 3848, which measures the peak values for pressure and the ground reaction force for the rear foot and
forefoot, the double-support time, and the foot contact area.
Figure 2 - Insoles. Each insole was 0.18 mm thick and had 960
ground reaction force (3 km/h) in the right forefoot and pressure peak were not normally distributed and non-parametric Wilcoxon post-test was used for paired samples.
’ RESULTS
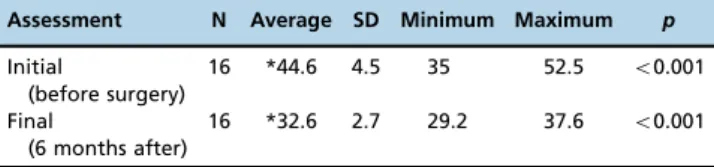
The BMIs before and after surgery are shown in Table 1. There was a significant difference in the BMI between the two assessments (po0.001).
The results for the vertical component of the ground reaction force before and after bariatric surgery are depicted in Table 2, which shows the differences between the first and second evaluations, with a peak reduction in the ground reaction force at six months after bariatric surgery in all individuals.
The results for the plantar contact areas before and after bariatric surgery are depicted in Table 3, which shows that there was a reduction in the plantar contact area at six months after bariatric surgery in all subjects.
The descriptive statistical values for peak plantar pressure are shown in Table 4. There were reductions in plantar pressure at six months after surgery in the right forefoot (p=0.016), right rear foot (p=0.010), left forefoot (p=0.034), and left rear foot (p=0.026). There was no plantar pressure reduction at 1 km/h
at six months after surgery. The results were not homogeneous at 3 km/h because there was no plantar pressure reduction in the right forefoot (p=0.133) but there were reductions at six months after surgery in the right rear foot (p=0.047), left forefoot(p=0.044) and left rear foot (p=0.036).
The descriptive statistical values for the double-support time parameter in the initial and final evaluations are shown in Table 5. There was no significant difference in the evaluations performed at 1 km/h (p=0.434). At 3 km/h, the double-support time for the final evaluation was less than that at the initial evaluation (p=0.003).
’ DISCUSSION
The results showed that the loss of body weight at six months after bariatric surgery caused reductions in the value of the vertical component of the ground reaction force and the area of plantar support in all assessments of the forefoot and rear foot but that it resulted in a less marked reduction in plantar pressure, which is more dependent on the area and running speed. These results show that a significant reduc-tion in the load applied to the feet occurs in patients with morbid obesity when there is a loss of body weight and a decrease in the BMI.
In the static baropodometry, the plantar pressure peak, ground reaction force and contact area of the foot are greater than those of non-obese individuals, according to Fabris et al. (2006) and Birtane and Tuna (2004). These results are in partial agreement with those of the current study, in which all of the patients showed decreased plantar pressure in the forefoot and rear foot in the static evaluation following a loss of body mass as a result of bariatric surgery. Evaluation of foot morphology, which was accomplished by tracing the Feiss line, showed no difference between the initial assess-ment and that performed six months later, indicating that the Table 1-Descriptive statistics for body mass index (kg/m2) at the
time of initial surgery (early time) and at 6 months after surgery.
Assessment N Average SD Minimum Maximum p
Initial
(before surgery)
16 *44.6 4.5 35 52.5 o0.001
Final
(6 months after)
16 *32.6 2.7 29.2 37.6 o0.001
SD = standard deviation; Paired t-test
Table 2-Descriptive statistics for the vertical component of the static and dynamic (1 and 3 km/h) ground reaction force (lb) measured at initial (initial) and final (six months after bariatric surgery) evaluations of the right and left feet, for the forefeet and rear feet of 16 volunteers.
Side Region Evaluation Average SD Median Minimum Maximum p
Static Right Forefoot Initial *44.7 25 38.4 12.1 101.2 0.019
6 months *33.3 21.4 36 0.8 67.2
Rear foot Initial 87.5 17 *88.8 61.5 130 o0.001
6 months 52.3 17.9 *56.6 12.8 75.5
Left Forefoot Initial *44.3 26.5 45.9 7.2 105.6 0.046
6 months *34.2 15.5 35.8 12.5 64.6
Rear foot Initial *72.2 19 74.8 31.4 100.4 0.001
6 months *49.3 18.3 53.7 18.9 75.1
1 km/h Right Forefoot Initial *139.2 63.2 51.7 281.3 0.001
6 months *103 39.3 41.4 172.9
Rear foot Initial *146.8 38.8 91 221.4 0.003
6 months *118.9 28.3 61.9 165.7
Left Forefoot Initial *143.4 55.2 56.6 239 0.005
6 months *118.2 52.2 48 262
Rear foot Initial *140.0 40 48.3 194.1 0.026
6 months *115.7 29.6 64.1 186.8
3 km/h Right Forefoot Initial 194.7 47.9 *188.4 94 270.4 o0.001
6 months 156.2 35.9 *144.8 93.8 220.8
Rear foot Initial *130.6 33.2 130.6 76.2 193.5 0.002
6 months *105.1 25.4 101.9 73.9 153.3
Left Forefoot Initial *209.9 54.7 210.1 123.4 319.3 o0.001
6 months *156.2 39 145 105.1 269
Rear foot Initial *129.9 26.6 127.1 81 173.7 0.001
6 months *100.3 30.6 95.8 37.7 162.7
loss of body mass did not result in modification of the foot type. Thus, the reductions in plantar pressure were related to body mass loss and not to foot shape.
The dynamic evaluation, which was performed at two speeds, was pre-determined to be suitable for use under the initial patient conditions, and it revealed not only reductions in the ground reaction force and contact area but also in the distinct pattern of plantar pressure.
The reaction forces in the gait at 1 km/h were significantly decreased in the forefoot and rear foot of both feet, and no significant reduction in plantar pressure was observed, indicating that greater variability in pressure and its dependence on other factors are more important in the dynamic evaluation. Plantar pressure is defined as the ground reaction force divided by the area of application of this force, i.e., the plantar contact area. This pressure can be considered an indirect data point because it is calculated
from the ground reaction force and contact area; however, the decrease in both values could result in no reduction in plantar pressure due to a smaller force distribution in a smaller contact area.
The ground reaction force was significantly decreased at 3 km/h in both feet and in both regions studied and plantar pressure was reduced at all measured sites, with the exception of the right forefoot, whose values did not differ from those observed at the lower speed. It is possible that the largest effect of body mass reduction on plantar pressure occurred at the higher speed, even when both of these parameters were decreased. The small sample size may have contributed to the differing results obtained at the two speeds, but other factors, such as deformities, rigidity and gait pattern changes, can interfere with plantar pressure because the condition of the plantar surface has a greater effect on plantar pressure than the ground reaction force. Table 3-Descriptive statistics for the plantar contact area (cm2) under static and dynamic conditions (1 and 3 km/h) at the initial (initial) and final (six months after bariatric surgery) evaluations of the right and left feet, for the forefeet and rear feet of 16 volunteers.
Side Evaluation Average SD Minimum Maximum p
Static Right Initial *91.5875 18.6413 63.74 128 0.002
6 months *68.9013 26.606 31.48 115.35
Left Initial 87.6125 22.8014 52.13 125.42 0.056
6 months 71.4519 18.3563 31.74 104.77
1 km/h Right Initial *108.014 17.9792 67.61 146.58 0.01
6 months *92.4675 17.0209 63.48 128.77
Left Initial *111.273 17.6693 82.84 142.45 0.004
6 months *94.8063 19.8817 60.13 138.32
3 km/h Right Initial *102.904 18.5105 59.87 137.55 0.009
6 months *88.935 16.1116 59.87 123.61
Left Initial *104.999 15.2759 75.61 131.35 0.001
6 months *84.9175 18.2079 59.35 128
SD= Standard Deviation; Paired t-test
Table 4-Descriptive statistics for the peak pressure under static and dynamic conditions (1 and 3 km/h) measured at the initial (initial) and final (six months after bariatric surgery) evaluations for the right and left feet, for the forefeet and rear feet of 16 volunteers.
Side Region Evaluation Median Minimum Maximum p
Static Right Forefoot Initial *15 5 55 0.016
6 months *11 5 20
Rear foot Initial *23.5 19 56 0.01
6 months *16 11 40
Left Forefoot Initial *14 5 21 0.034
6 months *11 7 36
Rear foot Initial *23 15 35 0.026
6 months *17 8 36
1 km/h Right Forefoot Initial 38 5 55 0.313
6 months 36 5 20
Rear foot Initial 43.5 19 56 0.147
6 months 43 11 40
Left Forefoot Initial 42.5 5 21 0.352
6 months 35.5 7 36
Rear foot Initial 41.5 15 35 0.604
6 months 37 8 36
3 km/h Right Forefoot Initial 67.5 48 201 0.133
6 months 59 41 121
Rear foot Initial *45.5 23 107 0.047
6 months *34.5 20 74
Left Forefoot Initial *79.5 56 145 0.044
6 months *64 48 191
Rear foot Initial *44.5 22 64 0.036
6 months *34 14 65
In addition to body mass, mobility is an important factor for proper plantar pressure distribution. Rigid feet or those with some type of deformity are more susceptible to hyper-pressure areas, changes in gait and pain. Reducing foot mobility interferes with the vertical component of the ground reaction force in normal feet and can cause pain and structural changes over time (22).
In patients with morbid obesity, increasing the support area is one of the few strategies that can help to reduce overload on the musculoskeletal structures by promoting plantar pressure reduction because the ground reaction force is affected by an individual’s body mass. Decreasing gait speed, which causes an increase in the double-support time is another strategy for plantar pressure reduction, but patients with a very high BMI certainly exceed the compensatory capacity of the body for maintaining functionality.
In all measurements, the decrease in the ground reaction force was greater than that in plantar pressure, indicating that plantar pressure, calculated by dividing the vertical component of the ground reaction force by the contact area, can be more variable and susceptible to other factors, mainly to postural corrections from oscillations that are required to maintain balance in the orthostatic and gait states. This pressure is more variable, while the force is directly affected by an individual’s body mass.
The limitations of this study are directly related to its small sample size, which created difficulties in achieving a homogeneous initial sample, subsequent sampling loss due to postoperative complications and variations in the body mass loss of each individual over time. However, the study still revealed some important results pertaining to the feet of patients with morbid obesity.
This study shows that the loss of body mass helps to improve the functioning of the feet in terms of support and locomotion but indirectly reveals that other factors, such as the muscular condition, morphology and mobility of the feet, need to be considered in this assessment, particularly in relation to future rehabilitation interventions. Increasing the capacity of locomotion in patients with morbid obesity is an important factor for improving the quality of life and success of bariatric surgery.
The following modifications were observed in the static and dynamic baropodometric parameters in the patients with morbid obesity at six months after bariatric surgery: reductions in the ground reaction force and the plantar support area for all subjects, reductions in plantar pressure in the static evaluation and at 3 km/h, and a reduction in the double-support time at 3 km/h.
’ AUTHOR CONTRIBUTIONS
Bacha IL conceived the study, collected the data, participated in analysing the samples, drafted the manuscript and participated in statistical analysis. Benetti FA conceived the study and participated in its design, coordination and drafting. D’Andréa Greve JM participated in analysis and interpretation of the samples.
’ REFERENCES
1. Coutinho WF. Obesidade: conceitos e classificac¸ão. In: Nunes MA, Appolinário JC, Abuchaim ALG. Transtornos alimentares e obesidade. Artes Médicas Sul, Porto Alegre. 2006;197-203.
2. Pi-Sunyer X. Medical complications of obesity. In:. Brownell KD, Fairburn CG. Eating disorders and obesity. New York: Guilford Press. 1995;401-6. 3. Harrison AL, Barry-Greb T, Wojtowicz G. Clinical measurement of head and shoulder posture variables. J Orthop Sports Phys Ther. 1996;23(6): 353-61, http://dx.doi.org/10.2519/jospt.1996.23.6.353.
4. Riegger-Krugh C, Keysor JJ. Skeletal malalignments of the lower quarter: correlated and compensatory motions and posture. J Orthop Sports Phys Ther. 1996;23(2):164-70, http://dx.doi.org/10.2519/jospt.1996.23.2.164. 5. Freres M, Mairlot MB. Maítres et Clés de La Posture. Paris: Frison-Roche; 1997. 6. Dowling AM, Steele JR, Baur LA. Does obesity influence foot structure and plantar pressure patterns in prepubescent children? Int J Obes Relat Metab Disord. 2001;25(6):845-52, http://dx.doi.org/10.1038/sj.ijo.0801598. 7. Frey C, Zamora J. The effects of obesity on orthopaedic foot and ankle
pathology. Foot Ankle Int. 2007;28(9):996-9, http://dx.doi.org/10.3113/ FAI.2007.0996.
8. Butterworth PA, Landorf KB, Smith SE, Menz HB. The association between body mass index and musculoskeletal foot disorders: a sys-tematic review. Obes Rev. 2012;13(7):630-42, http://dx.doi.org/10.1111/ j.1467-789X.2012.00996.x.
9. Lafayette KCS, Mattos HM, Pacheco MTT. A influência podal na postura analisada através da Baropodometria. IX Encontro Latino Americano de Iniciac¸ão Científica e V Encontro Latino Americano de Pós-Graduac¸ão– Universidade do Vale do Paraíba. 2007.
10. Gurney JK, Kersting UG, Rosenbaum D. Between-day reliability of repeated plantar pressure distribution measurements in a normal popu-lation. Gait & Posture. 2008;27(4):706–9.
11. Cantalino JLR, Mattos HM. Análise das impressões plantares emitidas por dois equipamentos distintos. ConScientiae Saúde. 2008; 7(3):367-72. 12. Felson DT, Anderson JJ, Naimark A, Walker AM, Meenan RF. Obesity and
knee osteoarthritis. Ann Intern Med. 1988; 109(1):18–24, http://dx.doi.org/ 10.7326/0003-4819-109-1-18.
13. Hochberg MC, Lethbridge-Cejku M, Scott WW Jr, Reichle R, Plato CC, Tobin JD. The association of body weight, body fatness and body fat distribution with osteoarthritis of the knee: data from the Baltimore longitudinal study of aging. J Rheumatol. 1995;22 (3):488-93.
14. Messier SP, Ettinger Jr WH, Doyle TE, Morgan T, James MK, O’Toole ML, et al. Obesity: effects on gait in an osteoarthritic population. J Appl Bio-mech. 2010;12(2):161–72.
15. Vela SA, Lavery LA, Armstrong DG, Anaim AA. The effect of increased weight on peak pressures: implications for obesity and diabetic foot pathology. J Foot Ankle Surg. 1998;37(5):416-20; discussion 448-9, http://dx.doi.org/10.1016/S1067-2516(98)80051-3.
16. de Souza SA, Faintuch J, Valezi AC, Sant’Anna AF, Gama-Rodrigues JJ, de Batista Fonseca IC, et al. Gait Cinematic Analysis in Morbidly Obese Patients. Obes Surg. 2005;15(9):1238-42, http://dx.doi.org/10.1381/ 096089205774512627.
17. Lai PP, Leung AK, Li AN, Zhang M. Three-dimensional gait analysis of obese adults. Clin Biomech (Bristol, Avon). 2008;23 Suppl 1:S2-6, http://dx.doi.org/10.1016/j.clinbiomech.2008.02.004.
18. Kral JG. Surgical treatment of obesity. In: Bray GA, Bouchard C, W. James PT. Handbook of obesity. New York: Marcel Dekker. 1998. 977-93. 19. Hortobágyi T, Herring C, Pories WJ, Rider P, Devita P. Massive weight
loss-induced mechanical plasticity in obese gait. J Appl Physiol (1985). 2011;111(5):1391-9.
20. Vartiainen P, Bragge T, Lyytinen T, Hakkarainen M, Karjalainen PA, Arokoski JP, et al. Kinematic and kinetic changes in obese gait in bariatric surgery-induced weight loss. J Biomech. 2012;45(10):1769-74, http://dx.doi.org/ 10.1016/j.jbiomech.2012.05.002.
21. Giacomozzi C, Stebbins J, Leardini A. Anatomical plantar pressure masking and foot models: potential for integration with marker position systems. J Foot Ankle Res. 2012;5(Suppl 1):O29, http://dx.doi.org/ 10.1186/1757-1146-5-S1-O29.
22. Vianna DL, D’Andréa Greve JM. Relac¸ão entre a mobilidade do tornozelo e pé e a magnitude da forc¸a vertical de reac¸ão do solo. Rev Bras Fisioter. São Carlos. 2006;10(3):339-45.
Table 5-Descriptive statistics for the double-support time (s) at the initial and final (six months after surgery) evaluations at 1 km/h and 3 km/h.
Speed Evaluation Average SD Minimum Maximum p
1 km/h Initial 0.4 0.1 0.22 0.54 0.434
6 months 0.38 0.1 0.18 0.58
3 km/h Initial *0.13 0.02 0.1 0.16 0.003
6 months *0.11 0.02 0.08 0.16