Investigating Changes in Land Use Cover and
Associated Environmental Parameters in
Taihu Lake in Recent Decades Using Remote
Sensing and Geochemistry
Changchun Huang1,2,3,4☯, Hao Yang2,3‡, Yunmei Li1,2, Jun Zou2☯, YiMing Zhang2*, Xia Chen2, Yin Mi2‡, Mingli Zhang2
1Jiangsu Center for Collaborative Innovation in Geographical Information Resource Development and Application, Nanjing Normal University, Nanjing, Jiangsu, China,2School of geography science, Nanjing Normal University, Nanjing, Jiangsu, China,3Jiangsu Provincial Key Laboratory of Materials Cycling and Pollution Control, Nanjing Normal University, Nanjing, Jiangsu, China,4Key Laboratory of Virtual Geographic Environment (Nanjing Normal University), Ministry of Education, Nanjing, Jiangsu, China
☯These authors contributed equally to this work.
‡These authors also contributed equally to this work. *[email protected]
Abstract
Humans have had a significant impact on the terrestrial pedosphere through activities such as agriculture and urbanization. The effects of human activities on land use and the related environmental changes were investigated through point and areal studies surrounding Mei-liang Bay, which is an open area of extreme eutrophication in Taihu Lake, China. This study used remote sensing and environmental-tracer profiles [total nitrogen (TN), total phosphorus (TP), total organic carbon (TOC), grain size, and geochemical parameters] to determine the causes of changes in land use and the associated environmental parameters. The results of LUCCs (Land use/cover changes) indicate that over the past three decades, total farmland decreased by 862.49 km2, with an annual decrement rate of 28.75 km2/year, and total urban-ized land increased by 859.71 km2, with an annual growth rate of 28.66 km2/year. The geo-chemical results indicate that the trophic state of Taihu Lake was persistently intensifying and that the TN, TP, and TOC concentrations increased twofold, threefold, and twofold, re-spectively, from 1949 to 2010. The sources of TN, TP, and TOC were highly similar after 1975. However, before 1974, TN and TP originated from different sources than TOC. The grassland and woodland around the lake retain nutrients and sand from the land of study area. The increase in urbanized land and tertiary industries significantly increased the sedi-ment concentrations of TN, TP, and TOC after 1980.
OPEN ACCESS
Citation:Huang C, Yang H, Li Y, Zou J, Zhang Y, Chen X, et al. (2015) Investigating Changes in Land Use Cover and Associated Environmental Parameters in Taihu Lake in Recent Decades Using Remote Sensing and Geochemistry. PLoS ONE 10(4): e0120319. doi:10.1371/journal.pone.0120319
Academic Editor:Dafeng Hui, Tennessee State University, UNITED STATES
Received:November 21, 2014
Accepted:February 5, 2015
Published:April 21, 2015
Copyright:© 2015 Huang et al. This is an open access article distributed under the terms of the
Creative Commons Attribution License, which permits unrestricted use, distribution, and reproduction in any medium, provided the original author and source are credited.
Data Availability Statement:All relevant data are within the paper.
Introduction
The impact of human activities on the terrestrial pedosphere has increased considerably over the past two centuries [1,2]. Worldwide, approximately 4.7 million km2of grassland and 6 mil-lion km2of woodland have been converted to agricultural and urbanized land since 1850 [3,4]. Land provides essential resources for life as well as production for humans; however, land use and cover changes (LUCCs) have become a primary driver of biodiversity loss, climate change, species invasion, and environmental change [5–8]. LUCCs also alter the land’s net radiation and sensible and latent heat ratios by modifying the reflectance of the land surface [5,9]. De-creases in humidity and precipitation due to increased radiation reduce the regeneration ability of forests [10–13]. Soil and water quality are significantly affected by LUCCs as well because different land use types have different sewage purification and production capacities, water consumption rates, and storage capacities. The impacts of LUCCs on the soil and water are manifested in soil erosion, degeneration of soil physicochemical properties, water cycles, and pollution [14–18]. LUCCs alter the nutrients and carbon cycles in the soil and water [19–21]. Thus, natural vegetation and soil systems have considerably greater nutrient cycling abilities than manmade agricultural systems [22]. Forests typically have considerably smaller nitrogen and phosphorus losses than other land types [23,24]. As the ultimate store of sand and nutri-ents lost from land surface, the sedimentary core contains large information of environmental changes [25–28]. The records of sedimentary core can animatedly reproduce the human activi-ty, hypoxia, eutrophication of Lake and environmental change [27,29–31]. Consequently, the records of environmental change surround the sedimentary core can be found in the sediment.
In economically developed regions, large quantities of nutrients are released into aquatic ecosystems from the surrounding land [32]. However, the high frequency of LUCCs in these regions requires high-time-resolution monitoring tools. Remote sensing is a powerful and es-sential tool for monitoring LUCCs because it facilitates observations over a larger area and at a higher frequency than ground-based observations [33–35]. Satellite images can also be used to track historical LUCC information (the Landsat satellite data can be traced back to 1972) [8]. Lake sediments record information on the evolution of the environment [36–38]. Satellite im-agery and sediment core data were determined to be superior tools for studying the impact of LUCCs on the environment.
The goal of this study is to explore the effects of human activities and LUCCs on environ-mental changes by 1) analyzing changes in land use and environenviron-mental parameters around Meiliang Bay (Taihu Lake, China) using Landsat imagery (TM/ETM+) and sediment core data (total organic carbon (TOC), total nitrogen (TN), and total phosphorus (TP)) and 2) quantify-ing the spatial and temporal patterns of land use changes in this area between 1980 and 2010.
Material and Methods
2.1 Ethics statement
The field investigation site is located at the south of Wuxi city (population: 6.95 million). No specific protected water, land areas or plant/animal species were issued from either the govern-ment or relevant authorities. No specific permits were required for the described field studies, and the work did not involve any endangered or protected species.
2.2 Study area
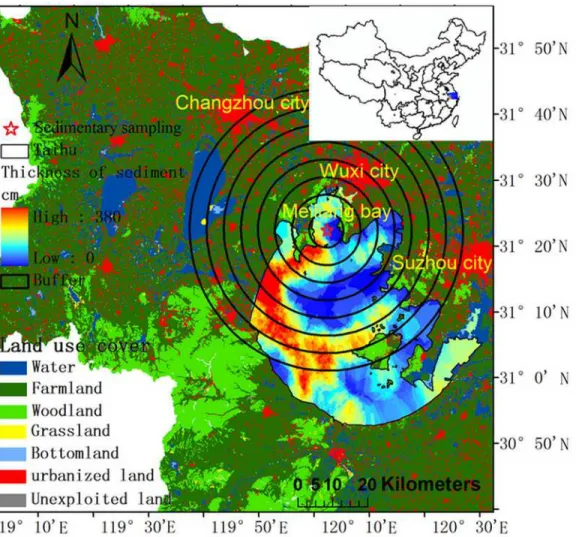
Taihu Lake is a well-known shallow inland lake in the Yangtze River delta;Fig 1presents the location of the study area in China. The key issues in Taihu Lake are hyper-eutrophication and algal blooms [39,40]. The total nitrogen concentration increased from 0.9 to 2.18 mg/L
between 1981 and 2009. The total phosphorus concentration increased from 0.04 to 0.075 mg/ L between 1987 and 2009. The TN and TP concentrations in Meiliang Bay are considerably higher than those in Taihu Lake. For instance, the mean TP concentration in Meiliang Bay (0.13mg/L) is higher than that in Lake Taihu (0.07 mg/L), and the mean TN concentration in Meiliang Bay (2.35 mg/L) is higher than that in Lake Taihu (2.21 mg/L) [41].
2.3 Data and methods
I. data collection. Four sedimentary cores were collected from Taihu Lake in October
2012. A gravity-type columnar sediment sampler was used to collect the columnar sediment. The sediment samples were frozen at—50°C for 48 h, cut into 0.5 cm-thick slices (depth of sedi-ment is 30 cm), and dried in a lyophilizer. The TP and TN concentrations of the dry sedisedi-ment samples were measured with a UV-3600 spectrophotometer (Shimadzu Corp., Japan), the TOC concentration of the samples was measured with a TOC analyzer (Shimadzu Corp., Japan), and sedimentary grain size was measured by Mastersizer (Mastersizer 2000, Britain). The210Pb,
226Ra and137Cs isotopes were measured with a Gamma Spectrometer (ORTEC., USA).
Fig 1. Study area.The auxiliary chart in the top right corner shows the location of the study area in China. The background image of the land surrounding Taihu Lake shows the land use cover in 2000. The background of Taihu Lake provides the distribution of the sedimentary thickness. The black point is the monthly water quality monitoring site. The red pentagram is the sediment sampling point. The buffer of sediment includes 8 regions, with the radius of each buffer ranging from 5 to 40km at 5km intervals.
Landsat (TM/ETM+) images with a spatial resolution of 30 m were used to obtain land use cover data from 1980 to 2010. The time phases of land use cover data include 1980, 1995, 2000, 2005, 2008, and 2010. The Landsat images for each time phase were geo-referenced according to the match up geographic coordinates (geometric correction). All geo-referenced images for each time phase were corrected by quick atmospheric correction module before classification. The classification method is a combination method of artificial visual interpretation and com-puter intelligence interactive interpretation (SVM: support vector machine). The Landsat im-ages were interpretated by computer intelligence interactive interpretation firstly, and then artificial visual interpretation and correction were used to correct the classification results from computer intelligence interactive interpretation. The finally classification accuracy was guaran-teed with 90%.
The weather and statistical data for the city of Wuxi were chosen for this study because most of the study area is in this city (the coverage percentages of Wuxi, Suzhou, and Chang-zhou are 70%, 20%, and 10%, respectively). Information on the population, domestic water usage, and industrial water usage was obtained from the Wuxi statistical yearbook. The weather data (precipitation) for Wuxi from 1955 to 2010 were downloaded from the China Meteorolog-ical Data Sharing Service System (http://cdc.cma.gov.cn/).
II. Methods. Among of four sediment cores, only the sediment core in Meiliang Bay
satis-fies the condition of geochronology by210Pb radiometric technique (constant rate of supply, CRS) [42,43]. The sediment core was dated using the activity of unsupported210Pb (210Pbex)
radiometric technique based on the method suggested by Mizugakia [42]. The210Pbexwas
cal-culated by subtract the226Ra from210Pb. The time estimated by the210Pbexradiometric
tech-nique was calibrated by137Cs, which has significant peaks in the years 1963 and 1986. Specific historical data in hydrology and meteorology (flooding and strong rainfall) were used to cor-rect the geochronology estimated by210Pbexas well. The geochronology of this sediment core
is from 1902 to 2010.
The study area (Meiliang Bay) is an open basin with densely covered river network. Thus it’s hard to discuss the influence of land use cover change on the environmental changing due to the fragmentized drainage basin. Enlightened by land-use regression model [44–46], we chose this sediment core and established 8 buffers surrounding this sediment core (Fig 1) to an-alyze the effect of LUCCs to environmental changes based on the spatial correlation
of geography.
The deposition rate (cm/a) is calculated from the depth and geochronology.
deposition rate¼ ðZ2 Z1Þ=½geochronologyðZ1Þ geochronologyðZ2Þ
where, Z1 and Z2 is the sedimentary depth, geochronology(Z1) and geochronology(Z2) are the date for the depth of Z1 and Z2.
Results
3.1 Land use and cover change from 1980 to 2010 around the sediment
sampling sites
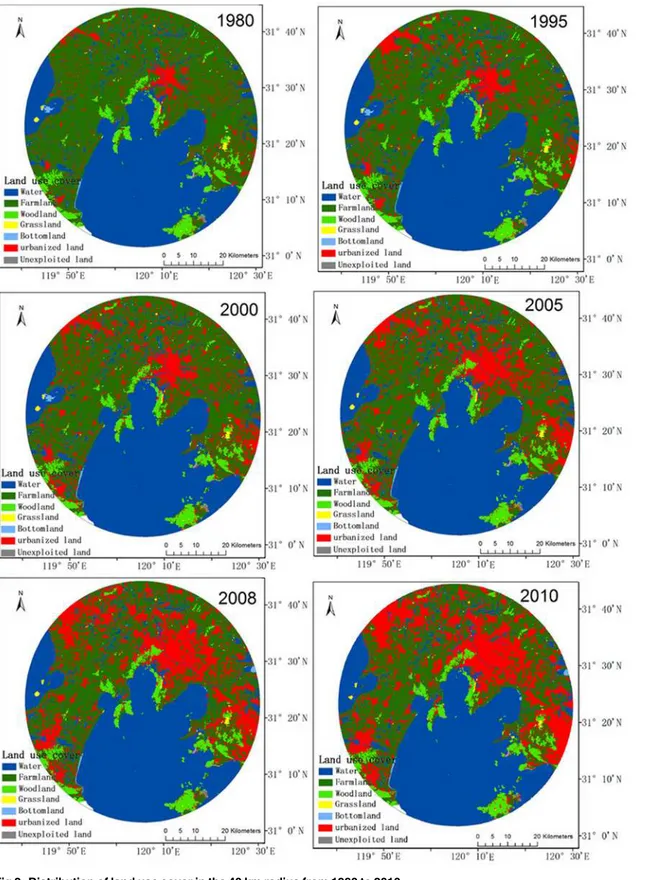
The decreased farmland (872.75 km2) was mainly converted to urbanized land (834.12 km2), water (24.09 km2), and woodland (14.23 km2). Farmland only increased by 10.25 km2. The in-crease in farmland (10.25 km2) resulted from the conversion of woodland (1.79 km2), grassland (0.1 km2), water (2.19 km2), and urbanized land (6.17 km2). Woodland and grassland de-creased by an average of 4.98 and 2.99 km2/year, respectively. Water and unexploited land in-creased by an average of 9.56 and 1.19 km2/year, respectively. New urbanized land is mainly converted from farmland. The increase in unexploited land is mainly due to the
urbanization process.
The distribution of land use also shows that the urbanization is a process of farmland occu-pation (Fig 2). The pace of urbanization in this study area has been rapid, especially after 2005. Thus, the LUCCs mainly indicate a decrease in farmland and increase in urbanized land as well as a decrease in grassland within buffers of 30, 35, and 40 km.
3.2 Distribution of total organic carbon, total nitrogen, and total nitrogen
in the sedimentary cores
Sedimentary cores contain a considerable amount of information on environmental changes.
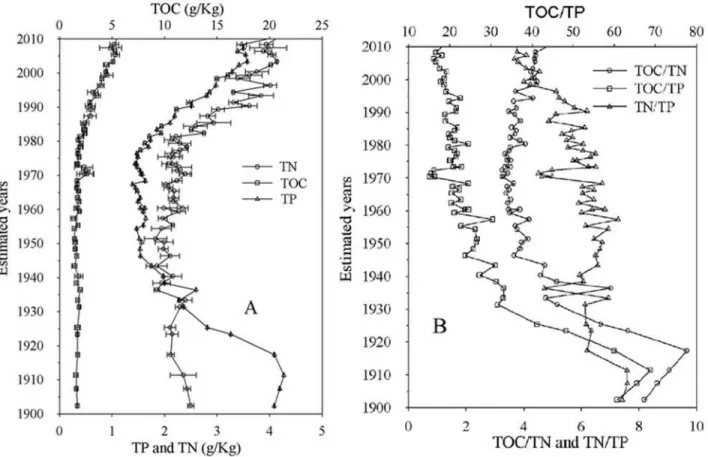
Fig 3Apresents the distribution of TN, TP, and TOC over the study period. TP exhibited an in-creasing trend after 1975, and the growth rate of TP increased from 1975 to 2010. A peak value of TP was observed around 1972. TP was nearly constant before 1970. Sedimentary TP in-creased threefold from 1900 to 2010 (from 0.4 to 1.2μg/mg). TN exhibited a decreasing trend between 1900 and 1945, a fluctuating trend between 1945 and 1975, and an increasing trend after 1975. Sedimentary TN decreased twofold from 1900 to 1945 (from 4.1 to 1.97μg/mg) and increased twofold from 1975 to 2010 (from 2.1 to 4.3μg/mg). TOC exhibited an increasing trend with fluctuations between 1900 and 2010. Sedimentary TOC increased approximately threefold from 1900 to 2010 (from 7.1 to 21.6μg/mg).
The ratio of TOC and TP (TOC/TP) exhibited a decreasing trend after 1910 and an increas-ing trend before 1910. TOC/TP decreased fourfold from 1910 to 2010 (from 68.7 to 17.8). The ratio of TOC and TN (TOC/TN) decreased approximately threefold from 1900 to 1979 (from
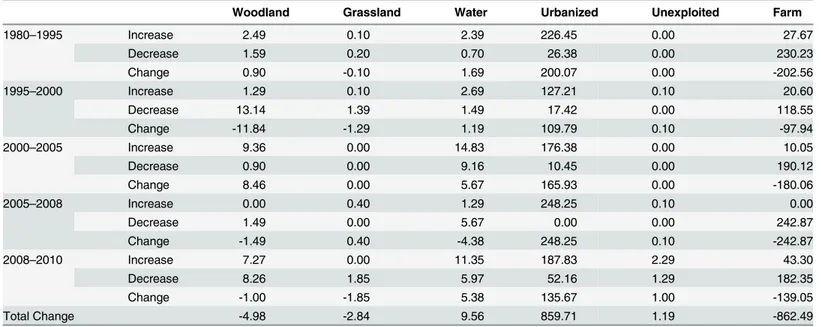
Table 1. Land use change in the 40 km buffer between 1980 and 2010 (km2).
Woodland Grassland Water Urbanized Unexploited Farm
1980–1995 Increase 2.49 0.10 2.39 226.45 0.00 27.67
Decrease 1.59 0.20 0.70 26.38 0.00 230.23
Change 0.90 -0.10 1.69 200.07 0.00 -202.56
1995–2000 Increase 1.29 0.10 2.69 127.21 0.10 20.60
Decrease 13.14 1.39 1.49 17.42 0.00 118.55
Change -11.84 -1.29 1.19 109.79 0.10 -97.94
2000–2005 Increase 9.36 0.00 14.83 176.38 0.00 10.05
Decrease 0.90 0.00 9.16 10.45 0.00 190.12
Change 8.46 0.00 5.67 165.93 0.00 -180.06
2005–2008 Increase 0.00 0.40 1.29 248.25 0.10 0.00
Decrease 1.49 0.00 5.67 0.00 0.00 242.87
Change -1.49 0.40 -4.38 248.25 0.10 -242.87
2008–2010 Increase 7.27 0.00 11.35 187.83 2.29 43.30
Decrease 8.26 1.85 5.97 52.16 1.29 182.35
Change -1.00 -1.85 5.38 135.67 1.00 -139.05
Total Change -4.98 -2.84 9.56 859.71 1.19 -862.49
Fig 2. Distribution of land use cover in the 40 km radius from 1980 to 2010.
9.6 to 3.4) and increased approximately twofold from 1980 to 2010 (from 3.4 to 5.3). The ratio of TN and TP (TN/TP) exhibited a fluctuating trend before 1990 and a decreasing trend after 1990.
3.3 Distribution of sedimentary grain size and deposition rate
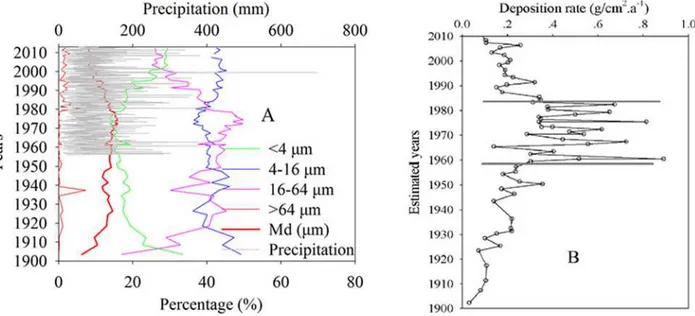
Fig 4Apresents the sedimentary grain size, which was separated into clay (<4μm), fine-grained sand (4–16μm), coarse-grained sand (16–64μm), and sand (>64μm) according to the Udden-Wentworth scale. The percentage of clay decreased from 32.7% to 15.9% between 1900 and 1948, increased from 17.2% to 29.5% between 1976 and 2010, and maintained a stable trend between 1949 and 1979 (mean value of 15.5%). The percentage of fine-grained sand decreased slightly from 43.6% to 36.5% between 1900 and 1972 and slightly increased from 36.5% to 42.6% between 1972 and 2010. The mean percentage of fine-grained sand from 1900 to 2010 was 41.2%. The percentage of coarse-grained sand increased threefold (from 17.1% to 49.8%) from 1900 to 1973 and decreased from 49.8% to 25.9% between 1973 and 2010. The percentage of sand was less than 1% from 1900 to 1979, except in 1931, when a catastrophic flood in-creased the percentage of sand to 7.3%. The percentage of sand exceeded 1% from 1979 to 2010, with a mean value of 1.6%. The maximum percentage of sand in that time period oc-curred in 1981 (5.9%), which was caused by another catastrophic flood. The sedimentary depo-sition rate exhibited an increasing trend from 1900 to 1960 (from 0.02 to 0.89 g/cm2a-1), reached a maximum range between 1960 and 1980 (mean value is 0.48 g/cm2a-1), and then de-creased to 0.08 g/cm2a-1in 2011.
Fig 3. Distribution of soil constituents in the sediment core.Chart A shows the distribution of TN, TP, and TOC in the different layers of the sediment, which was dated by210Pb. Chart B shows the distribution of the ratios of TN, TP, and TOC in the different layers of the sediment.
Discussion
4.1 Influence of land use and cover changes on environmental changes
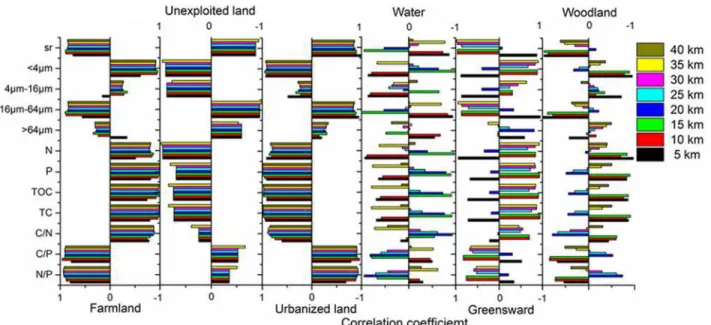
LUCCs change not only the landscapes in which human live but also the climate, biodiversity, and the eco-environment [47–49]. The LUCCs have a significant effect on environmental changes from the correlation analysis between LUCCs and environmental indices (Fig 5). TN, TP and TOC have highly negative correlations with farmland for all buffers, indicating that more TN, TP and TOC will input to the lake during the transformation process of farmland to other land use types (Table 1andFig 3A). Unexploited and urbanized lands may be the main contributors to TN, TP, and TOC for all buffers because they displayed high positive correla-tions. The correlations of woodland and grassland with TN, TP, and TOC rely heavily on the buffer radius. Grassland is negatively correlated with TN, TP, and TOC within the 5 km buffer and positively correlated with these parameters within the 10–35 km buffers. Woodland is pos-itively correlated with TN, TP, and TOC within the 5–15 km buffers and has almost no correla-tion with TN, TP, and TOC within the 20–40 km buffers. The possible explanacorrela-tions for these observations are that the grassland nearby the sedimentary core plays a retaining role for the nutrients, but the grassland far from the sedimentary core is a source of nutrients for the artifi-cial cultivation. The woodland in the buffers is mainly landscaped woodland, which with low capacity of soil and water conservation relative to the wildwood [18,50]. Sometimes, in order to keep the growth of landscape trees, lots of fertilizer may be applied.
Clay (<4μm) mainly originates from unexploited and urbanized land, whereas fine-grained sand (4–16μm) mainly originates from unexploited land and coarse-grained sand (16–64μm) mainly originates from farmland. Grassland and woodland can play positive roles in soil conservation.
The TN output from farmland was considerably higher than that from urbanized land, and the output difference of TN between farmland and urbanized land increased over time (agricul-ture ranged from 43,037 t to 59,674 t and urbanized land ranged from 32,492 t to 36,954 t in 1994 and 1998) [41]. The TP output from farmland was considerably lower than that from
Fig 4. Chart A is the distribution of sedimentary grain size for the different size ranges, the bold red line is the median diameter. Chart B is the distribution of the deposition rate calculated by sedimentary quality depth, density, and date.
urbanized land (agriculture ranged from 1,385 t to 4,625 t and urbanized land ranged from 3,985 t to 7,742 t in 1994 and 1998) [41]. The decrease in farmland should reduce the concen-tration of TN in sediment because farmland can produce large quantities of TN from underuti-lized fertilizer. The decreasing fertilizer use from 2000 to 2012 (114311 ton decreased to 59738 ton) (from agricultural statistics) should reduce the concentration of TN in sediment further. However, this trend was not observed (Fig 3).
4.2 Effect of changes in demographic structure on environmental
changes
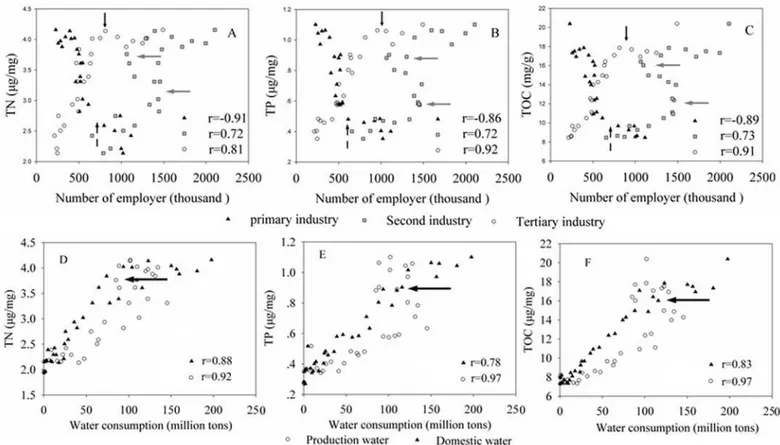
As the economy develops and farmland is lost, farmers become migrant workers. Thus, the population, influenced by the LUCCs, can change the various industry clusters (primary, sec-ond, and tertiary industries), which is considered another influencing factor to the TN, TP, and TOC.Fig 6presents the TN, TP and TOC changes with changes of population in the primary, secondary, and tertiary industries from 1978 to 2010. TN, TP, and TOC increased as the farm-ers gradually became migrant workfarm-ers and other types of workfarm-ers, particularly after 1985 (the dotted arrow points to the sampling location in Fig6A–6C). TN, TP, and TOC increased sig-nificantly with the growth of the tertiary industry population before 2002 (black bold arrow points to the sampling location in Fig6A–6C). The influence of secondary industry on the con-centrations of TN, TP, and TOC exhibited an increasing trend with two inflection points in the years 1991 and 2002 (two gray arrows point to the sampling location in Fig6A–6C). This may be due to the following two reasons. First, a large group of workers was laid-off during the peri-od of the early 1990s to 2000. Second, as part of a water diversion project, water was diverted from the Yangtze River to Taihu Lake to wash the lake.
With the development of industry and urbanization, the amount of pollution entering the rivers and lake has increased and is associated with the rapid increase in water requirement and wastewater discharge. The concentrations of TN, TP, and TOC grew significantly with the increase in domestic water usage. However, the growth rate of TN and TOC decreased after
Fig 5. Pearson correlation coefficients between LUCCs and the environmental indices.Six years were included in the correlation analyses, namely, 1980, 1995, 2000, 2005, 2008, and 2010, and sr is the median diameter.
2002. The influence of water production on TN, TP, and TOC was clear before 2002, but this influence weakened after 2002 (black arrow points to the sampling in Fig6D–6F).This trend indicates that domestic wastewater may be the main source of TN, TP, and TOC in the study area. The government should prioritize the treatment of domestic wastewater when the indus-trial wastewater is well under control.
4.3 Effect of human activities on environmental changes
The median diameter of the sediment can be used to indicate the human activities, precipita-tion, and hydrodynamic energy during the deposition process [51]. The low changing rate of the Taihu Lake area indicates low hydrodynamic energy [52]. Human activities and precipita-tion are the main influencing factors for the distribuprecipita-tion of the median diameter in Meiliang Bay. The distribution of the median diameter should be divided into two parts, namely, before and after the completion of hydraulic engineering surrounding Taihu Lake, because the hy-draulic engineering has significantly affected the distribution of the median diameter (Fig 4A
bold red line and gray line). The hydraulic engineering projects in the Taihu Basin area were completed during the 1990s. The median diameter exhibited an increasing trend from 1900 to 1930 (from 6.32 to 13.18μm) before decreasing to 11.51μm in 1945, possibly due to the war with Japan and Chinese Civil War. The median diameter increased steadily from 1949 to 1978 with a mean value of 14.59μm, possibly due to advancements from the Cultural Revolution. Fig 6. Relationships of environmental indices, population and water.The environmental indices include TN, TP, and TOC, and the population includes employees in the primary, secondary, and tertiary industries, the water includes the production and domestic water.
The median diameter then decreased continuously after 1978, possibly due to the implementa-tion of reform and open policy and the recession of agricultural activities.
TOC/TN is a good indicator of the sources of sedimentary organic matter [53,54]. The de-composition of organic matter increases the nitrogen and phosphorus contents and decreases the carbon content [55,56]. Organic matter that can break down easily (e.g., phytoplankton) has a low TOC/TN ratio. Organic matter that cannot break down easily (e.g., terrestrial higher plants) has a high TOC/TN ratio and is highly resistant to degradation [57,58]. The TOC/TN ratio in this study indicated that the sedimentary organic material in Meiliang Bay is produced by both planktonic and terrestrial organic matter. The terrestrial organic matter in this study mainly originates from agriculture (e.g., rice, legumes and wheat cultivation, excreta of live-stock). The decrease in TOC/TN before 1950 may indicate a decrease in human activities, such as the abandonment of agriculture. The steady trend of TOC/TN from 1951 to 1979 may indi-cate that the human activities were relatively stable. The increase in TOC/TN since 1979 may indicate an intensification of human activities, such as the urbanization process (Fig 3B).
Rainfall, vegetation, and other influencing factors affect the deposition rate in inland lakes [59]. However, several studies have shown that deposition rates significantly increased in re-sponse to the soil erosion induced by intensive agricultural and urbanized processes [60–63]. The increase in deposition rates from 1900 to 1960 (from 0.02 to 0.89 g/cm2a-1) may demon-strate the reconstruction of the nation after a long war. The maximum range in the deposition rates from 1960 to 1980 may indicate intensive agriculture and construction without improved hydraulic engineering. The decrease in deposition rates after 1980 may indicate a decrease in ag-ricultural activities and improvements in hydraulic engineering (Fig 4B). The increased deposi-tion rates also allow addideposi-tional organic matter to be degraded by anoxic processes because the exposure time of organic matter to dissolved oxygen in the water column is reduced (the low TOC and TOC/TN are marked inFig 3, and the high deposition rates are marked inFig 4B).
4.4 Homology source analyses of total organic carbon, total nitrogen,
and total nitrogen
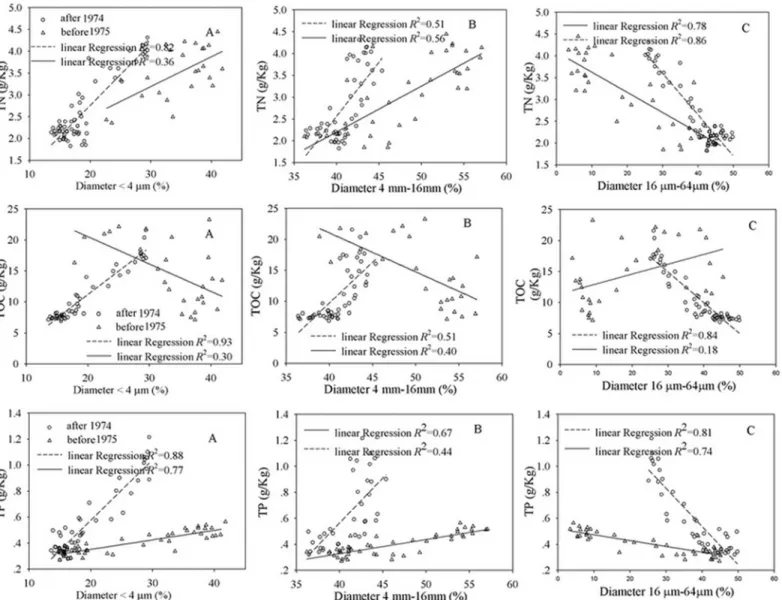
The concentrations of TN, TP, and TOC increase with decreasing grain size because organic matter adsorbs onto mineral surfaces and has a high correlation with clay (<4μm) and fine-grained sediment (4–16μm) (Fig 7). The relationship between grain size and the concentrations of TN, TP, and TOC should be separated into two phases, namely, the period before 1974 and the period after 1975. These two phases correspond to the two periods during the development of China before and after the“reform and opening-up”policy was implemented. The concen-trations of TN, TP, and TOC exhibited high linear correlations with clay and fine-grained sand (Fig 7).The TN and TP exhibited high positive correlations with the clay, indicating that the dynamic carrier of TN and TP is mainly clay. However, the carrying rates (the slopes of linear regression) are different in the two periods. The carrying rates of TN and TP by clay after 1974 were considerably higher than those before 1974. The TOC had a high positive correlation with clay (r = 0.93) after 1975 and almost no correlation with clay before 1974 (r = 0.30), sug-gesting that the TN, TP, and TOC in clay surrounding the Meiliang Bay significantly increased after 1975. TN, TP, and TOC had high negative correlations with the coarse-grained sand, and these correlations should also be separated into phases, namely, after 1975 and before 1974.
coefficient between TP and TOC was 0.04).These correlation analyses indicate that TN, TP, and TOC originated from the same sources after 1975. The intense human activities in the area are likely the main source of TN, TP, and TOC, and the amount of TN, TP, and TOC originating from natural sources (e.g., the decomposition of phytoplankton, terrestrial organic matter and benthic invertebrates) was relatively smaller after 1975. TN and TOC had different sources be-fore 1974, as did TP and TOC. The source of TP was not completely consistent with that of TN, indicating that TN, TP, and TOC originate from both natural sources and human activities, but natural sources may be more dominant than human activities in the future.
Conclusions
The concentrations of TN, TP, and TOC in the sediment increased more than twofold from 1949 to 2010. The trophic state of Meiliang Bay showed a continuous increasing trend. The im-pact of LUCCs on environmental changes was significant. Most farmland was converted to
Fig 7. Relationship between grain size and environmental indices.The environmental indices include TN, TP, and TOC, and the grain size includes clay (<4μm), fine-grained sand (4–16μm), and coarse-grained sand (16–64μm).
urbanized land. The changes in demographic structure induced by LUCCs led to large dis-charges of TN, TP, and TOC into the water. The intense human activities in the area were likely the main source of TN, TP, and TOC, and the amount of TN, TP, and TOC originating from natural sources (e.g., the decomposition of phytoplankton, terrestrial organic matter and ben-thic invertebrates) was relatively smaller after 1975. TN, TP, and TOC originated from both natural sources and human activities, but natural sources may be more dominant than human activities in the future.
Acknowledgments
We are deeply thankful to the two anonymous reviewers for their very helpful comments. We also appreciate the National R&D Infrastructure and Facility Development Program of China: Data Sharing Infrastructure of Earth System Science (http://nnu.geodata.cn) for sharing the image data.
Author Contributions
Conceived and designed the experiments: HY YL. Performed the experiments: MZ JZ XC. Ana-lyzed the data: YM. Contributed reagents/materials/analysis tools: YMZ. Wrote the paper: CH.
References
1. Sherbinin A. Land-Use and Land-Cover Change, A CIESIN Thematic Guide, Palisades, NY: Center for International Earth Science Information Network of Columbia University. 2002; Available:http:// sedac.ciesin.columbia.edu/tg/guide_frame.jsp?g=47.
2. Lawrence PJ, Feddema JJ, Bonan GB. Simulating the biogeochemical and biogeophysical impacts of transient land cover change and wood harvest in the Community Climate System Model (CCSM4) from 1850 to 2100. J. Clim., 2012; 25: 3071–3095.
3. Lambin EF, Geist HJ. Regional Differences in Tropical Deforestation. Environment: Science and Policy for Sustainable Development, 2003; 45(6):22–36.
4. Lambin EF, Turner BL, Geist HJ, Agbola SB, Angelsen A, Bruce JW, et al. The causes of land-use and land-cover change: moving beyond the myths. Global Environ Change Hum Policy Dim, 2001; 11:261–269
5. Foley JA, DeFries R, Asner GP, Barford C, Bonan G, Carpenter SR. Global consequences of land use. Science, 2005; 309:570–4. PMID:16040698
6. Piao S, Friedlingstein P, Ciais P, Noblet-Ducoudre N, Labat D, Zaehle S. Changes in climate and land use have a larger direct impact than rising CO2 on global river runoff trends. Proc Natl Acad Sci U S A, 2007; 104(39):15242–7. PMID:17878298
7. Pielke SRA. Land use and climate change. Science, 2005; 310: 1625–1625. PMID:16339435 8. Griffiths P, Müller D, Kuemmerle T, Hostert P. Agricultural land change in the Carpathian ecoregion
after the breakdown of socialism and expansion of the European Union. Environ. Res. Lett., 2013; 8,045024.
9. Hua WJ, Chen HS. Impacts of Regional-Scale Land Use/Land Cover Change on Diurnal Temperature Range. Advances in climate change research, 2013; 4(3):166–172.
10. Shukla J, Nobre C, Sellers P. Amazon deforestation and climate change. Science,1990; 247: 1322–
1325
11. Bonan GB, Pollard D, Thompson SL. Effects of boreal forest vegetation on global climate. Nature, 1992; 359:716–718
12. Snyder PK, Delire C, Foley JA. Evaluating the influence of different vegetation biomes on the global cli-mate. Climate Dynamics, 2004; 23(3/4): 279–302
13. Davin EL, de Noblet-Ducoudré N. Climatic impact of global-scale deforestation: Radiative versus non-radiative processes. J Clim., 2010; 23: 97–112.
15. Townsend AR, Howarth RW, Bazzaz FA, Booth MS, Cleveland CC, Collinge SK, et al. Human health effects of a changing global nitrogen cycle. Frontiers in Ecology and the Environment, 2003; 1(5): 240–246
16. Costa MH, Botta A, Cardille JA. Effects of large-scale changes in land cover on the discharge of the To-cantins River, southeastern Amazonia. Journal of Hydrology, 2003; 283(1): 206–217
17. Zhan CS, Xu ZX, Ye AZ, Su HB. LUCC and its impact on run-off yield in the Bai River catchment—
upstream of the Miyun Reservoir basin. J. Plant. Ecol., 2011; 4(1–2): 61–66. doi:10.1093/jpe/rtr003 18. Galford GL, Soares B, Cerri CEP. Prospects for land-use sustainability on the agricultural frontier of the
Brazilian Amazon. Phil. Trans. R. Soc. B-Biological Sciences, 2013; 368, doi:10.1098/rstb.2012.0171 19. Bala G, Caldeira K, Wickett M, Phillips T, Lobell DB, Delire C, et al. Combined climate and carbon-cycle
effects of large scale deforestation. Proceedings of the National Academy of Sciences, 2007; 104: 6550–6555. PMID:17420463
20. Feddema JJ, Oleson KW, Bonan GB, Mearns LO, Buja LE, Meehl GA, et al. The importance of land-cover change in simulating future climates. Science, 2005; 310: 1674–1678. PMID:16339443 21. Hasler N, Werth D, Avissar R. Effects of tropical deforestation on global hydroclimate: A multi-model
en-semble analysis. J.Clim, 2009; 22: 1124–1141.
22. Thomas AD, Walsh RPD, Shakesby RA. Nutrient losses in eroded sediment after fire in eucalyptus and pine forests in the wet Mediterranean environment of northern Portugal. Catena, 1999; 36(4): 283–302 23. Peterjohn WT, Correll DL. Nutrient dynamics in an agricultural watershed: Observations on the role of a
Riparian forest. Ecology, 1984; 65(5): 1466–1475
24. Findlay S, Fischer D. Ecosystem attributes related to tidal wetland effects on water quality. Ecology, 2013; 94(1):117–125. PMID:23600246
25. Wu JL, Lin L, Gagan MK, Schlese GH, Wang SM. Organic matter stable isotope (δ13C,δ15N) re-sponse to historical eutrophication of Lake Taihu, China. 2006; Hydrobiologia, 563: 19–29.
26. Zhang H, Shan B. Historical distribution and parti-tioning of phosphorus in sediments in an agricultural watershed in the Yangtze-Huaihe Region, China. Environ.Sci. Technol., 2008; 42: 2328–2333. PMID: 18504961
27. Dong X, Bennion H, Battarbee R, Yang X, Yang H, Liu E. Tracking eutrophication in Taihu Lake using the diatom record: potential and problems. J. Paleolimnol., 2008; 40: 413–429.
28. Guzmán G, Quinton JN, Nearing MA, Mabit L, Gómez JA. Sediment tracers in water erosion studies: current approaches and challenges, J Soils Sediments, 2013; 13:816–833.
29. Gooday AJ, Jorissen F, Levin LA, Middelburg JJ, Naqvi SWA, Rabalais NN, et al. Historical records of coastal eutrophication-induced hypoxia, Biogeosciences, 2009; 6: 1707–1745.
30. Zhang EL, Liu EF, Jones R, Langdon P, Yang XD, Shen J. A 150-year record of recent changes in human activity and eutrophication of Lake Wushan from the middle reach of the Yangze River, China, J. Limnol., 2010; 69(2): 235–241, doi:10.1016/j.pep.2009.09.022PMID:19815074
31. Berthon V, Marchetto A, Rimet F, Dormia E, Jenny JP, Pignol C, et al. Trophic history of French sub-Alpine lakes over the last ~150 years: phosphorus reconstruction and assessment of taphonomic bi-ases. J. Limnol., 2013; 72(3): 417–429
32. Rabalais NN, Turner RE, Justic D, Diaz RJ. Global change and eutrophication of coastal waters. ICES Journal of Marine Science, 2009; 66: 1528–1537.
33. Xian G, Homer C, Fry J. Updating the 2001 National Land Cover Database land cover classification to 2006 by using Landsat imagery change detection methods. Remote Sens Environ., 2009; 113 (6):1133–47.
34. Matthews MW, Bernard S, Robertson L. An algorithm for detecting trophic status (chlorophyll-a), cyano-bacterial-dominance, surface scums and floating vegetation in inland and coastal waters. Remote Sens Environ., 2012; 124: 637–52.
35. Olofsson P, Foody GM, Stehman SV, Curtis E. Woodcock making better use of accuracy data in land change studies: estimating accuracy and area and quantifying uncertainty using stratified estimation. Remote Sens Environ., 2013; 129:122–31.
36. Rose NL, Boyle JF, Du Y. Sedimentary evidence for changes in the pollution status of Taihu in the Jiangsu region of eastern China. J Paleolimn, 2004; 32(1): 41–51.
37. Schelske CL, Stoermer EF, Kenney WF. Historic low-level phosphorus enrichment in the Great Lakes inferred from biogenic silica accumulation in sediments. Limnol. Oceanogr., 2006; 51(1, part 2):728–748.
39. Wang M, Shi W. Satellite-observed algae bloom in China's Lake Taihu, EOS Trans. AGU, 2008; 89:201–202.
40. Guo L. Doing battle with the green monster of Taihu Lake. Science, 2008; 317: 1166, doi:10.1126/ science.317.5842.1166
41. Qin BQ. Lake Taihu, China, Dynamics and Environmental Change, Springer Science Business Media B.V., 2008; SBN: 978-1-4020-8554-3 and e-ISBN: 978-1-4020-8555-0.
42. Mizugakia S, Nakamura F, Araya T. Using dendrogeomorphology and 137Cs and 210Pb radiochronol-ogy to estimate recent changes in sedimentation rates in Kushiro Mire, Northern Japan, resulting from land use change and river channelization. CATENA, 2006; 68(1):25–40.
43. O’Reilly J, Léon Vintró L, Mitchell PI, Donohue I, Leira M, Hobbs W, et al. 210Pb-dating of a lake sedi-ment core from Lough Carra (Co. Mayo, western Ireland): use of paleolimnological data for chronology validation below the 210Pb dating horizon. Journal of Environmental Radioactivity, 2011; 102: 495–499. doi:10.1016/j.jenvrad.2010.09.003PMID:20947225
44. Wang M, Beelen R, Eeftens M, Meliefste K, Hoek G, Brunekreef B. Systematic evaluation of land use regression models for NO2. Environ. Sci. Technol., 2012; 46: 4481–4489 doi:10.1021/es204183v PMID:22435498
45. Knibbs LD, Hewson MG, Bechle MJ, Marshall JD, Barnett AG. A national satellite-based land-use re-gression model for air pollution exposure assessment in Australia. Environmental Research, 2014; 135: 204–211. doi:10.1016/j.envres.2014.09.011PMID:25282278
46. Zhou W, Ji S, Chen TH, Hou Y, Zhang K. The 2011 heat wave in Greater Houston: Effects of land use on temperature. Environmental Research, 2014; 135:81–87. doi:10.1016/j.envres.2014.08.025PMID: 25262079
47. Vitousek PM, Mooney HA, Lubchenco J, Melillo JM. Human domination of Earth’s ecosystems. Sci-ence, 1997; 277: 494–499. doi:10.1126/science.277.5325.494
48. Tu J, Xia ZG. Examining spatially varying relationships between land use and water quality using geo-graphically weighted regression I: Model design and evaluation. Sci. Total Environ. 2008; 407:358–378, doi:10.1016/j.scitotenv.2008.09.031PMID:18976797
49. Xie HL, Liu ZF, Wang P, Liu GY, Liu FC. Exploring the Mechanisms of Ecological Land Change Based on the Spatial Autoregressive Model: A Case Study of the Poyang Lake Eco-Economic Zone, China. Int J Environ Res Public Health, 2014; 11(1): 583–599. doi:10.3390/ijerph110100583PMID: 24384778
50. Jacobs M. The tropical rain forest. A first encounter. Springer-Verlag, Berlin, 1988; pages 295, ISBN 3-540-17996-8. PMID:17748712
51. Digerfeld G, Olsson S, Sandgren P. Reconstruction of lake-level changes in lake Xinias, central Greece, during the last 40 000 years. Palaeogeography, Palaeoclimatology, Palaeoecology, 2000; 158: 65–82.
52. Yin LQ, Jiang N, Yang YB. Dynamic change of lake Taihu area during the past 15years based on the re-mote sensing technique. Journal of lake sciences, 2005; 17(2):139–142
53. Yu WH, Zang SY, Wu CS, Liu W, Na XD. Analyzing and modeling land use land cover change (LUCC) in the Daqing City, China. Applied Geography, 2011; 31:600–608.
54. Meisel S, Struck U. The potential distortion of sedimentaryδ15N and Corg/N ratios by NH4+ and the ef-fects of pre-analysis sample treatment. Fossil Record, 2011; 14 (2):141–152.
55. Güsewell S, Verhoeven JTA. Litter N:P ratios indicate whether N or P limits the decomposability of gra-minoid leaf litter. Plant and Soil, 2006; 287(1–2):131–143.
56. Bengtsson J, Janion C, Chown SL, Leinaas HP. Variation in decomposition rates in the fynbos biome. South Africa: the role of plant species and plant stoichiometry. Oecologia, 2011; 161 (1): 225–235. 57. Müller A, Mathesius U. The palaeo environment of coastal lagoons in the southern Baltic Sea, The
ap-plication of sedimentary Corg/N ratios as source indicators of organic matter. Palaeogeography Palaeoclimatology Palaeoecology, 1999; 145:1–16.
58. Kendall C, Silva SR, Kelly VJ. Carbon and nitrogen isotopic compositions of particulate organic matter in four large river systems across the United States. Hydrol Process, 2001; 15:1301–1346.
59. Polyakov VO, Lal R. Soil erosion and carbon dynamics under simulated rainfall. Soil Sci., 2004; 169 (8): 590–599.
60. Wilkinson BH, McElroy BJ. The impact of humans on continental erosion and sedimentation. GeolSoc Am Bull., 2007; 119(1–2): 140–156.
62. Nadeu E, Berhe AA, de Vente J, Boix-Fayos C. Erosion, deposition and replacement of soil organic car-bon in Mediterranean catchments: A geomorphological, isotopic and land use change approach. Bio-geosciences, 2012; 9(3): 1099–1111.