formal employment for low income individuals
Danilo Braun Santos
Universidade Federal de São Paulo / Escola Paulista de Política, Economia e Negócios Osasco / SP — Brazil
Alexandre Ribeiro Leichsenring
Universidade de São Paulo / Escola de Artes, Ciências e Humanidades São Paulo / SP — Brazil
Naercio Menezes Filho
Insper Instituto de Ensino e Pesquisa
Universidade de São Paulo / Departamento de Economia São Paulo / SP — Brazil
Wesley Mendes-Da-Silva
Fundação Getulio Vargas / Escola de Administração de Empresas de São Paulo São Paulo / SP — Brazil
his article uses microdata from the Uniied Registry of Social Programs (CadUnico) and the Annual Social Information Report (Rais) to examine the duration of employment for families receiving beneits from the Bolsa Família Program. To achieve this goal, Cox proportional hazard models were used to estimate the job duration for beneiciaries and non-beneiciaries of the program using a database of more than three million people. he indings indicate that the risk of leaving work among beneiciaries of the Bolsa Família Program is 7% to 10% lower than the risk for non-beneiciaries. Parametric models were also adjusted to verify robustness, producing results equivalent to those of the Cox model. In all cases, participation in the program was observed through a covariate that varies over time, extracted directly from the program’s payment records.
Keywords: employment; labor supply; duration analysis; proportional hazard; Bolsa Família.
Os efeitos do Programa Bolsa Família sobre a duração do emprego formal dos indivíduos de baixa renda
Neste artigo utilizamos microdados do Cadastro Único combinados com dados da Relação Anual de Infor-mações Sociais (Rais) para examinar a duração do emprego entre indivíduos de famílias beneiciárias do Programa Bolsa Família. Para tanto, estimamos modelos de riscos proporcionais de Cox para comparar a duração no emprego entre beneiciários e não beneiciários do programa utilizando uma base de dados com mais de três milhões de indivíduos pertencentes a famílias de baixa renda. Os resultados sugerem que o risco de desligamento do emprego para os beneiciários do Programa Bolsa Família é entre 7% a 10% menor do que para os não beneiciários. Modelos paramétricos também foram ajustados para veriicação de robustez, produzindo resultados equivalentes aos do modelo de Cox. Em todos os casos, a participação no programa foi observada por meio de uma covariável variando no tempo, extraída diretamente das folhas de pagamento do programa.
Palavras-chave: emprego; oferta de trabalho; análise de duração; riscos proporcionais; bolsa família.
DOI: http://dx.doi.org/10.1590/0034-7612171851
Article received on November 10, 2016 and accepted on June 27, 2017.
Los efectos del Programa Bolsa Familia sobre la duración del empleo formal de los individuos de bajos ingresos
En este artículo utilizamos microdatos del registro nacional de personas pobres (Cadastro Único) combinados con datos de la Relación Anual de Informaciones Sociales (Rais) para examinar la duración del empleo entre individuos de familias beneiciadas por el Programa Bolsa Família. Por lo tanto, se estima un modelo de riesgos proporcionales de Cox para comparar la duración del empleo entre beneiciarios y no beneiciarios del programa, utilizando una base de datos con más de tres millones de individuos pertenecientes a familias de bajos recursos. Los resultados sugieren que el riesgo de extinción de empleo para los beneiciarios del Programa Bolsa Família es entre un 7% y un 10% inferior a la de los no usuarios. Modelos paramétricos también fueron ajustados para veriicación de robustez, produciendo resultados equivalentes a los del modelo de Cox. En todos los casos, la participación en el programa fue observada a través de una covariable variando en el tiempo, extraída directamente de la nómina del programa.
Palabras clave: empleo; oferta de trabajo; análisis de duración; riesgos proporcionales; Bolsa Familia.
1. INTRODUCTION
According to the International Labor Organization (ILO), work is the fundamental path to climb-ing out of poverty, overcomclimb-ing inequality and social exclusion, and is one of the most direct ways in which economic development can help population well-being. he formal labour market, along with keeping families out of poverty, can also ofer access to rights and warranties for workers, and social security. he precarious position of low income workers in the formal labour market ends up aggravating income volatility and high job turnover, which characterize this portion of the population. Within this context, it is important to understand the participation dynamic of economically vulnerable members of the population in the formal labour market. he accumulation of this type of knowledge may suggest the implementation of reforms to the current social protection system in a way that guarantee the promotion of population well-being and its adequacy to a variety of so-cio-economic realities and stages of life.
It is expected that a program based on monetary transfers may lead to a reduction in employment, since it reduces economic necessity to work (income efect). Associated with this is the fact that pro-grams focused on low income public may discourage formal employment, given that the eligibility criterion based on family income may imply a decrease in the number of employed family members in order to avoid exceeding the established income ceiling. his supposed accommodation has been treated in the literature as work-disincentive efect.
On the other hand, the fact that a cash transfer program is conditioned on school attendance would lead to an increase in the amount of time allocated to school by children and a decrease in time spent on other activities such as work and leisure. Once there is reduction in the time children spend working, adults should supply substitution for this work.
Various empirical strategies can be employed to investigate the efect of a cash transfer program on employment. Ideally, it would be desirable to have an experimental model in which the attribution of the beneit is randomized, or in other words, the treatment is randomly attributed to a fraction of the eligible population (the treatment group). If the selection of the individuals receiving the beneit is random, the treatment and control groups, if suiciently large, should have uniformly similar characteristics. In this case, any diferences observed in the results can be attributed to the efects of participating in this program.
Unfortunately, this context is very rare in social science studies. he eligibility criterion for the
Bolsa Família Program is fundamentally based on family per capita income (as declared in the Federal
Government’s Uniied Registry of Social Programs), which does not correspond to a randomized experimental model. his one is a typical observational study, which requires non-experimental methods. Generally, studies based on these methods use individual data to control for the diferences between treatment and control groups, typically using measures that dependend on a series of ob-servable individual characteristics.
he current study is dedicated to specifying a particular regression model to identify the ef-fect of the Bolsa Família Program on the duration of employment in the formal labour market, an approach that has not yet been explored in publications on this subject. Among other techniques, the characterization of the beneiciary’s status in the program is determined by a covariate that varies over time, making it possible to identify the months that a family was efectively beneitting from the program and the months that it was not. his study also uses a broad data set: i) the Federal Government’s Uniied Registry of Social Programs (CadUnico) managed by the Ministry of Social Development and the Fight against Hunger, considered to be a census of the low income population of Brazil, containing approximately 80 million observations; ii) the Annual Social Information Re-port (Rais), prepared by the Ministry of Labor and Employment, which ofers information about the entire universe of formal workers in Brazil and containing around 50 million observations/year; and iii) the payment records for the Bolsa Família Program (BFP), which include data for every month since its inception in 2004 and cover approximately 21 million families which in 2011 were or had been beneiciaries of the program.
he purpose of this study is therefore to compare the participation of BFP beneiciaries in the formal labour market with non-beneiciaries listed in the Uniied Registry. his article is structured in the following manner: section 2 briely describes the Bolsa Família Program and the employment conditions in Brazil as well as the relevant literature about the subject; section 3 describes the data-base used and the methodology employed: in section 4 the indings of the study are presented and discussed, and conclusions are presented in section 5.
2. FIELD CONTEXT
2.1 THE BOLSA FAMÍLIA PROGRAM
he Bolsa Família Program (BFP) was instituted by the Brazilian federal government through Law
Hunger (MDS), the BFP is a direct cash transfer program that beneits families in poverty or extreme poverty. In 2011, poverty was characterized as family monthly per capita income between R$ 70 and R$ 140, and extreme poverty was characterized as family monthly per capita income of less than R$ 70.
To participate in the program a family needs to be characterized by either extreme poverty, or poverty with the additional requirement of having pregnant or nursing mothers or children between the ages of 0 and 17.
In addition, the program requires at least 85% school attendance from children between six and 15, and younger children have to be taken regularly to health units to keep them up to date with their vaccinations. he conditions and complementary activities associated with the program constitute long-term objectives about the construction of human capital aimed at interrupting the generational transmission of poverty (Britto, 2005; Lindert et al. 2007).
With regard to the impact of cash transfer programs in general, Marshall and Hill (2014) reviewed the literature and observed efects in terms of an increase in school attendance, and consequent in-crease in female labour supply. By directing transfer of resources to the mother, rather than to the father, these programs produce higher levels of well-being for the children, and also contribute to the empowerment of female beneiciaries who take on more relevant role in decision-making of the household (Britto, 2005). he reduction of child labor is also considered consensus for conditional cash transfer programs (De Hoop and Rosati, 2014).
here is also considerable consensus on the positive impact of the Bolsa Família Program on school attendance (Araújo et al., 2010; Oliveira and Soares, 2012; Soares et al., 2010; Chitolina et al., 2016; and Ferro et al., 2010). However, Oliveira and partners (2007) found that the BFP did not impact child vaccination. Since the program has led to greater consciousness about the need to acces public health services for obtaining child immunization, through the conditions imposed, the absence of this impact suggests obstacles on the supply of these services (Soares et al., 2010).
Britto (2005) also points two other collateral efects: i) incentives for the civil registry, since oicial documents are needed for the mothers to collect the beneit; and ii) greater access to the inancial system, since the beneiciaries receive the magnetic card transfers from individual bank accounts., since oicial documents are necessary for mothers to receive the beneit; and ii) greater access to the inancial system, because the beneiciaries receive these transfers through magnetic cards of individual bank accounts.
Oliveira and Soares (2012) compiled a list of various articles that focus on investigating a possible
work-disincentive. he study summarizes results of articles about employment for the population that
beneits from conditional cash transfer programs, based on various national studies. Employment is measured through three prisms: participation in the work force, working hours and eforts to obtain employment. he study concludes that
In addition to Oliveira and Soares (2012), a range of other studies indicate that there is no signif-icant efect of the Bolsa Família on the labor supply of adult relatives, either from the statistical point of view or from the degree of magnitude (Ferro et al., 2010; Chitolina et al., 2016; Foguel and Barros, 2010; Soares, 2012). Most of the indings are related to the reduction of the number of working hours, especially by mothers and women.
Using data from the National Household Survey (PNAD), Tavares (2010) studied the BFP’s efect on employment among mothers, a group that theoretically should be more afected by receiving the beneit, given that they have a greater reserve salary due to domestic care and time dedicated to children.
he author inds an income efect associated with the value of the beneit (the greater the transfer received, the lower the mother’s engagement in the labor market) and a substitution efect (mothers increase their labour supply to compensate the reduction of labour supply by the children, who increases school attendance). his result is in line with Teixeira’s study (2010), which concludes that the beneit values are not large enough to generate an income efect capable of overriding the substitution efect.
he propensity of beneiciaries to transfer their activities to the informal labour market has been analyzed by Barbosa and Corseuil (2014). hey also use PNAD data, but unlike the previous works which use the propensity score matching methodology, they use regression discontinuity analysis and conclude that the program does not afect the decision whether to enter the formal or the informal labour market.
However, De Brauw and partners (2015) found diferent result concluding that, even though there is no efect on the total number of working hours for the household, the program causes a “substantial” reallocation of working hours from the formal to the informal market. hey argue that this change may be induced by the use of income records in the formal market to verify whether the eligibility criterion is being met. Soares and Ribas (2011) found a reduction in the participation in the formal labour market by beneiciaries in large cities and report a decrease in the number of hours worked by beneiciaries in poor areas, even though the beneit tends to encourage greater participation in the formal labour market by other members of the household.
In terms of the efects of cash transfer programs on employment in other Latin American countries, the empirical results are, roughly speaking, similar to those seen in Brazil. he work of Skouias and Di Maro (2008) about the Progresa do México concludes that in general the program does not have a signiicant efect on the participation rate of beneiciaries in the labour market. hey identify exceptions for speciic groups: men between the ages of 35 and 54 signiicantly in-creased their participation, even though of small magnitude, and women between the ages of 45 and 54 reduced their participation at the beginning of the program. On the other hand, it could not be stated that beneiciaries spent more time on leisure activities. Parker and Skouias (2000) present similar results.
Villa (2013) for Ecuador and Colombia indicate an increase in participation in the former and a null efect in the latter.
Finally Cepal (2014), in a survey of studies in a variety of countries such as Argentina, Brazil, Chile, Honduras, Mexico, Nicaragua and Paraguay, did not ind empirical evidence of the existence of disincentives created by these programs in terms of the labor inclusion of the beneiciaries.
2.2 JOB DURATION
From 2000 on, the Brazilian labour market was marked by a net increase in formal employment according to the data from the General Employment and Unemployment Registry (Caged). As il-lustrated in graph 1, during the two year period of 1998-99 more jobs were lost than created in the formal Brazilian economy, with 389 thousand people losing their jobs. However, in the 2000s, net job creation was positive in all years, and improved substantially by the end of the decade. In 2000’s, 658 thousand new formal jobs were created in Brazil, while in 2008 almost 1.5 million jobs were created, and in 2011 almost 1.6 million jobs were created.
GRAPH 1 EVOLUTION OF NET FORMAL JOB CREATION (1998-2011)
2.500.000
2.000.000
1.500.000
1.000.000
500.000
0
–500.000
–1.000.000
1998 1999 2000 2001 2002 2003 2004 2005 2006 2007 2008 2009 2010 2011
Source: Elaborated by the authors based on data from the Ministry of Labor and Employment — General Registry of Employment and Unemployment (Caged).
worker’s characteristics. Jobs of short duration afect retirement for low wage workers, given that they have more diiculty in requesting and proving the beneits that they are entitled to due to time of service, because of constant changes in employment and periods of unemployment or informal employment (Além et al., 1998).
Since retirement beneits are conceded in general based on time of service to people who have had stable jobs or who have rarely changed jobs during their professional lives (Além et al., 1998), the duration of formal employment serves as a measure of the quality of employment which afects the well-being of the worker.
In this respect, Giambiagi and Afonso (2009) emphasize that retirement by age in Brazil has lower average benefits than retirement based on time of contribution. These authors observe that in December 2008 14,453,455 retirement benefits were issued, with 7,500,092 (51.9%) of these being based on age, 2,835,391 (19.6%) based on disability and 4,117,972 (28.5%) based on time of contribution. The average values of the benefits for disability and age were R$ 552.01 and R$ 432.97 respectively, while the average value of benefits based on time of contribution was R$ 1.058.93.
3. METHODOLOGY AND DATABASE DESCRIPTION
he data used in this work comes from three main sources: the Uniied Registry (CadUnico), the Annual Social Information Report (Rais) and the Bolsa Família Program (BFP) payment records.
he CadUnico is an instrument of the Ministry of Social Development and the Fight against Hunger (MDS) which identiies and characterizes low income families, which are understood to be those with a monthly income up to half minimum wage per person or total monthly income of up to three minimum wages. To be eligible for beneits from federal government social programs like the BFP, recipients must be registered in the CadUnico.
RAIS, on the other hand, is an annual data collection instrument, which is the responsibility of the Ministry of Labor and Employment, used in the public management of the labor sector. All companies are required to deliver the Rais declaration, whether they have employees or not, and this includes public and individual companies, administrative bodies directly or indirectly admin-istered by federal, state or municipal governments, foundations and rural employers.
To construct this database, we considered all individuals between the ages of 16 and 65 who were admitted to their jobs in 2008 and were registered in the CadUnico (as of December 2011). For individuals with more than one formal job, we used only the main one (with the largest salary). hese jobs were accompanied for up to four years, using the information from Rais for 2009, 2010 and 2011. For cases in which the job ended for any reason before December 2011, the individual was no longer followed. hus, only one job per individual was followed and re-entries were not observed.
3.1 DESCRIPTIVE ANALYSIS
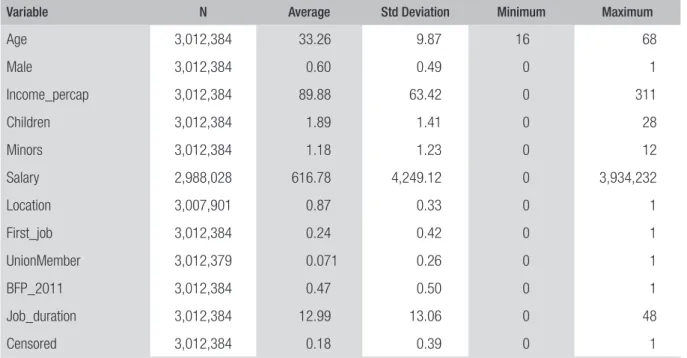
he data for each individual refers to the year in which the job terminated, or 2011 for those cases in which the individual was still employed. As shown in table 1, 60% of the individuals were men, 87% resided in urban areas, for 24% this was their irst job, 7% were union members and 47% were beneiciaries of the BFP in December 2011. he average age was 33 and each worker had an average of 1.89 children, with 1.18 being the average of children under the age of 18. hese individuals remained at the job for 13 months on average and just 18% were still employed on December 2011, and thus these observations are considered censored.
TABLE 1 DESCRIPTIVE STATISTICS FOR QUANTITATIVE AND DICHOTOMOUS VARIABLES
Variable N Average Std Deviation Minimum Maximum
Age 3,012,384 33.26 9.87 16 68
Male 3,012,384 0.60 0.49 0 1
Income_percap 3,012,384 89.88 63.42 0 311
Children 3,012,384 1.89 1.41 0 28
Minors 3,012,384 1.18 1.23 0 12
Salary 2,988,028 616.78 4,249.12 0 3,934,232
Location 3,007,901 0.87 0.33 0 1
First_job 3,012,384 0.24 0.42 0 1
UnionMember 3,012,379 0.071 0.26 0 1
BFP_2011 3,012,384 0.47 0.50 0 1
Job_duration 3,012,384 12.99 13.06 0 48
Censored 3,012,384 0.18 0.39 0 1
Source: Elaborated by the authors.
Note: he data for each individual refers to the year in which the job ended or 2011, if the individual still had this job; Age in years; Male: 1- yes, 0- no; Income_percap indicates family monthly per capita income in Brazilian Reais, self-declared; Children indicates the number of children; minors the number of children under 18 years of age; salary is the average annual salary for the year in which the job ended or 2011, if the individual still had this job, with values corrected by the consumer price index (INPC) for December 2011; Location: 1- urban, 0- rural; First_job: 1- irst job, 0- no; UnionMember: 1- yes, 0- no; BFP_2011: 1- program beneiciary as of December 2011, 0- no; Job_duration indicates the duration of the job in months; Censored: 1- still had this job as of December 2011, 0- didn’t.
respectively. he largest observed salary, close to 4 million reais, suggests that attention should be paid to outliers for this variable as discussed later on in this section. Table 2 presents the descriptive statis-tics for polychotomous category variables. Note that 45% of the jobs were in the country’s Southeast, followed by 23% in the Northeast, 18% in the South, 8.3% in the Central-West and 5.7% in the North.
TABLE 2 DESCRIPTIVE STATISTICS FOR POLYCHOTOMOUS VARIABLES
Variable N Category Average Std-Deviation
Race 2,843,787 White 0.39 0.49
Yellow 0.0027 0.052
Indigenous 0.0034 0.058
Brown 0.51 0.50
Black 0.10 0.29
Education 2,313,213 No Education 0.072 0.26
Incomplete Primary 0.58 0.49
Complete Primary 0.14 0.35
Incomplete Secondary 0.14 0.35
Complete Secondary 0.055 0.23
Incomplete Higher or More 0.0089 0.094
Region 3,012,384 Northeast 0.23 0.42
North 0.057 0.23
Central-West 0.083 0.28
Southeast 0.45 0.50
South 0.18 0.39
Size_city 3,012,384 (0, 10 thou] 0.089 0.29
(10 thou, 100 thou] 0.42 0.49
(100 thou, 1 million] 0.34 0.47
(1 million, +] 0.15 0.36
Size_establishment 3,012,384 (0, 10] 0.16 0.37
(10, 100] 0.35 0.48
(100, 1000] 0.29 0.46
(1000, 10000] 0.17 0.38
(10000, +] 0.018 0.13
Variable N Category Average Std-Deviation
CBO 3,012,384 Farming and Fishing 0.16 0.36
Industry — Generalists 0.33 0.47
Industry — Operators 0.051 0.22
Maintenance & Repair 0.023 0.15
Services, Commerce 0.28 0.45
Administrative Services 0.11 0.32
Mid-Level Technicians 0.030 0.17
Others 0.020 0.14
CNAE 3,012,250 Public Administration 0.037 0.19
Agriculture and Livestock 0.14 0.34
Administrative Activities 0.10 0.31
Vehicle Sales and Repair 0.21 0.41
Contracting 0.13 0.33
Industry 0.20 0.40
Others 0.18 0.38
Reason_failure 2,465,298 Retirement 0.00038 0.019
Death 0.0018 0.042
Term. w. j. c. in. Employee 0.0016 0.040
Term. w. j. c. in. Employer 0.015 0.12
Term. w/o j. c. in. Employee 0.18 0.39
Term. w/o j. c. in. Employer 0.57 0.49
Transfer 0.020 0.14
End of Contract 0.20 0.40
Others 0.00021 0.014
Source: Elaborated by the authors.
Note:Size_city provides the number of inhabitants of the employer city; Size_establishment provides the number of employees at the employer establishment; CBO: Brazilian Occupation Classiication; CNAE: National Classiication of Economic Activity; Reason_failure provides the reason for the job’s ending (failure). Term. w. j.c. in. Employee means termination with just cause initiated by the employee, Term. w. j.c. in. Employer means termination with just cause initiated by the employer, Term. w/o j.c. in. Employee means termination without just cause initiated by the employee, Term. w/o j.c. in. Employer means termination without just cause initiated by the employer.
It should be emphasized, however, that the magnitude of these diferences is very small, except for the variables that are related to the criterion for granting the beneit: per capita income, salary and number of children. As expected, beneiciaries of the program have lower salaries and more children and therefore lower family per capita income. Obviously, it will be important to control for these characteristics when seeking to measure the speciic efect of the BFP on job duration in order to eliminate endogeneity.
TABLE 3 COMPARISON BETWEEN BENEFICIARIES AND NON-BENEFICIARIES OF THE BOLSA FAMÍLIA
PROGRAM
Variable Non-Beneiciary Beneiciary
Age 32.78 33.77***
Male 0.605 0.597***
Income_percap 107.30 70.32***
Children 1.58 2.24***
Minors 0.77 1.64***
Salary 638.25 592.70***
Urban_area 0.869 0.873***
First_job 0.238 0.235***
UnionMember 0.069 0.073***
Job_duration 13.96 11.77***
N 1,592,012 1,420,372
Source: Elaborated by the authors.
Note: Average values of variables for BFP non-beneiciaries and beneiciaries in De-cember 2011. Reference p-value for t-test of diferences between means: ***<0.01.
Some evidence about the work-disincentive efect is suggested by the two months longer job du-ration found for non-beneiciaries. However, this preliminary analysis carries a problem that should be noted: the fact that an individual was a beneiciary of the BFP in December 2011 does not mean that this individual was a beneiciary at the end of his or her job (see table 1 which shows that only 18% of the individuals maintained their jobs until this date).
herefore, the comparison of job duration is not valid given that the allocation of the individu-als in these groups is not random and the job duration variable is censored (that is, the job is only followed until December 2011 and we do not know what happens aterwards) and the participation in the program is analyzed at a ixed moment in time. hus, to achieve a correct speciication, the model will have to overcome these three obstacles.
pro-gram at some point in time, but ater leaving the propro-gram they did not return. Only 6.78% of the sample is comprised of individuals who returned to receive beneits from the program ater having let it at some previous moment.
TABLE 4 BFP ENTRANCE AND EXIT DYNAMICS
Entered and never left 42.53%
Left and never returned 33.06%
Never were BFP beneiciaries 17.64%
Left and later returned 6.78%
Source: Elaborated by the authors.
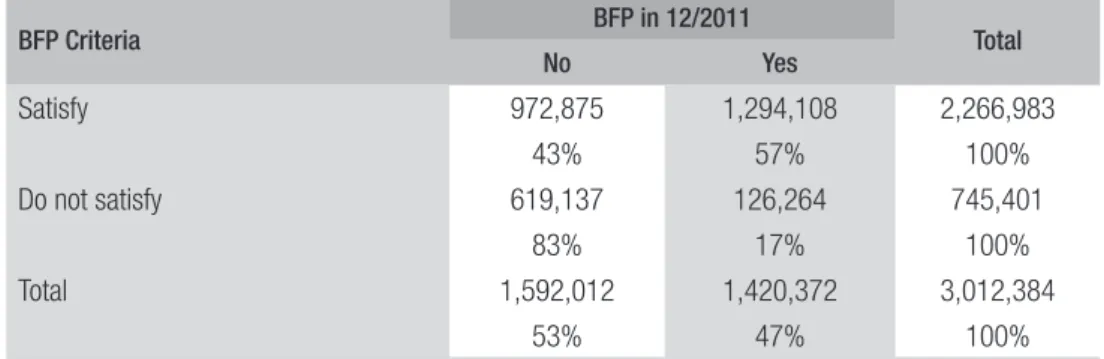
Another relevant question in evaluating the impact of the BFP has to do with the individuals who are considered for the program. Even though the concession of the beneits is based on family per capita income and having pregnant women or children in the family, these facts are not suicient to guarantee staying or even entering the program. Even though a family may be eligible according to the BFP criteria, it must have an updated registration in the CadUnico in order to be considered.
Table 5 corroborates this analysis by showing that, among individuals who satisied the BFP se-lection criteria in December 2011, only 43% received the beneit. he reasons for this can be diverse: receiving the beneit is not immediate ater registration; CadUnico data can be out of date; the family could have been eliminated at some point during the auditing process, or may not have fulilled one of the conditions or may have declared incompatible income.
TABLE 5 CONSIDERED AND ELIGIBLE
BFP Criteria BFP in 12/2011 Total
No Yes
Satisfy 972,875 1,294,108 2,266,983
43% 57% 100%
Do not satisfy 619,137 126,264 745,401
83% 17% 100%
Total 1,592,012 1,420,372 3,012,384
53% 47% 100%
Source: Elaborated by the authors.
We should also remember the fact that family per capita income is self-declared, which means that there can be fraud and families outside the deined scope that are being considered. he MDS seeks to minimize the incidence of these cases through periodic audits in which salaries reported by the Rais database are used to evaluate the trustworthiness of the reported values. However, there is a considerable gap in this process, because the Rais database is made available only two years later. In addition, due to the fact that a large proportion of the Brazilian economy is informal, many of the individuals who have signed up omit the portion of their income that can’t be audited in order to qualify for the beneit (Soares et al., 2010).
he salary reported by the Rais database is provided by the employer rather than the employee. Of the 3 million individuals in the sample, only 97 cases registered a salary above 10 thousand reais, of which 17 were above 50 thousand reais and just 9 above 100 thousand reais. here are three possible explanations for the presence of these observations in the database: i) registration error, which is very probable in the case of a salary of 4 million reais; ii) fraud, given that the CadUnico is self-reported; or iii) individuals who later prospered, because the CadUnico database does not eliminate the indi-viduals who were once registered in the database.
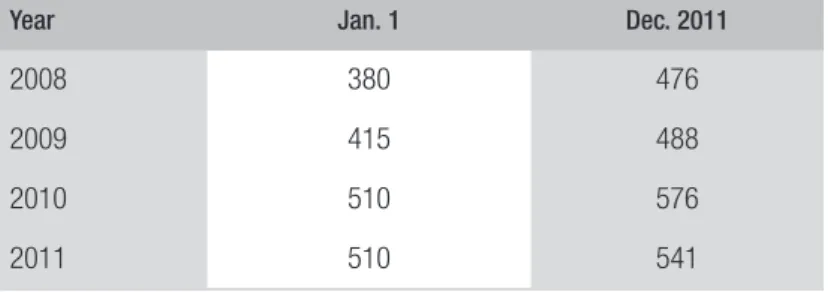
Low salaries have also been observed. Around 790 thousand records had salaries below 450 reais, which is less than the national minimum wage corrected by the consumer price index (INPC) for any of the years considered as shown in table 6. his could be related to registration errors, tempo-rary absences or reduced workdays. Provisional Measure no 2,164-41 of August 24, 2001 governs the regime of part-time employment. Article 58-A, which was incorporated into the Consolidation of Work Laws (CLT), considers part-time employment that which does not exceed 25 hours per week, and its irst paragraph establishes that: “the salary to be paid to employees under a part-time regime will be proportional to the workday performed by workers who perform the same functions in a full-time capacity.”
TABLE 6 BRAZILIAN MONTHLY MINIMUM WAGE (R$ CORRECTED BY THE INPC)
Year Jan. 1 Dec. 2011
2008 380 476
2009 415 488
2010 510 576
2011 510 541
Source: Elaborated by the authors.
TABLE 7 SEPARATION INTO 10 CLASSES OF SALARY
Class Average Class Average
1 202.19 6 587.32
2 373.30 7 649.56
3 450.58 8 734.37
4 497.40 9 868.46
5 539.92 10 1,390.35
Source: Elaborated by the authors.
It should be noted that this ilter, in addition to analyzing only the more homogeneous salaries, disconsiders high salaries and those below the minimum wage.
3.2 SURVIVAL ANALYSIS
Survival analysis is a group of statistical procedures used to analyze data in which the variable of interest is the time until a given event. In the survival nomenclature, when the event occurs, “failure” is said to have been observed. If, on the other hand, the event of interest does not occur during the time under analysis, it is said that the information is “censored.” For this study the analyzed variable is the job duration and the event of interest is the termination (exit) of this job. he job durations for those who remained employed as of December 2011 are censored.
Considering a random variable t, with probability density f(t) and accumulated distribution F(t),
the survival function is deined by
S(t) = 1 – F(t) = P(T > t)
and the hazard function is
h(t) = Δlimt→ 0 P(t ≤ T < tΔ + Δt|T ≥ t) = f(t) = f(t)
t 1 – F(t) S(t)
While the survival function indicates the probability of remaining on the job for longer than a speciic time , the hazard function is a rate that represents the potential of a job to terminate at a determined instant, given that it has lasted up until that date.
collective efects of a group of covariates on job duration. To do this, other methods are needed to incorporate the explanatory variables into the model.
he most common method is called the Cox proportional hazards model. he formula of the hazard function is
h(t,X) = h0(t) e∑pi=1βiXi,
where X= (X1,X2, ... ,Xp) is the vector of explanatory variables and h0(t) is the so-called baseline hazard function, common to all individuals. hus, this model considers that individual characteris-tics determine the hazard for each element in the sample together with a hazard multiple common to all individuals. By not specifying function h0(t), this methodology is called semiparametric. In contrast, parametric models are those in which the functional formula of h0(t) is completely speciied, except for the values of unknown parameters. For example, the Weibull hazard function is given by , where and .
One of the main reasons for the popularity of the Cox model is that even though the baseline hazard function is not speciied, it obtains good estimates of regression coeicients. hat is, the model is robust in the sense that the results of the Cox model are close to results of the correctly speciied parametric model (Kleinbaum and Klein, 2006). It should be noted that the hazard function involves the product of two functions, the baseline hazard (h0(t)), which is a function of but not of X, and the exponential function (), which is a function of X but not of . his is why the X characteristics are called time-invariant.
he hazard function considering covariates that vary over time may be expressed as
h(t,X(t)) = Δlimt→ 0 P(t ≤ T < t + Δt|T ≥ t, X(t + Δt))
Δt
A detailed discussion of the existence of this limit can be found in Lancaster (1992). But, accord-ing to Wooldridge (2010), a suicient condition occurs when X(t) assumes constant values during time intervals such as days, weeks or months. In this study the bfp variable assumes values of 1 (for beneiciaries) or 0 (for non-beneiciaries), for time intervals of at least a month (the period between payments).
he Cox model can be extended for covariates that vary over time:
h(t,X(t)) = h0(t) e∑ip=1βiXi(t).
4. RESULTS
Graph 2 presents the estimated survival and hazard functions for the non-parametric Kaplan-Meier model. he average job duration was 597 days (20 months) with a median value of 424 days (14 months), which indicates that half of the individuals lost or let their jobs ater less than a year and two months of work.
GRAPH 2 KAPLAN-MEIER CURVES
Kaplan-Meier survival estimate
0,00
0,25 0,50 0,75 1,00
0 500 1000 1500
analysis time
,0005 ,001
,0015 ,002
0 500 1000 1500
analysis time Smoothed hazard estimate
(a) Survival Function (b) Hazard Function
Source: Elaborated by the authors.
Graph 3 shows the survival and hazard functions for beneiciaries (bfp=1) and non-beneiciaries (bfp=0) of the BFP. Note that the survival rate of beneiciaries is greater than that of non-beneiciaries. It should be noted that this variable indicates that their presence in the BFP varies over time.
GRAPH 3 KAPLAN-MEIER CURVES FOR BFP BENEFICIARIES AND NON-BENEFICIARIES
Kaplan-Meier survival estimate
0,00
0,25
0,50 0,75 1,00
0 500 1000 1500
analysis time
pbf = 0 pbf = 1
,0005 ,001
,0015 ,002
0 500 1000 1500
analysis time Smoothed hazard estimate
pbf = 0 pbf = 1
(a) Survival Function (b) Hazard Function
In this initial examination related to the Kaplan-Meier curves, the sample used was for all those admitted in 2008 who remained at their jobs through the end of 2011 or were terminated (for just cause or without just cause and by the initiative of the employee or the initiative of the employer) and which had remuneration that falls within salary classes 4 through 7, as shown in table 7. hus the sample included 1,007,315 individuals, of which 771,634 presented failure (termination of employ-ment) and the other 235,681 individuals remained at their jobs until December 2011 (censored data). he Cox model is used to quantify the efect of the time-dependent BFP presence covariate on job duration, controlling for other factors which are time-invariant. According to the discussion conducted in Section 3.2, this constitutes the main result of this article. his speciication manages to overcome the obstacles presented in Section 3.1, because the survival models consider the issue of censure and the BFP entrance and exit dynamics and controls for the diferences between groups in terms of various individual characteristics. he sample size makes it possible to include several controls, which favors our identiication hypothesis: that the control for observable characteristics is suicient to eliminate endogeneity.
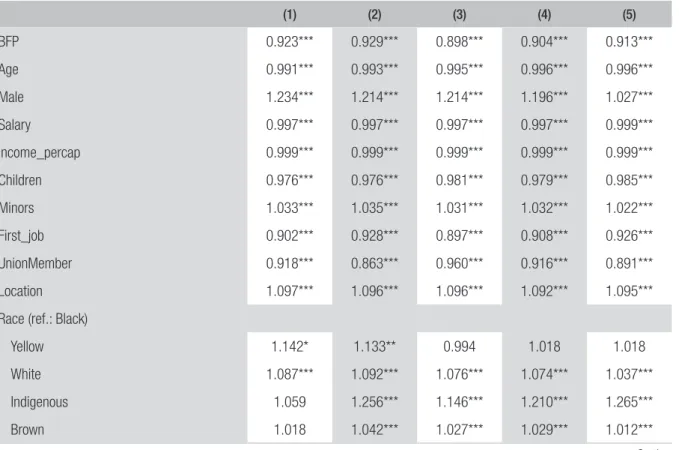
Table 8 presents the estimated hazard ratios for the ive models in which the collected sample was altered. he idea of altering the sample makes it possible to increase the robustness of the results, to the extent that the estimates converge.
TABLE 8 COX HAZARD REGRESSION RATIOS FOR JOB DURATION
(1) (2) (3) (4) (5)
BFP 0.923*** 0.929*** 0.898*** 0.904*** 0.913***
Age 0.991*** 0.993*** 0.995*** 0.996*** 0.996***
Male 1.234*** 1.214*** 1.214*** 1.196*** 1.027***
Salary 0.997*** 0.997*** 0.997*** 0.997*** 0.999***
Income_percap 0.999*** 0.999*** 0.999*** 0.999*** 0.999***
Children 0.976*** 0.976*** 0.981*** 0.979*** 0.985***
Minors 1.033*** 1.035*** 1.031*** 1.032*** 1.022***
First_job 0.902*** 0.928*** 0.897*** 0.908*** 0.926***
UnionMember 0.918*** 0.863*** 0.960*** 0.916*** 0.891***
Location 1.097*** 1.096*** 1.096*** 1.092*** 1.095***
Race (ref.: Black)
Yellow 1.142* 1.133** 0.994 1.018 1.018
White 1.087*** 1.092*** 1.076*** 1.074*** 1.037***
Indigenous 1.059 1.256*** 1.146*** 1.210*** 1.265***
Brown 1.018 1.042*** 1.027*** 1.029*** 1.012***
(1) (2) (3) (4) (5)
Education (ref.: Incomplete Higher or More)
No Education 0.871*** 0.842*** 0.885*** 0.890*** 0.917***
Incomplete Primary 0.875*** 0.852*** 0.906*** 0.908*** 0.915***
Complete Primary 0.890** 0.850*** 0.918*** 0.912*** 0.913***
Incomplete Secondary 0.896** 0.866*** 0.917*** 0.904*** 0.896***
Complete Secondary 0.881** 0.850*** 0.911*** 0.907*** 0.910***
Region (ref.: South)
Central-West 0.840*** 0.976* 0.863*** 0.975*** 0.968***
Northeast 0.460*** 0.592*** 0.517*** 0.638*** 0.736***
North 0.612*** 0.745*** 0.707*** 0.833*** 0.866***
Southeast 0.826*** 0.944*** 0.860*** 0.975*** 1.016***
Size_city (ref.: (0, 10 Thou])
(10 Thou,100 Thou] 1.011 1.006 1.032*** 1.023*** 1.057***
(100 Thou, 1 Million] 1.097*** 1.044*** 1.078*** 1.037*** 1.066***
(1 Million, +] 1.023 0.992 1.066*** 1.024*** 1.026***
Size_establishment (ref.: (0, 10])
(10, 100] 1.308*** 1.260*** 1.267*** 1.231*** 1.333***
(100, 1.000] 1.386*** 1.295*** 1.323*** 1.246*** 1.390***
(1.000, 10.000] 1.487*** 1.411*** 1.412*** 1.327*** 1.472***
(10.000, +] 1.238*** 1.178*** 1.107*** 1.112*** 1.306***
CBO (ref.: Farming and Fishing)
Industry— Generalists 0.883*** 0.901*** 0.880*** 0.881*** 0.804***
Industry — Operators 0.870*** 0.821*** 0.918*** 0.866*** 0.786***
Maintenance & Repair 0.783*** 0.786*** 0.836*** 0.829*** 0.737***
Services, Commerce 0.749*** 0.762*** 0.786*** 0.765*** 0.669***
Administrative Services 0.743*** 0.747*** 0.787*** 0.751*** 0.628***
Mid-Level Technicians 0.760*** 0.764*** 0.825*** 0.804*** 0.710***
Others 0.837*** 0.822*** 0.837*** 0.807*** 0.731***
CNAE (ref.: Public Administration)
Agriculture, Livestock 3.041*** 3.316*** 3.161*** 3.048*** 1.994***
Administrative Activities 2.981*** 3.083*** 2.789*** 2.656*** 1.866***
Vehicle Sales & Repair 3.864*** 3.681*** 3.585*** 3.239*** 1.847***
Contracting 5.903*** 5.638*** 4.854*** 4.418*** 2.469***
Industry 3.457*** 3.381*** 3.385*** 3.108*** 1.727***
(1) (2) (3) (4) (5)
Others 3.699*** 3.474*** 3.466*** 3.104*** 1.689***
Admission Jan/08 Jan/08 2008 2008 2008
Classes of Salary 4 to 7 2 to 9 4 to 7 2 to 9 1 to 10
Reason for Failure Termination Termination Termination Termination All
Num. Observations 85,663 168,565 909,291 1,766,564 2,617,064
Num. Individuals 69,537 138,370 729,786 1,432,657 2,178,741
Num. Failures 56,386 114,933 565,040 1,136,191 1,805,839
Wald chi2 (43) 11,398*** 24,867*** 80,857*** 198,900*** 146,435***
Source: Elaborated by the authors.
Note: P-value: *<0.10, **<0.05, ***<0.01
In Model 1 we only considered those admitted in January 2008 with salaries falling within classes 4 to 7 who let their jobs due to termination (with or without just cause and initiated by the employee or the employer). he restriction of admission in January 2008 allows us to analyze a group in which all of the individuals were exposed to the same macroeconomic conditions since the beginning of their employment. Concentrating the analysis on more homogeneous salaries also helps guarantee that the control and treatment groups really comprise of comparable individuals.
In Model 2 the salary restriction was relaxed to include classes 2 to 9. Models 3 and 4 follow the pattern of Models 1 and 2 but take into consideration all those admitted during the year 2008. Final-ly, Model 5 considers the entire sample with no restrictions in terms of salary or reason for failure.
Note that the impact of the BFP, measured by the hazard ratio, varied between 0.898 and 0.929 for the various samples used. Even in the last regression, in which all the restrictions were relaxed, including the reason for failure, the inding was an intermediate value of 0.913. hese results show that BFP beneiciaries had a 7% to 10% lower chance of leaving their jobs as compared to non-ben-eiciaries, which not only contradicts the hypothesis of a work-disincentive due to cash transfer but also opens the possibility that this extra income produced an incentive to remain in their jobs.
his inding of the efect for conditional cash transfers, in this case in relation to formal employment job duration, is in line with various other studies that have found evidence for increased employment for beneiciaries (Brito and Kerstenetzky, 2011; Medeiros et al., 2007; Tavares, 2010; Teixeira, 2010). he argument is that, as children spend less time at home and attend school, their parents have more time available to work.
is related to the perception of these families that the beneit is a bonus to be spent in the best interest of their children (Soares et al., 2010).
A simple but interesting exercise is to note (based on regression number 3 in table 8) that the risk of leaving one’s job is 3.1% greater for individuals who have a minor child (hazard ratio: e0.030529 = 1.031). When we look at an individual with three minor children, as compared to an individual without minor children, there is a 9.6% greater chance of leaving one’s job (hazard ratio: e3·0.030529 = 1.096). Being a BFP beneiciary, however, is capable of nullifying this efect (hazard ratio: 1.096 · 0.898 = 0.984). In other words, suppose that an employer is choosing between a candidate who is not a BFP beneiciary and does not have a minor child and another candidate with three minor children.
Ceteris paribus, if this other candidate with three minor children is a BFP beneiciary, he or she will
have the same chances of remaining on the job as the irst candidate.
In relation to the control variables, it may be noted that there is a lower risk of leaving work for residents of the Northeast, rural residents, older individuals, women, those with higher salaries, those in their irst job and those working in public administration. It can also be seen that those who are black have a lower chance of leaving their work than those who declared themselves to be white. As pointed out by Menezes-Filho and partners(2008) and Garcia and Dedecca (2013), union membership is related to stability in remaining in jobs, productivity and salaries. he result for the unionmember
variable indicates that employees who are union members are less likely to leave their jobs.
Greater risk of leaving jobs was observed for civil construction employees, for those living in the South, individuals with more than secondary education and residents of large cities, with populations ranging from 100 thousand to a million individuals. Most of these results are in line with the literature related to the duration of employment and unemployment, covering various regions of the country: Menezes-Filho and Picchetti (2000); Penido and Machado (2002); Malbouisson and Menezes (2004); Menezes and Dedecca (2006); Antigo and Machado (2006); Oliveira and Carvalho Júnior (2009); Leichsenring (2010); and Lira (2011).
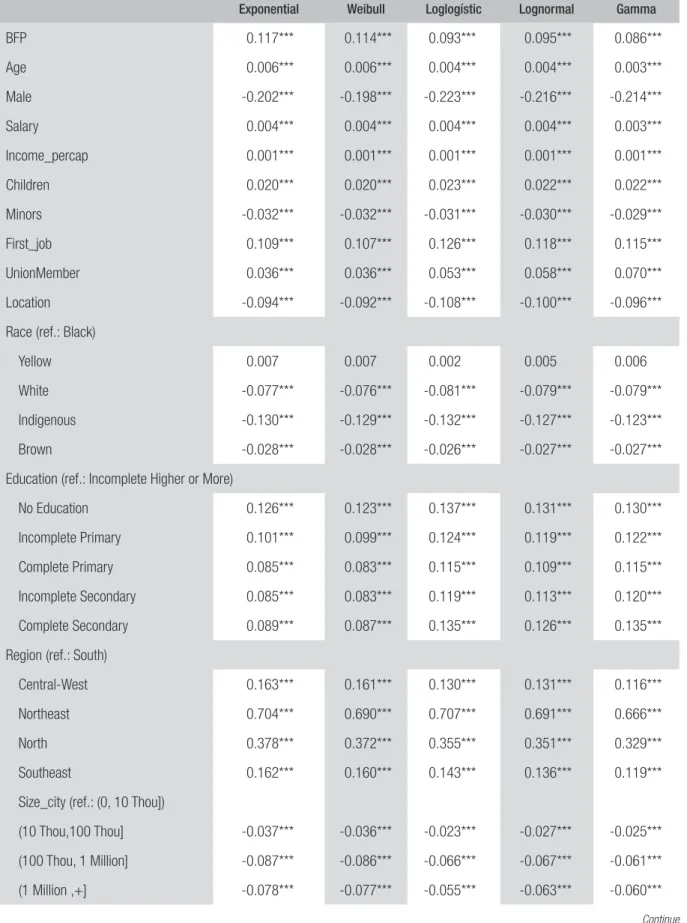
In addition, we adjusted our parametric models and their estimated coeicients are shown in table 9. All of these models are in the form of accelerated failure time (AFT). In this context, a positive coeicient indicates a greater chance of survival (greater job duration). Contrary to the Cox model, where indicates the hazard ratio, in the AFT metric the quantity supplies the survival time ratio. For example, the estimated coeicient for the variable bfp in the Loglogístic model was 0.093. his value represents the survival time ratio of beneiciaries versus non-beneiciaries of e0.093 = 1.097, which means that BFP beneiciaries have job survival results which are 9.7% greater than non-beneiciaries.
According to Akaike (AIC) and Bayesian (BIC) criteria, the best adjustment comes from the Gamma function which has an estimated coeicient of 0.086, which is the most conservative efect among all the models. his value indicates that BFP beneiciaries stay in their jobs 8.95% longer than non-beneiciaries, with a 95% conidence interval of a result between 8.34% and 9.56%.
TABLE 9 ESTIMATED COEFFICIENTS FOR THE PARAMETRIC MODELS
Exponential Weibull Loglogístic Lognormal Gamma
BFP 0.117*** 0.114*** 0.093*** 0.095*** 0.086***
Age 0.006*** 0.006*** 0.004*** 0.004*** 0.003***
Male -0.202*** -0.198*** -0.223*** -0.216*** -0.214***
Salary 0.004*** 0.004*** 0.004*** 0.004*** 0.003***
Income_percap 0.001*** 0.001*** 0.001*** 0.001*** 0.001***
Children 0.020*** 0.020*** 0.023*** 0.022*** 0.022***
Minors -0.032*** -0.032*** -0.031*** -0.030*** -0.029***
First_job 0.109*** 0.107*** 0.126*** 0.118*** 0.115***
UnionMember 0.036*** 0.036*** 0.053*** 0.058*** 0.070***
Location -0.094*** -0.092*** -0.108*** -0.100*** -0.096***
Race (ref.: Black)
Yellow 0.007 0.007 0.002 0.005 0.006
White -0.077*** -0.076*** -0.081*** -0.079*** -0.079***
Indigenous -0.130*** -0.129*** -0.132*** -0.127*** -0.123***
Brown -0.028*** -0.028*** -0.026*** -0.027*** -0.027***
Education (ref.: Incomplete Higher or More)
No Education 0.126*** 0.123*** 0.137*** 0.131*** 0.130***
Incomplete Primary 0.101*** 0.099*** 0.124*** 0.119*** 0.122***
Complete Primary 0.085*** 0.083*** 0.115*** 0.109*** 0.115***
Incomplete Secondary 0.085*** 0.083*** 0.119*** 0.113*** 0.120***
Complete Secondary 0.089*** 0.087*** 0.135*** 0.126*** 0.135***
Region (ref.: South)
Central-West 0.163*** 0.161*** 0.130*** 0.131*** 0.116***
Northeast 0.704*** 0.690*** 0.707*** 0.691*** 0.666***
North 0.378*** 0.372*** 0.355*** 0.351*** 0.329***
Southeast 0.162*** 0.160*** 0.143*** 0.136*** 0.119***
Size_city (ref.: (0, 10 Thou])
(10 Thou,100 Thou] -0.037*** -0.036*** -0.023*** -0.027*** -0.025***
(100 Thou, 1 Million] -0.087*** -0.086*** -0.066*** -0.067*** -0.061***
(1 Million ,+] -0.078*** -0.077*** -0.055*** -0.063*** -0.060***
Exponential Weibull Loglogístic Lognormal Gamma
Size_establishment (ref.: (0, 10])
(10, 100] -0.356*** -0.350*** -0.365*** -0.364*** -0.357***
(100, 1.000] -0.108*** -0.108*** -0.045*** -0.074*** -0.069***
(1.000, 10.000] -0.247*** -0.242*** -0.262*** -0.262*** -0.261***
(10.000, +] -0.289*** -0.284*** -0.307*** -0.308*** -0.307***
CBO (ref.: Farming and Fishing)
Industry — Generalists 0.123*** 0.120*** 0.182*** 0.150*** 0.148***
Industry — Operators 0.076*** 0.074*** 0.139*** 0.115*** 0.119***
Maintenance & Repair 0.168*** 0.164*** 0.274*** 0.237*** 0.243***
Services, Commerce 0.232*** 0.226*** 0.339*** 0.308*** 0.317***
Administrative Services 0.223*** 0.218*** 0.352*** 0.315*** 0.331***
MidLevel Technicians 0.182*** 0.178*** 0.283*** 0.245*** 0.250***
Others 0.168*** 0.165*** 0.244*** 0.200*** 0.200***
CNAE (ref.: Public Administration)
Agriculture, Livestock -1.251*** -1.219*** -1.077*** -0.960*** -0.861***
Administrative Activities -1.107*** -1.077*** -1.011*** -0.877*** -0.793***
Vehicle Sales & Repair -1.383*** -1.348*** -1.226*** -1.088*** -0.976***
Contracting -1.674*** -1.633*** -1.629*** -1.449*** -1.336***
Industry -1.327*** -1.293*** -1.131*** -0.997*** -0.877***
Others -1.341*** -1.306*** -1.212*** -1.074*** -0.970***
Constant 5.490*** 5.501*** 4.773*** 4.794*** 4.630***
Wald chi2 (43) 84,321*** 87,453*** 117,348*** 105,869*** 91,278***
AIC 2,129,206 2,127,993 2,043,432 2,037,241 2,030,510
BIC 2,129,721 2,128,520 2,043,959 2,037,768 2,031,050
Source: Elaborated by the authors.
Note: he sample is comprised of all those admitted in 2008 who remained in their jobs through December 2011 or who terminated their contracts with or without just cause by the initiative of the employee or the employer, considering salary classes 4 through 7. he total number of observations was 909,291, with 729,786 individuals. he number of failures was 565,040. All of the models use the AFT (accelerated time failure) metric. P-value: *<0.10, **<0.05, ***<0.01.
5. CONCLUSION
his inding not only contradicts the hypothesis of there being a work-disincentive associated with the concession of this beneit, but also establishes an inverse efect, in which the inancial beneit provided by the program contributes to the maintenance of employment.
In terms of public policy this is a relevant result, given that the poor population of Brazil is char-acterized by considerable income volatility and job turnover, which compromise present and future well-being and make it diicult to retire based on time of contribution. his study contributes to the literature and is innovative in that it analyzes the efect of cash transfer on job duration, in contrast to most studies that address this issue from the point of view of participation and the length of the workday (Oliveira and Soares, 2012; Ferro et al., 2010; Chitolina et al., 2016; Foguel and Barros, 2010; Soares, 2012; Tavares, 2010), and treat the participation in the Bolsa Família Program as a time-de-pendent variable.
Using the semiparametric Cox model, we estimate the risk of leaving one’s job to be 7% to 10% less for beneiciaries as compared to non-beneiciaries. To illustrate this point, we can compare it with the efect caused by having minor children in the family, which increases the chances of the parents leaving their jobs. In the main regression, the presence of three children in the household increased the chances of leaving employment by 9.6%. However, this probability was nulliied when the individual received a BFP payment. he parametric models corroborated this result, indicating that BFP beneiciaries remain in their jobs at least 9% longer than non-beneiciaries.
REFERENCES
ALÉM, Ana C.; PASTORIZA, Florinda; GIAMBIA-GI, Fabio. A aposentadoria por tempo de serviço no Brasil: estimativa do subsídio recebido pelos seus beneiciários. Revista Brasileira de Economia, v. 52, n. 1, p. 169-206, 1998.
ALZÚA, María L.; CRUCES, Guillermo; RIPANI, Laura. Welfare programs and labor supply in deve-loping countries: experimental evidence from Latin America. Journal of Population Economics, v. 26, n. 4, p. 1255-1284, 2013.
ANTIGO, Mariangela F.; MACHADO, Ana F. Tran-sições e duração do desemprego: uma revisão da literatura com novas evidências para Belo Horizonte.
Nova Economia, v. 16, n. 3, p. 375-406, 2006.
ARAÚJO, Guilherme S.; RIBEIRO, Rosana; NEDER, Henrique D. Impactos do Programa Bolsa Família sobre o trabalho de crianças e adolescentes residen-tes na área urbana em 2006. Economia, v. 11, n. 4, p. 57-102, 2010.
BARBOSA, Ana L. N. de H.; CORSEUIL, Carlos H. L. Bolsa Família, escolha ocupacional e informalidade no Brasil. Texto para Discussão, Instituto de Pesquisa Econômica Aplicada (Ipea), 2014.
BARRIENTOS, Armando; VILLA, Juan. Antipoverty
transfers and labor force participation efects. BWPI, he University of Manchester, 2013.
BRITO, Alessandra; KERSTENETZKY, Celia L.
Programa Bolsa Família e mercado de trabalho: considerações metodológicas e substantivas. Anpec —
Associação Nacional dos Centros de Pós-graduação em Economia [Brazilian Association of Graduate Programs in Economics], 2011.
BRITTO, Tatiana. Recent trends in the development agenda of Latin America: an analysis of conditional cash transfers. In: CONFERENCE ON SOCIAL PROTECTION FOR CHRONIC POVERTY HOS-TED BY THE INSTITUTE FOR DEVELOPMENT POLICY AND MANAGEMENT AND THE CHRONIC POVERTY RESEARCH CENTRE, 2005, Manchester, United Kingdom. p. 23-24.
CEPAL, N. U. he employment situation in Latin America and the Caribbean: Conditional transfer
programmes and the labour market. United Nations
Publication, n. 10, 2014.
CHITOLINA, Lia; FOGUEL, Miguel N.; MENEZES-FILHO, Naercio A. he impact of the expansion of the Bolsa Família program on the time allocation
of youths and their parents. Revista Brasileira de
Economia, v. 70, n. 2, p. 183-202, 2016.
DE BRAUW, Alan et al. Bolsa Família and household
labor supply. Economic Development and Cultural
Change, v. 63, n. 3, p. 423-457, 2015.
DE HOOP, Jacobus; ROSATI, Furio C. Cash
trans-fers and child labor. he World Bank Research
Ob-server, v. 29, n. 2, p. 202-234, 2014.
FERRO, Andrea R.; KASSOUF, Ana L.; LEVISON, Deborah. he impact of conditional cash transfer programs on household work decisions in Brazil. In: AKEE, Randall K.Q.; EDMONDS, Eric V.;
TAT-SIRAMOS, Konstantinos (Ed.). Child labor and the
transition between school and work. Research in
Labor Economics, v. 31, p. 193-218, 2010.
FOGUEL, Miguel N.; BARROS, Ricardo P. de. he efects of conditional cash transfer programmes on adult labour supply: an empirical analysis using a time-series-cross-section sample of Brazilian mu-nicipalities. Estudos Econômicos, São Paulo, v. 40,
n. 2, p. 259-293, 2010.
GARCIA, Carlos H.; DEDECCA, Claudio S. A heterogeneidade do mercado de trabalho e a de-sigualdade na representação sindical. Sociologia & Antropologia, v. 3, n. 5, p. 223-243, 2013.
GIAMBIAGI, Fabio; AFONSO, Luís E. Cálculo da alíquota de contribuição previdenciária atuarialmente equilibrada: uma aplicação ao caso brasileiro. Revista Brasileira de Economia, v. 63, n. 2, p. 153-179, 2009.
GONZALEZ-ROZADA, Martin; PINTO, Freddy L. he efects of a conditional transfer program on the labor market: the human development bonus in Ecuador. Washington, DC: Inter-American Develo-pment Bank, 2011. Mimeo.
KLEINBAUM, David G.; KLEIN, Mitchel. Survival
analysis: a self-learning text. New York: Springer Science & Business Media, 2006.
LANCASTER, Tony. he econometric analysis of
transition data. New York: Cambridge University Press, 1992.
LEICHSENRING, Alexandre R. Precariedade
Jorge A.; MODESTO, Lúcia. Bolsa Família 2003-2010: avanços e desaios. Brasília: Ipea, 2010. v. 1, p. 271-300.
LINDERT, Kathy et al. he nuts and bolts of Brazil’s Bolsa Família program: implementing conditional cash transfers in a decentralized context. Social Protection Discussion Paper, 2007.
LIRA, Sachiko A. Duração do desemprego na região
metropolitana de Curitiba. Revista Paranaense de
Desenvolvimento-RPD, n. 109, p. 139-160, 2011.
MALBOUISSON, Cláudia Sá; MENEZES, Wilson F. Duração do desemprego na Região Metropolitana de Salvador: mensuração e análise. In: ENCONTRO NACIONAL DE ECONOMIA, 32, João Pessoa, PB.
Anais... João Pessoa: Anpec, 2004.
MARSHALL, Caroline; HILL, Peter S. Ten best re-sources on conditional cash transfers. Health Policy and Planning, v. 30, n. 6, p. 742-746, 2014.
MEDEIROS, Marcelo; BRITTO, Tatiana; SOARES, Fabio. Programas focalizados de transferência de
renda: contribuições para o debate. Ipea, Texto para
discussão n. 1283, Brasília, jun. 2007.
MENEZES, Wilson F.; DEDECCA, Cláudio S. Avaliação da duração do desemprego nas regiões metropolitanas de Salvador e de São Paulo. Revista
Economia Contemporânea, v. 10, n. 1, p. 35-60, 2006.
MENEZES-FILHO, Naércio A. et al. Trade unions and the economic performance of Brazilian establish-ments. Estudos Econômicos, v. 38, n. 1, p. 55-72, 2008.
MENEZES-FILHO, Naércio A.; PICCHETTI, Paulo. Os determinantes da duração do desemprego em São Paulo. Pesquisa e Planejamento Econômico, v. 30, n. 1, p. 23-47, 2000.
OLIVEIRA, Ana M. H. et al. he irst results of the baseline impact evaluation of Bolsa Família. In: VAITSMAN, Jeni; PAES-SOUZA, Rômulo (Ed.).
Evaluation of MDS’ programs and policies-results.
Brasília: Sagi/MDS, 2007. v. 2, p. 19-64.
OLIVEIRA, Luis F. B.; SOARES, Sergei S. D. O que se sabe sobre os efeitos das transferências de renda sobre a oferta de trabalho. Texto para Discussão, Ins-tituto de Pesquisa Econômica Aplicada (Ipea), 2012.
OLIVEIRA, Paulo F. A. de; CARVALHO JÚNIOR, José R. de A. Desigualdade de gênero na duração do desemprego e seus efeitos sobre os salários aceitos
no Brasil. Revista Econômica do Nordeste, v. 40,
n. 4, p. 833-850, 2009.
PARKER, Susan; SKOUFIAS, Emmanuel. he impact
of Progresa on work, leisure and time allocation. Wa-shington, DC: International Food Policy Research Institute, 2000.
PENIDO, Mariângela; MACHADO, Ana. De-semprego: evidências da duração no Brasil me-tropolitano. In: ENCONTRO DA ASSOCIAÇÃO BRASILEIRA DE ESTUDOS POPULACIONAIS
— ABEP, XIII, 2002, Ouro Preto.
SKOUFIAS, Emmanuel; DI MARO, Vincenzo. Conditional cash transfers, adult work incentives,
and poverty. he Journal of Development Studies,
v. 44, n. 7, p. 935-960, 2008.
SOARES, Fábio V.; RIBAS, Rafael P. Is the efect
of conditional transfers on labor supply negligible everywhere? In: IZA/WORLD BANK
CONFEREN-CE: EMPLOYMENT AND DEVELOPMENT, 6th,
2011, Mexico City.
SOARES, Fábio V.; RIBAS, Rafael P.; OSÓRIO, Rafael G. Evaluating the impact of Brazil’s Bolsa Família: Cash transfer programs in comparative perspec-tive. Latin American Research Review, v. 45, n. 2, p. 173-190, 2010.
SOARES, Sergei S. D. Bolsa Família, its design, its impacts and possibilities for the future. Working Paper 89, International Policy Centre for Inclusive Growth, 2012.
TAVARES, Priscilla A. Efeito do Programa Bolsa Família sobre a oferta de trabalho das mães. Revista Economia e Sociedade, v. 19, n. 3, p. 613-635, 2010.
TEIXEIRA, Clarissa G. A heterogeneity analysis of the Bolsa Familía Programme efect on men and women’s work supply. Working Paper, International Policy Centre for Inclusive Growth, 2010.
WOOLDRIDGE, Jefrey M. Econometric analysis
Danilo Braun Santos
Universidade Federal de São Paulo/São Paulo School of Politics, Economics and Business. Email: danilo. [email protected].
Alexandre Ribeiro Leichsenring
Universidade de São Paulo/School of Arts, Sciences and Humanities. Email: [email protected].
Naercio Menezes Filho
Insper Instituto de Ensino e Pesquisa and the Universidade de São Paulo/Department of Economics. Email:
Wesley Mendes-Da-Silva