Effects of Statistical Models and Items Dif
fi
culties on Making
Trait-Level Inferences: A Simulation Study
Efeitos dos Modelos Estatísticos e da Di
fi
culdade dos Itens na Avaliação do Nível
de Traço Latente dos Indivíduos: Um Estudo de Simulação de Dados
Nelson Hauck Filho
*,a, Wagner de Lara Machado
b& Bruno Figueiredo Damásio
caUniversidade São Francisco, Itatiba, SP, Brasil,
bUniversidade Federal do Rio Grande do Sul, Porto Alegre, RS, Brasil
& cUniversidade Federal do Rio de Janeiro, Rio de Janeiro, RJ, Brasil
Abstract
Researchers dealing with the task of estimating locations of individuals on continuous latent varia-bles may rely on several statistical models described in the literature. However, weighting costs and
benefi ts of using one specifi c model over alternative models depends on empirical information that is
not always clearly available. Therefore, the aim of this simulation study was to compare the perfor-mance of seven popular statistical models in providing adequate latent trait estimates in conditions
of items diffi culties targeted at the sample mean or at the tails of the latent trait distribution. Results
suggested an overall tendency of models to provide more accurate estimates of true latent scores when using items targeted at the sample mean of the latent trait distribution. Rating Scale Model, Graded
Response Model, and Weighted Least Squares Mean- and Variance-adjusted Confi rmatory Factor
Analysis yielded the most reliable latent trait estimates, even when applied to inadequate items for
the sample distribution of the latent variable. These fi ndings have important implications concerning
some popular methodological practices in Psychology and related areas.
Keywords: Psychometrics, Item Response Theory, Classical Test Theory, factor analysis, data si-mulation, latent variable models.
Resumo
Pesquisadores interessados em estimar a localização de indivíduos em variáveis latentes contínuas
podem se benefi ciar de diversos modelos estatísticos disponíveis na literatura. Entretanto, ponderar
os custos e os benefícios de usar um modelo em detrimento de outros depende de informações em-píricas que nem sempre estão diretamente disponíveis. Em virtude disso, o objetivo deste estudo foi comparar o desempenho de sete modelos estatísticos populares quanto a proporcionar adequadas
estimativas de traço latente em condições de itens com difi culdades condizentes com a distribuição
latente amostral versus apenas condizentes com as caudas dessa distribuição. Os resultados sugeriram
uma tendência de todos os modelos de proporcionar estimativas mais precisas ao serem usados itens
adequados para o nível de traço latente da amostra. Os modelos da Teoria de Resposta ao Item Rating
Scale e Graded Response e a análise fatorial confi rmatória com estimação Weighted Least Squares Mean- and Variance-adjusted forneceram as estimativas mais fi dedignas de traço latente, mesmo quando os itens utilizados, de fato, correspondiam ao nível latente de poucos casos da amostra. Os resultados possuem importantes implicações no que diz respeito a algumas práticas metodológicas populares na Psicologia e em áreas próximas.
Palavras-chave: Psicometria, Teoria de Resposta ao Item, Teoria Clássica dos Testes, análise fatorial, simulação de dados, modelos de variáveis latentes.
* Mailing address:Programa de Pós-Graduação Stricto
Sensu em Psicologia, Universidade São Francisco, Rua Alexandre Rodrigues Barbosa, 45, Itatiba – SP, CEP 13251-900, Brasil. E-mail: [email protected], [email protected] and [email protected] “Latent variable” refers to a random variable with no sample realizations immediately available for at least some cases of a database (Bollen, 2002). Latent variables mathematically represents real infl uences underlying
statistical model that establishes a link function between these indicators and the latent variable in question.
Many statistical models address the problem of latent variable assessment in Psychology and related areas. Follo-wing, we discuss two general statistical models that com-prise several of commonly used psychometric approaches. Namely, these general models comprise the Classical Test Theory (CTT), and the Latent Variable Models (LVM). Further, we briefl y describe a third type of methodological approach, known as Principal Components (CP).
The general formulation of the Classical Test Theory (CTT) is:
X = T + (1)
Stated otherwise, observed score X of an individual
i in a test (or isolated item) j equals to his or her true score T plus a random error . In this case, the true score
T means E[X] = T, i.e., the expected raw score X for that individual, considering a hypothetical situation of infi nitely repeated independent measures (Bollen, 2002; Lord & Novick, 1968). Actually, there are no latent variables in the general model of CTT, so that the model consists only in a thought experiment involving repeated observable operations (Borsboom, 2005). However, it is a common practice among researchers in Psychology and related areas to treat raw scores (even when resulting from a single test administration) as if they were some sort of estimate of a latent variable. Indeed, some researchers have attempted to relate, conceptually, the observed score
X to a latent variable θ (Bechger, Maris, Verstralen, & Béguin, 2003).
In contrast with CTT, Latent Variable Models (LVM) allow for empirically testing the hypothesis that the popula-tion distribupopula-tion of raw scores in psychometric instruments depends on the population distribution of “unobserved” variables. A common central characteristic of all LVM is assuming observed data as a function of a unidimensional or multidimensional latent structure (Borsboom, 2008). Although the link function in the syntactic formulation of models may be linear, logistic, probit or of another type (Bollen, 1989), several LVM can be described by a simple linear combination of explanatory parameters (Mellenbergh, 1994). In spite of exceptions (see Mel-lenbergh, 1994), this holds true for most of usual models in Psychometrics, such as Factor Analysis (FA) and Item Response Theory (IRT).
The FA models are widely used in Psychology (Ten Holt, Van Duijn, & Boomsma, 2010). Briefl y, the FA models consist in:
Xij = vj+ aj1Fi1 + aj2Fi2 + ... + ajmFim + j (2)
That is, observed score Xij of individual i on item j is a function of the combination of m factor loadings aj and factor scores F plus a random error j,with the assumption that j ~N (Gorsuch, 1983). The vj parameter represents an
intercept, in general, set to 0 for identifi cation purposes. The FA of categorial data (e.g., Likert scales; for instance, Weighted Least Squares Mean- and Variance-adjusted Confirmatory Factor Analysis [WLSMV]; Muthén & Muthén, 1999) adds a threshold structure to the model, parameterizing the diffi culty of endorsement of categories (Ferrando & Lorenzo-Seva, 2005; Takane & de Leeuw, 1987). So, generally stated, in FA, an item score is ex-plained by an item intercept (and, in some cases, categories thresholds), the saturation or load of this item on n factors, and the location of individual on these n factors, besides random error.
While raw scores are modeled as the dependent varia-bles in FA models, in the context of IRT, the dependent variable is the conditional probability of observing a speci-fi c score on an item, given individual and item parameters. A general IRT model can be defi ned as:
P(U = u|θ) = f(θ, γ) (3)
That is, the conditional probability of observing a score
u on item j is a f function of a θ vector with one or more parameters describing the location of individuals on one or more continuous latent variables, and a γ vector containing one or more item parameters (for a more complete intro-duction, see Reckase, 2009). Among unidimensional IRT models suitable for polytomous items, link function f is, in general, a logistic regression (ψ), and item parameters are aj(discrimination) and bj(diffi culty), so that:
Pij(U = u|θi, aj, bj) = ψaj(θi - bj) (4)
Actually, IRT models are equivalent to the FA of cat-egorical data (Takane & de Leeuv, 1987). A minor differ-ence between IRT and FA of categorical data derives from equation (4), which implies a logistic parameterization, whereas categorical FA analysis - such as WLSMV mod-els, for instance - implements a probit parameterization for discrimination (factor loadings) and diffi culty (thresholds) parameters (Wirth & Edwards, 2007). Three commonly used unidimensional models to estimate latent scores with polytomous items are the Graded Response Model (GRM; Samejima, 1969), the Partial Credit Model (PCM; Masters, 1982) and the Rating Scale Model (RSM; Andrich, 1978). Whereas PCM and RSM estimate the person θi and item
bj parameters (constraining aj = 1), GRM estimates the parameters aj, bj and θi (for a more detailed explanation about differences between models, see Embretson & Reise, 2000; and Wright & Masters, 1982).
Finally, another commonly used model, but unrelated to CTT and to LVM, is Principal Components Model (CP; Hotelling, 1933), which consists in:
Zi = wj1Xj1 + wj2Xj2 + ... + wjnXjn (5)
indi-cators X and its respective w weights on the component. A principal component equals to a weighted sum of a set of ordinal or continuous indicators - an index useful to sum-marize data. Factors and components are not necessarily equivalent, as components are constituted by the common variance between the indicators (which constitutes a fac-tor), but also by their specifi c variance plus error variance (Gorsuch, 1997). Actually, PC model is more appropriate to rather investigate formative constructs (e.g., Vyas & Kumaranayake, 2006) than psychological phenomena un-derlying data. Thus, like CTT, it is a model that, formally, does not include latent variables as an explanation for the data, despite being often used in this sense.
A theoretical and practical matter is whether it makes difference using a particular model (from the ones pre-sented above) for estimating the latent trait levels of individuals in detriment of using the other models. In this regard, evidence suggests using CTT raw scores can sys-tematically overestimate or underestimate the true latent trait level under some conditions (Ziegler & Ziegler, 2009). Such biases were found in studies both in cognitive and psychopathology areas (Reise & Waller, 2009; Stansbury, Ried, & Velozo, 2006; Ziegler & Ziegler, 2009). A study have also shown that latent scores yielded by PC are less contaminated by disturbing infl uences, such as social desirability, than CTT scores (Saar, Aavik, & Konstabel, 2012). Also, compared to CTT, IRT models seem to pro-vide more accurate estimates of latent trait levels (Fraley, Waller, & Brennan, 2000; Weiss & Von Minden, 2011). Furthermore, IRT models are less prone (than CTT scores) toward spurious interaction effects in analysis of variance (Embretson, 1996a) and linear regression (Morse, Johan-son, & Griffeth, 2012). Therefore, studies have shown substantial differences, in pairwise comparisons, in the quality of estimates provided by models.
However, to our knowledge, only one previous em-pirical study addressed the issue of comparing latent trait estimates obtained via several different models. Namely, using real data on psychopathology, Dumenci and Achen-bach (2008) explored the relationship between latent trait estimates yielded by six statistical models (i.e., CTT, PC, exploratory FA with Maximum Likelihood estimation method [EFA-ml], confi rmatory FA with Weighted Least Squares Mean- and Variance-adjusted estimation method [CFA-wlsmv], GRM and PCM models). Authors found similar estimates obtained by CTT, PC, EFA-mlmethods on the one hand, and between CFA-wlsmv, GRM and PCM, on the other hand. Specifi cally, within each method group, linear relationships (R²) between estimates were near 1.00. By contrast, between groups, relationships were more of a quadratic or cubic type, with R² around .90. Therefore, fi ndings revealed non-negligible differences between these two clusters of models, suggesting some of them may be more appropriate than others given empiri-cal conditions yet to be fully explored. Nevertheless, the use of real data prevented authors from investigating such
conditions, as exemplifi ed by controlling the presence or not of items with highly dissimilar degrees of diffi culties.
In this respect, Embretson (1996b) used simulated data to illustrate how test equating under CTT yield divergent (non-linearly related) estimates for the same individuals when using an “easy” and a “hard” version of a test. In fact, the presence of items with inadequate diffi culties to the sample latent trait distribution may bias even the number of underlying dimensions identifi ed when us-ing exploratory methods such as continuous FA and PC (Aryadoust, 2009; Smith, 2009). Then, it follows that convergence between latent trait estimates from different psychometric models may vary according to whether or not items diffi culties match the sample mean of latent trait distribution. Nevertheless, we know of no previous works that have applied statistical tests to address this empirical issue. Therefore, the aim of the present simulation study was to compare the performance of seven popular statisti-cal models in providing adequate latent trait estimates in conditions of items targeted at the mean level or at the tails of the latent variable distribution. To do so, we evaluated correlations between estimated and simulated true latent scores, considering three simulation conditions: (a) items diffi culties targeted at the sample mean of latent trait dis-tribution (Condition 1); (b) items diffi culties targeted at the lower tail of latent distribution (Condition 2); and (c) items diffi culties targeted at the upper tail of latent distribution (Condition 3). In addition, we investigated the infl uence of sample size on the quality of models estimates. We sought to behold a diversity of statistical models commonly used in Psychometrics, representing the perspectives of CTT, FA, IRT and PC.
Method
Procedures of Data Simulation
Fifteen unidimensional databases were simulated, considering three items diffi culties distribution conditions (described below) × fi ve sample sizes (N = 100, N = 200, N
= 500, N = 1000 and N = 2000). For each database, 10 items representing a continuous latent variable were generated. We specifi ed a Likert scale of fi ve points, and a discrimina-tion (parameter a) ranging between .5 and 2.8. This allowed for items with a wide range of degrees of discrimination, according to extreme reference values listed in the litera-ture (Baker, 2001). The purpose of these specifi cations was to approximate real data, in which items tend to vary in terms of relationship with the latent trait. Items responses were generated with the Generalized Partial Credit model (Muraki, 1992), which admits a variability in the a and b
parameters of the items. The simulation was performed using the WinGen program (Han, 2007).
were also specifi ed to have a normal distribution (mean = 0 and standard deviation = 1). Thus, items resulted always located exactly in the portion of the latent continuum with the largest amount of cases – and, therefore, of useful information for estimating locations of individuals. By contrast, for databases of Condition 2 (items targeted at the lower tail of latent trait distribution) and Condition 3 (items targeted at the upper tail of latent trait distribution) we created items with diffi culties matching only the tails of the latent trait distribution; respectively, the 20% lower and the 20% upper individuals of sample distribution. Spe-cifi cally, items diffi culties fell between -3.00 and -.84 for Condition 2 and .84 and 3.00 for Condition 3, consistent with values form z score table.
Data Analysis
We measured the magnitude of correspondence between latent trait estimates and true (simulated) latent scores using Pearson correlation and determination coeffi cient (r²). We also tested for mean differences and effects of simulation condition, sample size and statistical model on shared variance with the true latent score using t
test, one-way ANOVA and factorial ANOVA. Estimates of true latent trait locations were obtained with the following models:
Classical Test Theory (CTT). Raw scores were com-puted for the 10 items of each database, assuming the parallelism between items (i.e., its equivalence as to the true scores and the error variance; Graham, 2006).
Principal Components (PC). As described previously, PC method (Hotelling, 1933) provides an index which consists on a weighted sum of (continuous or ordinal) indicators. Component scores were computed using SPSS 19.0 program, regression scoring method.
Maximum Likelihood Exploratory Factor Analysis
(EFA-ml). ML method applied to exploratory factor analy-sis (Jöreskog, 1967) is also a way to estimate parameters described in equation (2). In spite of assuming normal and continuous distribution of data, ML is one of the most popularly used estimation methods for factor analysis (Fabrigar, Wegener, Maccallum, & Strahan, 1999). Factor scores derived from EFA-ml were computed using SPSS 19.0 program, regression scoring method.
Minimum Rank Exploratory Factor Analysis (EFA-mr). Minimum rank method (ten Berge & Kiers, 1991) is one of the several possibilities for estimating parameters of the general model of equation (2). EFA-mr was developed to maximize common variance explained in each extracted factor (ten Berge & Kiers, 1991). Factor scores estimates were obtained with software FACTOR 8.1 (Lorenzo-Seva & Ferrando, 2006), which uses a linear method developed by ten Berge, Krijnen, Wansbeek and Shapiro (1999).
Rating Scale Model (RSM). RSM (Andrich, 1978) is an IRT model for polytomous items that takes into account the purely ordinal nature of Likert scales. RSM was derived from dichotomous Rasch (1960) model, which is often considered the best option when the goal
is separability between item and person parameters (Bond & Fox, 2007; Wright, 1997). Software used was Winsteps 3.72.0 (Linacre, 1991), which provides Joint Maximum Likelihood estimation method.
Graded Response Model (GRM). GRM (Samejima, 1969) is an IRT model suitable for polytomous items such as Likert scales, hence taking into account the ordinal nature of raw data modeled. GRM admits a variability in item discrimination parameters (parameter a). Analyses were conducted with ltm package (Rizopoulos, 2006) using
R program. The package uses Marginal Maximum Likeli-hood estimation method with Expectation-Maximization algorithm (Bock & Aitkin, 1981) to calculate model parameters. We computed latent scores via Expected a Posteriori method.
Weighted Least Squares Mean- and Variance-adjusted Confi rmatory Factor Analysis (CFA-wlsmv). Confi rma-tory factor analysis with WLSMV estimation method (Muthén & Muthén, 1999) does not assume continuity or normal distribution of data, typically using policoric corre-lation matrices. CFA-wlsmv, therefore, takes into account the purely ordinal nature of Likert scales of response. CFA--wlsmv, in general, tends to provide parametric estimates closely related to GRM (although in a probit scale), as it estimates factor loadings (item discrimination) as well as item thresholds or intercepts (item diffi culty; Ferrando & Lorenzo-Seva, 2005). Analyses were conducted with Mplus 6.0 software (Muthén & Muthén, 2010). Mplus uses Maximum a Posteriori method to calculate factor scores for WLSMV models.
Results
We used the seven methods described in the previ-ous section to estimate (i.e., recover) the true latent trait locations on 15 simulated databases. Pearson correlation coeffi cientsand shared variance r² measuring the relation-ship between estimated and true latent scores in simulation Conditions 1, 2 and 3 are shown in Table 1. Results showed a small variability in determination coeffi cients (Δr²) along sample sizes when items had diffi culties matching the latent trait distribution of sample used – namely, Condition 1. In contrast, we observed a larger variability in determination coeffi cients for Condition 2 and Condi-tion 3 (i.e., situaCondi-tions in which items diffi culties were not targeted at the sample mean of latent trait distribution).
Analysis of variance (ANOVA) showed no signifi cant effects for sample size on mean values of r², F(4, 100) = .11, p = .98, as well as for interactions between sample size and statistical models, F( 24, 70) = .01, p = 1.00, and sample size and simulation conditions, F(8, 90) = 1.45, p
in order to better assess the effect of statistical model on r² values. Results showed signifi cant effects for model type in Condition 2, F(6, 28) = 36.85, p < .001, and Condition 3,
F(6, 28) = 17.35, p < .001. Although Omnibus test showed signifi cant differences of mean r² for statistical model in Condition 1, F(6, 28) = 3.02, p = .02, Bonferroni post hoc Table 1
Models Performances in the Simulation Conditions
N
Condition 1
CTT PC EFA-ml EFA-mr RSM GRM CFA-wlsmv
R R² R R² r R² R R² R R² r R² R R²
2000 .954 .910 .957 .897 .955 .912 .957 .916 .961 .924 .962 .925 .964 .929
1000 .947 .897 .948 .899 .950 .902 .949 .901 .951 .904 .959 .920 .961 .923
500 .943 .889 .945 .893 .946 .895 .946 .895 .947 .897 .952 .906 .954 .910
200 .938 .880 .941 .885 .942 .887 .941 .885 .941 .885 .952 .906 .955 .912
100 .947 .897 .947 .897 .944 .891 .947 .897 .954 .910 .948 .899 .951 .904
ΔR² .030 .014 .025 .031 .039 .026 .025
Mean R² .895a .894a .897a .899a .904a .911a .916a
N
Condition 2
CTT PC EFA-ml EFA-mr RSM GRM CFA-wlsmv
R R² r R² r R² R R² R R² r R² R R²
2000 .737 .543 .725 .526 .732 .536 .723 .523 .841 .707 .839 .704 .839 .704
1000 .767 .588 .747 .558 .714 .510 .745 .555 .800 .640 .834 .696 .836 .699
500 .791 .626 .770 .593 .778 .605 .766 .587 .850 .722 .857 .734 .859 .738
200 .768 .590 .762 .581 .754 .569 .763 .582 .856 .733 .858 .736 .862 .743
100 .769 .591 .767 .588 .742 .551 .764 .584 .826 .682 .858 .736 .856 .733
ΔR² .048 .067 .095 .064 .093 .042 .044
Mean R² .588a .569a .554a .566a .697b .721b .723b
N
Condition 3
CTT PC EFA-ml EFA-mr RSM GRM CFA-wlsmv
R R² r R² r R² r R² r R² r R² R R²
2000 .770 .593 .758 .575 .745 .555 .758 .575 .845 .714 .850 .722 .851 .724
1000 .781 .610 .766 .587 .764 .584 .763 .582 .852 .726 .860 .740 .861 .741
500 .749 .561 .734 .539 .726 .527 .733 .537 .854 .729 .849 .721 .851 .724
200 .718 .515 .699 .487 .675 .456 .699 .489 .788 .621 .807 .651 .805 .648
100 .756 .571 .748 .560 .747 .558 .745 .555 .812 .659 .811 .658 .813 .661
ΔR² .095 .100 .128 .086 .108 .089 .093
Mean R² .570a .550a .536a .548a .690b .698b .700b
Note. CTT = Classical Test Theory (raw scores), PC = Principal Components, EFA-ml = Exploratory Factor Analysis with Maximum
Likelihood estimation method, EFA-mr = Exploratory Factor Analysis withMinimum Rank estimation method, RSM = Rating Scale
Model, GRM = Graded Response Model, CFA-wlsmv = Confi rmatory Factor Analysis with Weighted Least Squares Mean- and
Variance-adjusted estimation method. ΔR² = variation in the R² coeffi cient.
bDiffers from a with p < .001 in the pairwise comparison.
tests indicated no signifi cant differences between models in pairwise comparisons.
internally consistent clusters of statistical models. Indeed, after averaging observed r² yielded byCTT, PC, EFA-ml and EFA-mr on one hand, and RSM, GRM and CFA-wlsmv on the other hand, results showed extremely-sized signifi cant differences between groups of statistical models for Condition 1, t(33) = -3.89, d = 1.32, p < .001, Condition
2, t(33) = -14.43, d = 4.97, p < .001, and Condition 3, t(33) = -10.63, d = 3.62, p < .001. Therefore, overall performance of recovery of true latent score was better for the group comprising RSM, GRM and CFA-wlsmv when compared to the group comprising CTT, PC, EFA-ml and EFA-mr. This pattern is clearly depicted in Figure 1.
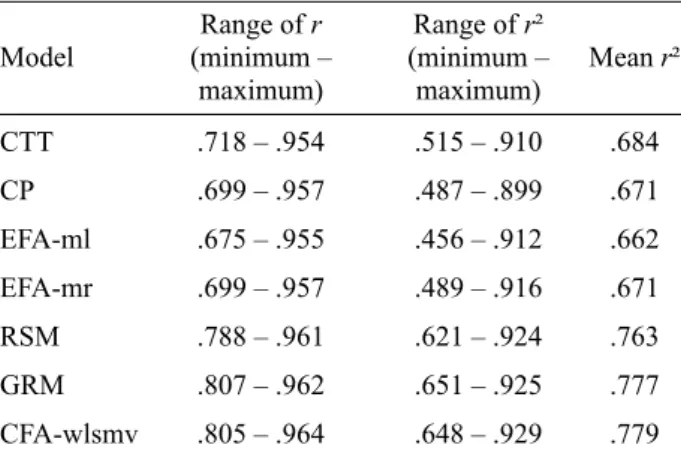
Table 2 summarizes each model performance along simulation conditions and sample sizes. PC, EFA-ml and EFA-mr did not show a better performance than the simple sum of raw scores (CTT). By contrast, RSM, GRM and CFA-wlsmv showed general r² means consistently higher than obtained by others models. Variability in r
and r² coeffi cients was also lower for these three models, indicating more stable estimates, independently of simulation condition.
Table 2
Overall Results
Model
Range of r
(minimum – maximum)
Range of r²
(minimum – maximum)
Mean r²
CTT .718 – .954 .515 – .910 .684
CP .699 – .957 .487 – .899 .671
EFA-ml .675 – .955 .456 – .912 .662
EFA-mr .699 – .957 .489 – .916 .671
RSM .788 – .961 .621 – .924 .763
GRM .807 – .962 .651 – .925 .777
CFA-wlsmv .805 – .964 .648 – .929 .779
Note. CTT = Classical Test Theory (raw scores), PC = Princi-pal Components, EFA-ml = Exploratory Factor Analysis with Maximum Likelihood estimation method, EFA-mr = Exploratory
Factor Analysis withMinimum Rank estimation method, RSM
= Rating Scale Model, GRM = Graded Response Model,
CFA-wlsmv = Confi rmatory Factor Analysis with Weighted Least
Squares Mean- and Variance-adjusted estimation method.
Discussion
Our fi ndings have theoretical and practical implica-tons in respect to the task of estimating the locations of individuals on continuous latent variables using unidi-mensional statistical models. First of all, results indicated a substantial variability in the performance of methods according to the presence or not of items too easy or too diffi cult for the sample assessed. More specifi cally, we observed a reduced overall performance of models in conditions in which items diffi culties matched the latent trait levels of only 20% of lower or upper individuals. In these conditions, we observed a greater proportion of error in the yielded estimates. As a result, it bears stressing the critical need to always use items adequately matching the latent trait level of the sample. Inadequate items imply low accuracy for latent trait estimates, dramatically increasing the likelihood of spurious results in analyses based on these estimates.
Second, in all simulation conditions, RSM, GRM and CFA-wlsmv provided estimates more closer to the true latent scores than CTT, PC, EFA-ml and EFA-mr. These differences were extremely-sized in Conditions 2 and 3 (i.e., in which items diffi culties were targeted at the tails of sample distribution of latent trait; d = 4.97 and 3.62, respectively). Thus, fi ndings suggest that RSM, GRM and CFA-wlsmv are less affected by a possible “mismatch” between items and sample distribution in their latent trait estimates. This pattern is consistent with fi ndings from the study by Dumenci and Achenbach (2008), and held even in the ideal Condition 1, in which items diffi culties were
0 0,1 0,2 0,3 0,4 0,5 0,6 0,7 0,8 0,9 1
Condition 1 Condition 2 Condition 3
CTT PC EFA-ml EFA-mr RSM GRM CFA-wlsmv
specifi ed to be randomly distributed around the sample mean of the latent trait distribution (d = 1.32).
One explanation for this difference refers to the syntactic formulation of models. Namely, RSM, GRM and CFA-wlsmv estimate items diffi culties ( or b parameters in RSM and GRM, and τ thresholds in CFA-wlsmv), what is not true for CTT, PC, EFA-ml and EFA-mr. Including these parameters in the model, therefore, results in a greater capacity to isolate variability in responses due to features of items from variability attributable to features of individuals who respond to them. Put in other words, RSM, GRM and CFA-wlsmv do not assume items to be equally diffi cult. Actually, diffi culty parameters tipically tend have a distribution of values between items (a desirable feature in psychometric instruments), so that it may be more appropriate to use statistical models that take this variability into account. Another feature is that RSM, GRM and CFA-wlsmv do not assume categorical ordered data (such as Likert scale scores) to be continuous
measures of psychological attributes possessed by individuals. Consistent with previous simulation studies (e.g., Holgado-Tello, Chacón-Moscoso, Barbero-García, & Vila-Abad, 2010), taking into account the ordinal nature of indicators yielded a better approximation of estimates to the real parameter values.
Normal theory ML estimation assumes continuity and normal distribution of items, unlikely features for discrete, ordinal indicators such as typical Likert scales with a small number of categories. Illustrating this point, a recent simulation study recommended using Robust Categorical Least Squares (RCLS) estimation instead of ML for factor analysis of items with fewer than fi ve categories (Rhemtulla, Brosseau-Liard, & Savalei, 2012). By contrast, Rhemtulla et al. (2012) also recommended using ML rather than RCLS if the number of categories equals to or exceeds fi ve, as variables tend to approach a continuous distribution. In light of this particularity, we must stress that we base our results and conclusions on data with fi ve categories, without claiming the patterns would remain the same for items with a larger number of categories. Future studies should address this issue by testing for the interaction of number of categories, statistical model and simulation condition.
Nevertheless, our fi ndings counter-recommend using raw scores (CTT) or factor scores derived from EFA-ml, EFA-mr and PC to represent true persons locations on unidimensional psychological variables assessed with items with up to fi ve categories. Besides producing larger errors in estimates, they do not afford detecting whether the situation in question is ideal as Condition 1 of this study, or problematic as Conditions 2 and 3. Therefore, researchers, technicians and other professionals in the area of psychology and related areas should review their prac-tice of using raw scores (e.g., sum of Likert scales scores) as if they were proxies to latent psychological phenomena. A result that is also worth mentioning is that RSM yielded estimates as precise as GRM and CFA-wlsmv,
even without modeling items discriminations. In fact, RSM allows to estimate only the overall diffi culty j of items and specifi c item thresholds “ j + τk” for Likert scale categories (Andrich, 1978). Thus, considering that GRM and CFA-wlsmv also incorporate discrimination parameters in the model, it would be expected a better recovery of true latent trait level when compared to the RSM. The reason for this expectancy is that including discrimination parameter generally implies a better fi t of model to the data, as it yields a variability in the slope of item characteristic curves (Hambleton, 1994). In contrast, we observed no signifi cant differences between estimates obtained from RSM, GRM and CFA-wlsmv models across the three simulation conditions, even with items specifi ed to have a discrimination value widely ranging from .5 to 2.8. Although these three models yielded similar estimates, it is noteworthy that RSM imposes a smaller number of parameters on data, which points to a more parsimonious latent trait modeling for RSM than for GRM and CFA-wlsmv.
Conclusions
We need to stress some limitations in our study. First, we used single databases for each sample size in all Conditions 1, 2 and 3. Future studies may address this shortcoming using a larger number of databases in order to obtain a distribution of R² for each sample size within simulation conditions. This may help to obtain more precise evidences of the level of bias in estimates of each model when items do not match sample distribution. Second, we did not address assessment situations using multidimensional models, so that we encourage authors to expand the investigation to multidimensional contexts. Third, we did not test the effect of estimation method within each statistical model. It is possible, in this sense, that promising estimation techniques, such as Markov Chain Monte Carlo, would provide more stable estimates along several simulation conditions for RSM, GRM and CFA-wlsmv – and perhaps other models. Fourth, we restricted our investigation to fi ve-category indicators, so that results do not generalize to situations in which instruments comprise items scored on a scale with a larger number of categories – new simulation studies should investigate whether differences between models still hold in this situation. Finally, researchers may be interested in further controlling for latent trait distribution features such as assimetry and kurtosis, as some techniques such as EFA-ml make assumptions in this regard.
References
Andrich, D. (1978). A rating formulation for ordered response
categories. Psychometrika, 43(4), 561-573. doi:10.1007/
BF02293814
Aryadoust, S. V. (2009). The impact of Rasch item diffi culty on
confi rmatory factor analysis. Rasch Measurement
Transac-tions, 23(2), 1207.
Baker, F. B. (2001). The basics of item response theory.
Col-lege Park, MD: ERIC Clearinghouse on Assessment and Evaluation.
Bechger, T. M., Maris, G., Verstralen, H. H. F. M., & Béguin, A. A. (2003). Using classical test theory in combination with
item response theory. Applied Psychological Measurement,
27(5), 319-334. doi:10.1177/0146621603257518
Bock, R. D., & Aitkin, M. (1981). Marginal maximum like-lihood estimation of item parameters: Application of an EM
algorithm. Psychometrika, 46(4), 443-459. doi:10.1007/
BF02293801
Bollen, K. A. (1989). Structural equations with latent variables.
New York: John Willey & Sons.
Bollen, K. A. (2002). Latent variables in psychology and the
social sciences. Annual Review of Psychology, 53(1), 605-634.
doi:10.1146/annurev.psych.53.100901.135239
Bond, T. B., & Fox, C. M. (2007). Applying the Rasch model:
Fundamental measurement in the human sciences. New York: Routledge, Taylor & Francis Group.
Borsboom, D. (2005). Measuring the mind: Conceptual issues
in contemporary psychometrics. Cambridge, UK: Cambridge University Press.
Borsboom, D. (2008). Latent variable theory. Measurement:
Interdisciplinary Research & Perspective, 6(1-2), 25-53. doi:10.1080/15366360802035497
Dumenci, L., & Achenbach, T. M. (2008). Effects of estimation methods on making trait-level inferences from ordered
cate-gorical items for assessing psychopathology. Psychological
Assessment, 20(1), 55-62. doi:10.1037/1040-3590.20.1.55 Embretson, S. E. (1996a). Item response theory models and
spurious interaction effects in factorial ANOVA designs.
Applied Psychological Measurement, 20(3), 201-212. doi:10.1177/014662169602000302
Embretson, S. E. (1996b). The new rules of measurement.
Psychological Assessment, 8(4), 341-349. doi:10.1037/1040-3590.8.4.341
Embretson, S. E., & Reise, S. P. (2000). Item response theory for
psychologists. Mahwah, NJ: Lawrence Earlbaum.
Fabrigar, L., Wegener, D., Maccallum, R., & Strahan, E. (1999). Evaluating the use of exploratory factor analysis in
psycholo-gical research. Psychological Methods, 4(3), 272-299.
Ferrando, P. J., & Lorenzo-Seva, U. (2005). IRT-related factor analytic procedures for testing the equivalence of paper-and-pencil and Internet-administered questionnaires.
Psychological Methods, 10(2), 193-205. doi:10.1037/1082--989X.10.2.193
Fraley, R. C., Waller, N. G., & Brennan, K. A. (2000). An item response theory analysis of self-report measures of adult
attachment. Journal of Personality and Social Psychology,
78(2), 350-65. doi:10.1037/0022-3514.78.2.350
Gorsuch, R. L. (1983). Factor analysis. Hillsdale, NJ: Lawrence
Earlbaum.
Gorsuch, R. L. (1997). Exploratory factor analysis: Its role in item
analysis. Journal of Personality Assessment, 68(3), 532-560.
doi:10.1207/s15327752jpa6803_5
Graham, J. M. (2006). Congeneric and (essentially) tau-equi-valent estimates of score reliability: What they are and how
to use them. Educational and Psychological Measurement,
66(6), 930-944. doi:10.1177/0013164406288165
Grice, J. W. (2001). A comparison of factor scores under
condi-tions of factor obliquity. Psychological Methods, 6(1), 67-83.
doi:10.1037/1082-989X.6.1.67
Hambleton, R. H. (1994). Item response theory: A broad
psycho-metric framework for measurement advances. Psicothema,
6(4), 535-556.
Han, K. T. (2007). WinGen: Windows software that gener-ates item response theory parameters and item responses.
Applied Psychological Measurement, 31(5), 457-459. doi:10.1177/0146621607299271
Holgado-Tello, F. P., Chacón-Moscoso, S., Barbero-García, I., &
Vila-Abad, E. (2010). Polychoric versus Pearson correlations
in exploratory and confi rmatory factor analysis of ordinal
variables. Quality & Quantity, 44(1), 153-166. doi:10.1007/
s11135-008-9190-y
Hotelling, H. (1933). Analysis of complex statistical variables
into principal components. Journal of Educational
Psychol-ogy, 24(6), 417-441.
Jöreskog, K. G. (1967). Some contributions to maximum
likelihood factor analysis. Psychometrika, 32(4), 443-482.
doi:10.1007/BF02289658
Linacre, J. M. (1991). A user’s guide to Winsteps, program
manual 3.72.0. Chicago, IL: Winsteps.com.
Lord, F. M., & Novick, M. R. (1968). Statistical theories of
mental test scores. Reading, MA: Addison-Wesley. Lorenzo-Seva, U., & Ferrando, P. J. (2006). FACTOR: A
com-puter program to fi t the exploratory factor analysis model.
Behavior Research Methods, 38(1), 88-91.
Masters, G. N. (1982). A Rasch model for partial credit scoring.
Psychometrika, 47(2), 149-174. doi:10.1007/BF02296272 Mellenbergh, G. J. (1994). Generalized linear item
re-sponse theory. Psychological Bulletin, 115(2), 300-307.
doi:10.1037//0033-2909.115.2.300
Morse, B. J., Johanson, G. A., & Griffeth, R. W. (2012). Using the graded response model to control spurious interactions in
moderated multiple regression. Applied Psychological
Mea-surement, 36(2), 122-146. doi:10.1177/0146621612438725 Muraki, E. (1992). A generalized partial credit model:
Applica-tion of an EM algorithm. Applied Psychological Measurement,
16(2), 159-176. doi:10.1177/014662169201600206
Muthén, L. K., & Muthén, B. (1999). Mplus user’s guide. Los
Angeles, CA: Authors.
Muthén, L. K., & Muthén, B. O. (2010). Mplus: Statistical
analysis with latent variables. User’s guide. Los Angeles, CA: Authors.
Rasch, G. (1960). Probabilistic models for some intelligence
and attainement tests. Copenhagen, Denmark: Danmarks Paedogogiske Institut.
Reckase, M. D. (2009). Multidimensional item response theory.
New York: Springer.
Reise, S. P., & Waller, N. G. (2009). Item response theory and
clinical measurement. Annual Review of Clinical Psychology,
5, 27-48. doi:10.1146/annurev.clinpsy.032408.153553
Rhemtulla, M., Brosseau-Liard, P. É., & Savalei, V. (2012). When can categorical variables be treated as continuous? A comparison of robust continuous and categorical SEM
esti-mation methods under suboptimal conditions. Psychological
Rizopoulos, D. (2006). ltm: An R package for latent variable
modeling and item response theory analyses. Journal of
Statistical Software, 17(5), 1-25.
Saar, K., Aavik, T., & Konstabel, K. (2012). Using principal component scores reduces the effect of socially desirable
responding. Personality and Individual Differences, 53(3),
279-283. doi:10.1016/j.paid.2012.03.030
Samejima, F. (1969). Estimation of latent trait ability using a
response pattern of graded scores. Psychometrika Monograph
Supplement No. 17, 34(4, Pt. 2).
Smith, R. M. (2009). A comparison of methods for determining
dimensionality in Rasch measurement. Structural Equation
Modeling, 3(1), 25-40. doi:10.1080/10705519609540027 Stansbury, J. P., Ried, L. D., & Velozo, C. A. (2006).
Unidi-mensionality and bandwidth in the Center for Epidemiologic
Studies Depression (CES-D) Scale. Journal of Personality
Assessment, 86(1), 10-22. doi:10.1207/s15327752jpa8601_03 Takane, Y., & de Leeuw, J. (1987). On the relationship between
item response theory and factor analysis of discretized
varia-bles. Psychometrika, 52(3), 393-408.
Ten Berge, J., & Kiers, H. (1991). A numerical approach to the approximate and the exact minimum rank of a
cova-riance matrix. Psychometrika, 56(2), 309-315. doi:10.1007/
BF02294464
Ten Berge, J. M. F., Krijnen, W. P., Wansbeek, T., & Shapiro, A. (1999). Some new results on correlation-preserving factor
sco-res prediction methods. Linear Algebra and its Applications,
289(1-3), 311-318. doi:10.1016/S0024-3795(97)10007-6
Ten Holt, J. C., Van Duijn, M. A. J., & Boomsma, A. (2010). Scale construction and evaluation in practice: A review of factor analysis versus item response theory applications.
Psychological Test and Assessment Modeling, 52(3), 272-297. Vyas, S., & Kumaranayake, L. (2006). Constructing
socio--economic status indices: How to use principal components
analysis. Health Policy and Planning, 21(6), 459-468.
doi:10.1093/heapol/czl029
Weiss, D. J., & Von Minden, S. (2011). Measuring individual
growth with conventional and adaptive tests. Journal of
Me-thods and Measurement in the Social Sciences, 2(1), 80-101. Wirth, R. J., & Edwards, M. C. (2007). Item factor analysis:
Cur-rent approaches and future directions. Psychological Methods,
12(1), 58-79. doi:10.1037/1082-989X.12.1.58
Wright, B. D. (1997). A history of social science measurement.
Educational Measurement: Issues and Practice, 16(4), 33-45. doi:10.1111/j.1745-3992.1997.tb00606.x
Wright, B. D., & Masters, G. (1982). Rating scale analysis:
Rasch measurement. Chicago, IL: Institute for Objective Measurement.
Ziegler, A., & Ziegler, A. (2009). The paradoxical attenuation effect in tests based on classical test theory: Mathematical background and practical implications for the
measure-ment of high abilities. High Ability Studies, 20(1), 5-14.
doi:10.1080/13598130902860473