Article
Printed in Brazil - ©2014 Sociedade Brasileira de Química0103 - 5053 $6.00+0.00A
*e-mail: [email protected]
Use of Chemometric Tools to Determine the Source of Metals in Sediments of the
Rivers of the Turvo/Grande Hydrographical Basin, São Paulo State, Brazil
Mariele B. Campanha,a João Paulo Romera,a Jéssica Coelho,a Edenir R. Pereira-Filho,b
Altair B. Moreiraa and Márcia C. Bisinoti*,a
aDepartment of Chemistry and Environmental Sciences, Institute of Biosciences, Literature and
Exact Sciences, São Paulo State University “Júlio de Mesquita Filho” (UNESP), R. Cristóvão Colombo 2265, 15054-000 São José do Rio Preto-SP, Brazil
bDepartment of Chemistry,Federal University of São Carlos,
Rod. Washington Luiz Km 235, 13565-905 São Carlos-SP, Brazil
Neste trabalho foi feita a determinação de nove metais em amostras superficiais e testemunhos de sedimentos de cinco locais de amostragens nos rios Preto, Turvo e Grande em períodos chuvoso e seco. Os metais foram determinados por espectrometria de absorção atômica com atomização por chama. Análise de componentes principais dos dados foi feita para avaliar os fatores que controlam as variações nas concentrações de metais. A granulometria e teor de matéria orgânica foram determinantes das concentrações de metais. No rio Preto (área urbana) concentrações elevadas de Zn são provenientes de aporte antrópico, enquanto que no rio Turvo (represamento, área rural) níveis elevados de nitrogênio total, Al, Cr, Cu, Fe, K, Mn e Ni foram decorrentes do escoamento superficial agrícola. Os demais locais mostraram menores concentrações de metais, porém violações dos valores guia de qualidade de sedimento, principalmente para Cr e Mn, indicam a necessidade de estratégias de gerenciamento da Bacia Hidrográfica do Turvo/Grande.
In this work, nine metals were determined in superficial samples and sediment cores obtained from five sampling sites in the Preto, Turvo, and Grande Rivers during the wet and dry seasons. The metals were determined by flame atomization atomic absorption spectrometry. Principal component analysis of the data was performed to evaluate the factors responsible for the variations in metal concentrations. Granulometry and organic matter were the determining factors of metals concentrations. In the Preto River (urban area), high Zn concentrations are due to anthropic sources, whereas the high levels of total nitrogen, Al, Cr, Cu, Fe, K, Mn, and Ni in the Turvo river (damming, rural area) are due to agricultural runoff. Although lower concentrations of metals were observed at the remaining sites, violations of the guide values for sediment quality, particularly for Cr and Mn, indicate the need for management strategies for the Turvo/Grande Hydrographic Basin.
Keywords: sediments, metals, Turvo/Grande Hydrographic Basin, PCA, FAAS.
Introduction
From an ecological perspective, bottom sediment is an important compartment of the aquatic environment that serves as a habitat and source of nutrients for benthic organisms.1 However, bottom sediment is also significant
because it is the final destination of contaminants in aquatic media. Geoaccumulation involves processes by which contaminants are adsorbed onto suspended particulate material, which causes the sediments to become an
accumulation matrix of pollutants in a water body upon its subsequent deposition.2, 3 Metals are particularly worrisome
contaminants because they are non-degradable, which may lead to bioaccumulation and/or biomagnification, resulting in toxicity in aquatic organisms at high concentrations and consequently leading to ecological imbalance in the aqueous environment.4, 5
Anthropic sources of metals in the water bodies include the discharge of industrial effluents and superficial urban and agricultural runoffs.6-9 Sediments are a critical
changes in physicochemical conditions, such as pH or redox potential, may cause the resuspension of metals in the water column.10 Thus, evaluations of sediment quality
have been incorporated into various environmental studies to facilitate the diagnosis of the level of contamination of aquatic ecosystems. These data also serve as an initial basis for elucidating the level of contamination that aquatic organisms are exposed to.11,12 In addition, each
deposited sediment layer represents the water quality at the moment of deposition. Thus, sediment analysis can be employed to evaluate the pollution history of a water body.13-15
The Turvo/Grande Hydrographic Basin (TGHB), which is located in the northeast region of São Paulo State, is a predominantly agricultural area. The TGHB is home to 25 sugarcane-alcohol industries,16 which together processed
45.7 t of sugarcane in 2011, the second largest production of sugar and alcohol in São Paulo state.17 Sugarcane
plantations occupy 23% of the hydrographic basin area. In addition, an industrial park involving other sectors such as food, furniture, jewelry, metals, and leather industries is currently undergoing expansion and includes over 4000 units.18
Principal Component Analysis (PCA) was used in this study as an exploratory data analysis. This chemometric tool allows the projection of multivariate data in a space of smaller dimension known as principal components. The samples and variables are visualized in this projection as graphs of scores and loadings, respectively. The combination of these two graphs facilitates the visualization and evaluation of the original data. PCA enables conclusions to be drawn about which samples are influenced by certain given variables.
The main TGHB water bodies are the Preto, Turvo, and Grande Rivers. The Preto River contributes approximately 30% of the public water supply of the city of São José do Rio Preto, which has 408,258 inhabitants,19 the largest
population of the hydrographic basin.20 The main factors
that affect the quality of TGHB surface waters are the discharge of domestic sewage (the total remaining charge of biochemical oxygen demand in the basin is 17.56 t day-1)21
and urban and agricultural runoff.22-24 When evaluating the
metal concentrations in the surface waters of TGHB rivers, Melo24 observed concentrations that were occasionally
higher than the maximum permitted values specified by the Brazilian environmental law, resolution number 357 of the National Council for the Environment (Conselho Nacional do Meio Ambiente-CONAMA).25 However, the
level of contamination of sediments by metals has not been well characterized. The most recent data come from the monitoring program of the Environmental Company of
São Paulo State (Companhia Ambiental do Estado de São Paulo-CETESB), which was implemented in 2006 and 2012 at a single site in the Preto River and in one of the tributaries of the TGHB parent rivers.26, 27 Thus, the objective of this
work was to characterize the sediment profiles of the Preto, Turvo, and Grande Rivers and determine the sources of metals with the aid of chemometric tools.
Experimental
Study area
TGHB comprises 64 cities in an area of 15,983 km2,
with a total of 1,424,761 inhabitants.20 The region
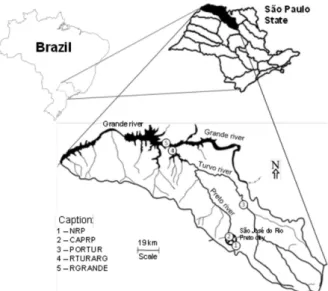
possesses only 1.9% of native arboreal vegetation, which, in combination with agricultural practices, makes the soils susceptible to erosion.28 In this work, five sampling sites
along the Preto, Turvo, and Grande Rivers were selected to study the differences in the characteristics of sediments depending on the area (rural and urban) in which the water bodies are located (Figure 1). The source of the Preto River (NRP; S20°55’11.3”; W049°17’59.9”) was chosen as a reference site in this work and is located in a rural area, close to sugarcane plantation areas. The CAPRP sampling site (S20°48’29.2”; W049°22’24.1”) is located in the Preto River at the site of water harvesting for the public supply of São José do Rio Preto. This sampling site is a lotic-lentic environment that is located in the urban area of this city; the site is heavily silted and receives industrial effluents and diffuse pollution from the urban area.24 By contrast, the
PORTUR sampling site (S20°44’31.8”; W049°06’11.4”) is located in the Turvo River in a rural area, a lotic environment with extended sugarcane planted areas in its vicinity. RTURARG (S19°58’09.8”; W049°53’37.1”) is
also located in the Turvo River, and the RGRANDE site refers to the Grande River after its confluence with the Turvo River. Both sites are located in the damming area of the Água Vermelha Hydroelectric Plant, which lies in an agricultural region (energetic potential of 1396 MW)29
and receives the runoff from this area.22
Collection of samples
Two sets of samples were collected; one was obtained during the wet season (February/2010), and the other was obtained during the dry season (July/2010). In the lentic environments (CAPRP, RTURARG, and RGRANDE), the sediment core samples were collected with the aid of a Kajak-type core sampler containing an acrylic tube with a diameter of 10 cm and a depth of up to 45 cm. In these environments, triplicate sampling was performed on each of the banks and at the center of the water body. In NRP and PORTUR (lotic environment), a Van Veen dredger was used to sample superficial sediments. In the field, the core sediments were sliced into layers with a thickness of 3 cm. Layers of the same depth were then combined and stored in plastic bags, as with the superficial samples. All samples were refrigerated during transport to the laboratory and stored at –18 °C until analysis. The sample collection and preservation procedures were performed according to the recommendations of official methods (Brazilian Standard NBR 9898, EPA 2006).30, 31
Characterization and preparation of samples
The granulometric distribution, elemental composition (CHN), organic matter content (OMC), and pH of the samples were characterized. The granulometric distribution was determined using the pipette method.32
The elemental composition was measured using a CHNOS Analyzer (CE Instruments/EA 1110) with samples previously dried at 50 °C and homogenized in a mortar. The OMC was determined by the loss on ignition method, in which samples are calcinated in an oven at 550 °C for 4 h. The pH was measured using a method adapted from the method for soils proposed by the Brazilian Enterprise for Agricultural Research (Empresa Brasileira de Pesquisa Agropecuária - Embrapa).33 To 2-3 g of sediment, 10 mL
of distilled water was added, and the mixture was stirred for 10 min. The pH was measured by immersing the pH electrode in the mixture immediately after stirring.For metal determination, sediment samples (1-2 g) were digested with nitric acid and hydrogen peroxide (30% v/v) according to method 3050B of the US Environmental Protection Agency.34
Determination of metals
Al, Cr, Cu, Fe, K, Mn, Ni, Pb, and Zn were determined in the samples using a flame atomization atomic absorption spectrometer (FAAS; Varian, 240FS). The repeatability of the methods was verified by analysis of a standard after the analysis of every 10 samples. The accuracy of the methods was evaluated based on analysis of certified reference samples (standard reference material; SRM) of soil (2709a) and sediment (1944), both from the National Institute of Standards and Technology (NIST). In addition, the laboratory in which this work was performed participated in proficiency examinations organized by EMBRAPA, for the determination of metals in samples of vegetal tissue and achieved satisfactory results.
Statistical treatment
Many authors have employed chemometric tools to facilitate the determination of the sources of evaluated metals and to identify the associations between these and other components.9,35-39 In this work, PCA and Pearson
correlation analysis was performed. For the PCA, the metal concentration, total carbon (TC), and total nitrogen (TN) data were organized in a matrix containing 111 samples (including samples collected at different locations, positions, and depths within the water body and different seasons). The remaining variables were not included in the PCA because data were not available for all samples. As a pre-processing step, auto-scaling of the data matrix (141:14) was performed to give the same weight to all variables. After processing, the average and standard deviation of the samples were equal to 0 and 1, respectively. The PCA was performed using the computational program Pirouette 4.0 rev. 2 (Infometrix, Bothell, E.U.A.). All studied variables (excluding the pH) were used for the Pearson correlation analysis, and the correlation matrix was calculated with the Excel software.
Results and discussion
Adaptation of US Environmental Protection Agency method 3050B34 for the determination of metals
The results of the determination of metals in the sample SRM 2709a were in accordance with the certified values, with errors of less than 5%. The obtained limit of detection (LOD) were 0.05, 0.04, 1.17, 0.04, 0.17, 1.10, 3.70, and 0.16 mg kg-1
for Cu, Cr, Fe, K, Mn, Ni, Pb, and Zn, respectively. The limit of quantification (LOQ) of the method were 0.17, 0.13, 3.89, 0.13, 0.57, 3.66, 12.32 and 0.53 mg kg-1 for Cu, Cr, Fe, K,
Sediment characterization
The results of the characterization of the TGHB sediments are listed in Table 1. The pH values of the sediments varied from 5.8 to 7.1 for all samples and periods studied, values that are close to neutrality. According to the textural classification of Shepard,40 the TGHB
samples were classified as silty sand, with the exception of PORTUR, which was classified as sandy. This site is a lotic environment, which disfavors the deposition of fine particles. The OMC, TC, and TN were not remarkably different between the sampling sites, indicating that the locations of the sites and the specific impacts to which they were subject (urban and rural areas) did not interfere with the amount of organic matter accumulated in the sediment. In PORTUR, the low OMC and TC values are related to the sandy granulometry because organic matter associates preferentially with fine sediment fractions.41 In addition,
the vertical distribution of OMC in CAPRP, RTURARG, and RGRANDE indicated higher concentrations in the superficial portions, which may be related to the recent inflow of organic matter in the water bodies. By contrast, the TN values are close to the concentration ranges of Total Kjeldahl Nitrogen in sediments from agricultural regions in São Paulo state (between 0.23 and 0.54%),21 in agreement
with the use characteristics of the TGHB.
Metals in the sediment
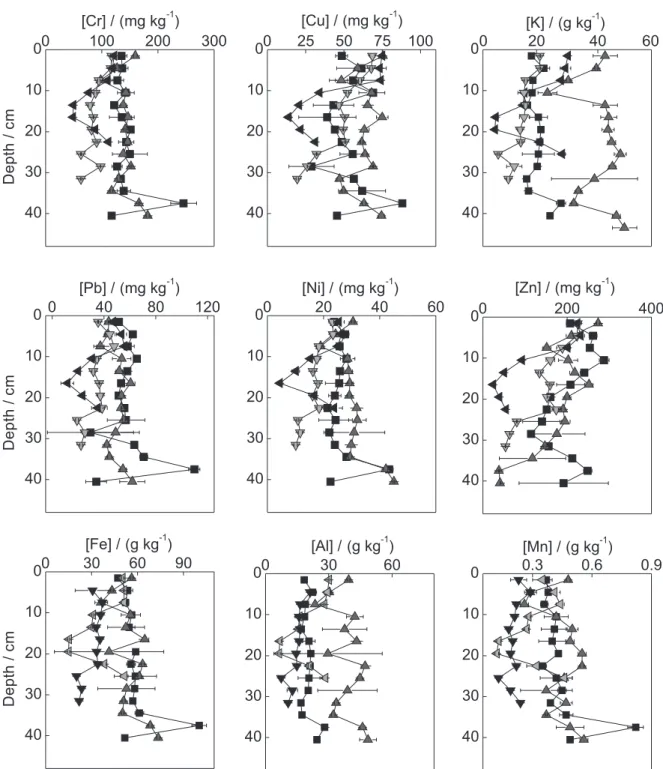
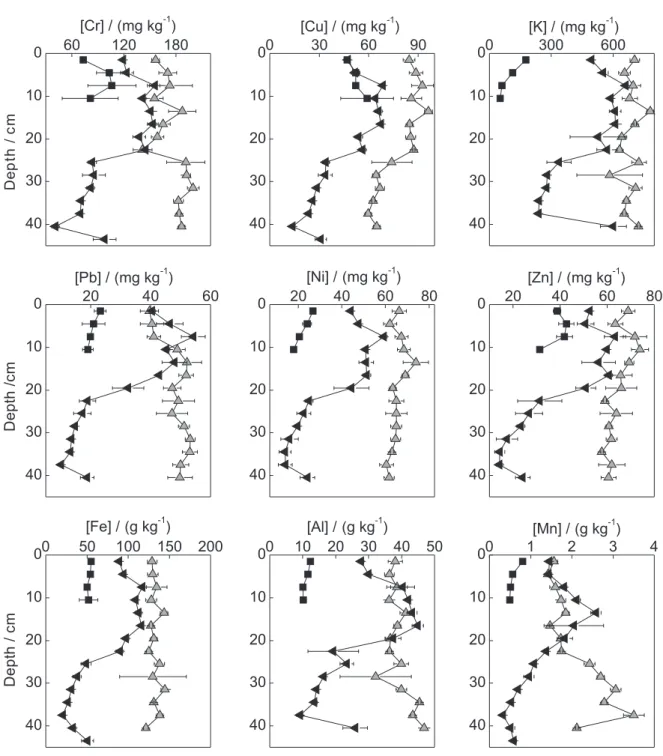
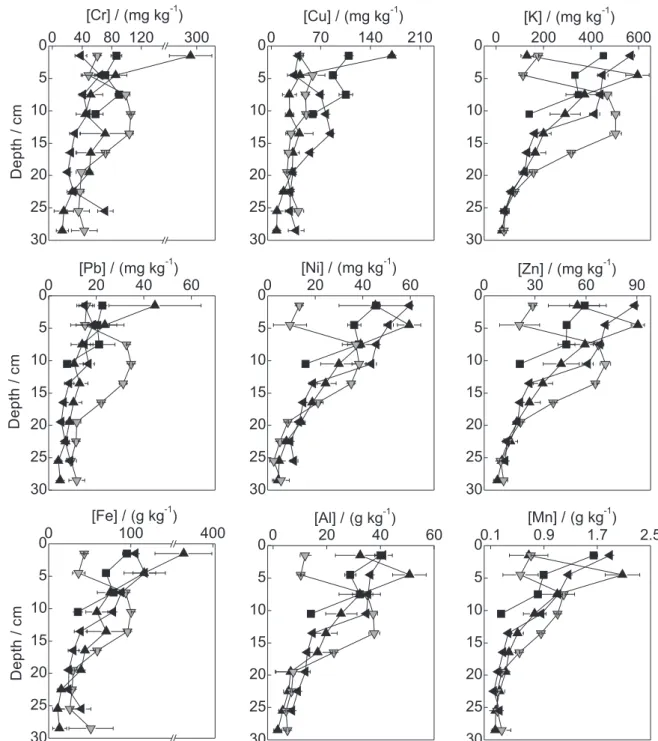
The depth profiles of the metals in the dammed sampling sites CAPRP, RTURARG, and RGRANDE are presented in Figures 2, 3, and 4, respectively. Different profile behaviors were observed between the various sampling sites. Similarly, depending on the collection position (bank or center) within the same water body, different profile patterns were observed, indicating the heterogeneity of the sediment.
Depth profile trends may indicate changes in the quality of the water body over time.13-15 In CAPRP and
RTURARG, a clear trend in the variation of concentration
with depth was not observed. Indeed, the concentrations remained nearly unchanged along the profile, indicating that the inflow of metals in these water bodies was nearly constant. An exception to this behavior was observed for Zn in CAPRP, which increased in concentration in the direction of the superficial layers, suggesting that an increase in the inflow of this metal occurred over the years. In RGRANDE, all metals exhibited trends of increasing concentration in the direction of the superficial layers, in agreement with the behavior of a lentic water body. This increase may be associated with the intensification of deposition of particles after damming of the water body, particularly because this site is located immediately after the confluence with the Turvo River, which carries a large amount of suspended particulate material. Because the Turvo River extends over a large area and is predominantly lotic, this material stems from both the agricultural area and from other regions of the hydrographic basin and reflects different patterns of soil use and urbanization.
PCA of all samples evaluated in this work (Figure 5) clearly demonstrated differences between the sediments of TGHB water bodies and the relationship of the metal concentrations with the TN and TC. Two Principal Components (PC) were extracted, which together corresponded to 66.5% of the total data variance (PC 1: 45.7%; PC 2: 20.8%). The samples can be divided into two groups: one formed by CAPRP, which includes the samples from the center and both banks of the water body, and the other formed by the samples from the left bank of RTURARG and one sample from NRP. The CAPRP samples were also discriminated by the metal Zn (the score and loadings graphs are also represented in this figure); higher Zn concentrations (between 200 and 300 mg kg-1; Figure 2) were observed relative to the other
dammed water bodies (concentrations ranging from 30 to 90 mg kg-1, approximately). This behavior indicates that Zn
has an anthropic origin in CAPRP, which suggests that the increase in the concentration of this metal over time may be related to increasing inflow due to effluent discharges from small metallurgic companies upstream and/or from
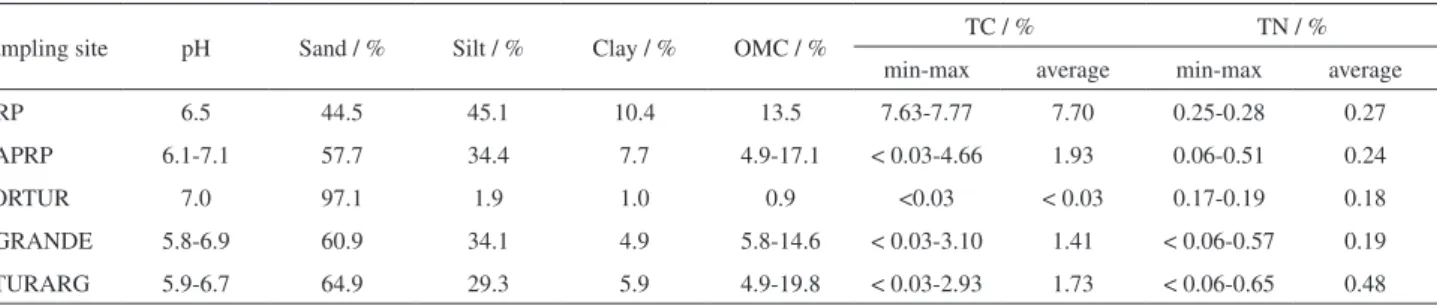
Table 1. pH values, granulometry, organic matter content (OMC), total carbon (TC) and total nitrogen (TN) (in percentage) of the TGHB sediments, considering all samples collected at different positions and sampling periods
Sampling site pH Sand / % Silt / % Clay / % OMC / % TC / % TN / %
min-max average min-max average
NRP 6.5 44.5 45.1 10.4 13.5 7.63-7.77 7.70 0.25-0.28 0.27
CAPRP 6.1-7.1 57.7 34.4 7.7 4.9-17.1 < 0.03-4.66 1.93 0.06-0.51 0.24
PORTUR 7.0 97.1 1.9 1.0 0.9 <0.03 < 0.03 0.17-0.19 0.18
RGRANDE 5.8-6.9 60.9 34.1 4.9 5.8-14.6 < 0.03-3.10 1.41 < 0.06-0.57 0.19
vehicle traffic adjacent to the water body, which generates residues that may contain metals.42-44 Studies in the Brunette
hydrographic basin (Canada) revealed that urban runoff is responsible for the transport of metals such as Zn and Cu into water bodies, both in dissolved form and adsorbed onto particulate material.8
The sediments of the left bank of RTURARG and NRP were affected by PC2 and exhibited high concentrations of Al, Cr, Cu, Fe, K, Mn, TN, and Ni. All of these elements,
with the exception of Ni, Cr, and Cu, are major components of the soil. K and N are also components of fertilizers. In addition, K is present in high concentrations in vinasse, the main byproduct of the sugar and alcohol industry.45 As
resulting from mineral fertilization and fertigation, such as K and N. Another factor that may contribute to the inflow of these metals to the sediment is the high susceptibility of TGHB soils to erosion resulting from agricultural practices without adequate technical criteria. By contrast, in PORTUR, the sediments contained low concentrations of all metals due to the sandy granulometry of the sediments. According to Li et al.,46 the lower superficial area of sand
particles relative to smaller-diameter particles (silt and clay) leads to a low metal accumulation. As shown in Figure 5, the samples of RGRANDE were distributed around the
axis corresponding to PC1. The majority of these samples are located in the negative quadrant of this PC and exhibit low metal concentrations. These samples correspond to sediments of deeper layers. As a dammed environment, the deeper layers of the sediment are composed of the original soil of the region at this sampling site. Although dating data for these sediments are not available, these lower concentrations reflect a smaller anthropic influence and may represent basal values.
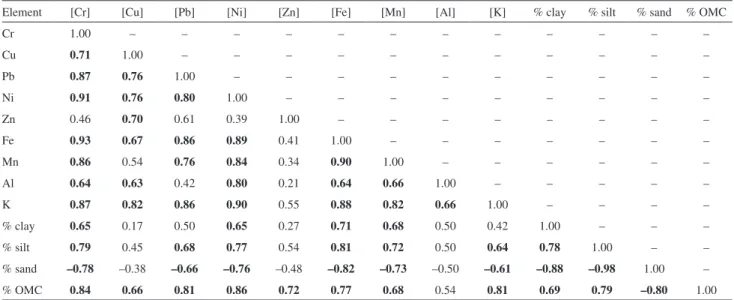
these factors on the retention of metals in the sediment of each of the evaluated lentic environments (Tables S1-3, supplementary information). In CAPRP, all metals, except Cu, Zn, and K showed significant positive correlations with clay and silt contents and negative correlations with the percentage of sand. By contrast, all metals showed strong positive correlations with OMC, with the exception of Al. These results indicate that the metals are mainly associated with fine fractions and organic matter at this sampling site. All metals also showed correlations with Fe, suggesting
that iron oxyhydroxides are part of the metal carriers to the sediment of this water body. However, the absence of a correlation between Zn and other variables corroborates the PCA results, supporting the hypothesis that this metal has an anthropic origin.
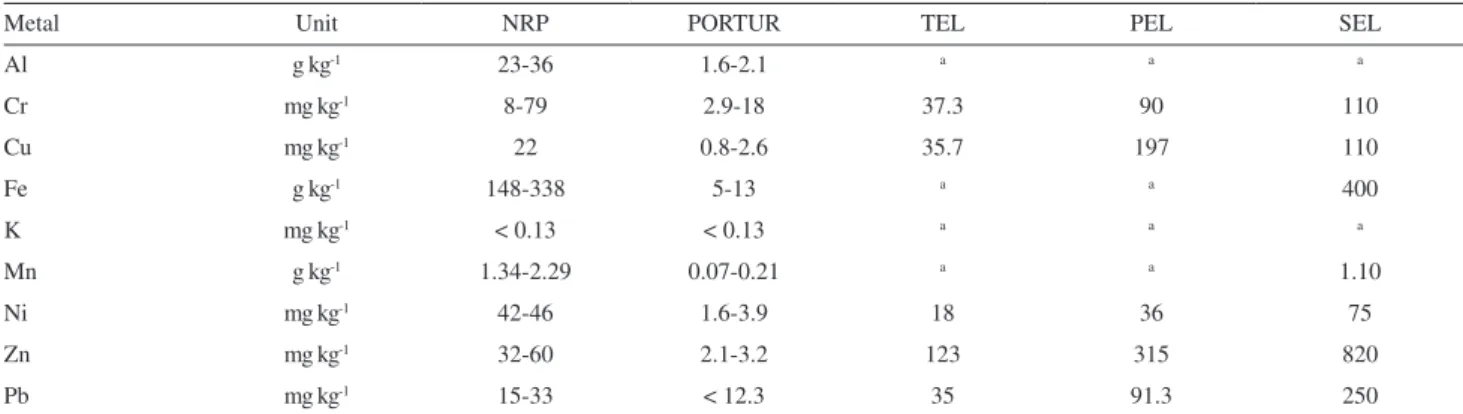
Table 2. Concentration range of metals in the superficial sediments of NRP and PORTUR and TEL and PEL values48,49
Metal Unit NRP PORTUR TEL PEL SEL
Al g kg-1 23-36 1.6-2.1 a a a
Cr mg kg-1 8-79 2.9-18 37.3 90 110
Cu mg kg-1 22 0.8-2.6 35.7 197 110
Fe g kg-1 148-338 5-13 a a 400
K mg kg-1 < 0.13 < 0.13 a a a
Mn g kg-1 1.34-2.29 0.07-0.21 a a 1.10
Ni mg kg-1 42-46 1.6-3.9 18 36 75
Zn mg kg-1 32-60 2.1-3.2 123 315 820
Pb mg kg-1 15-33 < 12.3 35 91.3 250
aNo GVSQ is available for this metal.
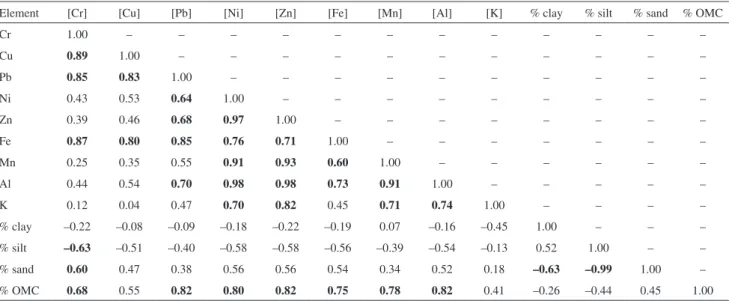
correlations with OMC. Therefore, in RTURARG, the granulometry is the determinant in the metal accumulation, with the metals being associated with particles of fine fractions, whereas in RGRANDE, the metals are mainly retained by organic matter.
Comparison with Guide Values of Sediment Quality
The ranges of metal concentrations found in the superficial sediments of NRP and PORTUR are presented in Table 2 and were compared with the Guide Values of Sediment Quality (GVSQ) established by the Canadian Council of Ministers of the Environment (CCME)47 and
by Buchman,48 which are also shown in Table 2. In lentic
environments, the metal concentrations can be visualized in the depth profiles shown in Figures 2, 3, and 4. In NRP, the concentration range of Cr and Cu was higher than the threshold effect level (TEL), and the concentration range of Ni was higher than the probable effect level (PEL). However, the concentrations of Fe and Mn were close to and higher than the severe effect level (SEL), respectively. Although this site was considered as a reference, it does not have riparian vegetation and is susceptible to impacts stemming from rural properties and sugarcane plantation areas in its vicinity. By
contrast, in PORTUR, all metals were at concentrations below the GVSQ. In CAPRP (Figure 2), the concentrations of Cr and Cu in the profiles were above the PEL, and the metals Ni, Pb, and Zn were above the TEL, although the Zn concentrations were close to the PEL. In RTURARG, the metals Cr and Ni were above the PEL in the profiles, Cu and Pb were above the TEL, and Mn was above the SEL. In RGRANDE, where the concentrations were lower, Cr and Ni also exceeded the PEL in the superficial layers of the sediment, and the concentrations of Mn were above the SEL in these layers. Based on these results, the metals Cr and Mn are of greatest concern in the TGHB because are more frequently present at concentrations that violate the GVSQ PEL and SEL, respectively. These metals may be resuspended in the water column when the physicochemical conditions of the sediment are perturbed or altered, which may compromise the water quality.10 This is important
because the waters of one of the sampling sites (CAPRP) are destined for public water supplies and are eventually subjected to desilting works.
Conclusion
levels are important because perturbations in the sediment may compromise the quality of water destined for public supplies. Thus, effective management measures are needed for the TGHB. Although some values violated the GVSQ, ecotoxicological tests are needed to confirm and evaluate the risk of these contaminants to the aquatic biota.
Supplementary Information
Supplementary data are available free of charge at http://jbcs.sbq.org.br as PDF file.
Acknowledgements
The authors would like to thank the São Paulo Research Foundation (Fundação de Amparo a Pesquisa do Estado de São Paulo - FAPESP), processes 2012/23066-4, 2010/09271-9 and 2009/12147-0, for financial support of this project.
References
1. http://www.sednet.org/download/SedNet_strategic_ paper_2004.pdf accessed in October 2012.
2. Cortecci, G.; Boschetti, T.; Dinelli, E.; Cidu, R.; Podda, F.; Doveri, M.; Appl. Geochem.2009, 24, 1005.
3. Dessai, D. V. G.; Nayak, G. N.; Basavaiah, N.; Estuar. Coast. Shelf S. 2009,85, 307.
4. Farag, A.; Nimick, D.; Kimball, B.; Church, S.; Harper, D.; Brumbaugh, W.; Arch. Environ. Con. Tox.2007, 52, 397.
5. Yi, Y.; Wang, Z.; Zhang, K.; Yu, G.; Duan, X.; Int. J. Sed. Res. 2008, 23, 338.
6. Kaushik, A.; Kansal, A.; Santosh; Meena; Kumari, S.; Kaushik, C. P.; J. Hazard. Mater.2009, 164, 265.
7. Tang, W.; Shan, B.; Zhang, H.; Mao, Z.; J. Hazard. Mater.2010,
176, 945.
8. Li, L.; Hall, K.; Yuan, Y.; Mattu, G.; McCallum, D.; Chen, M.;
Water, Air, Soil Pollut.2009, 197, 249.
9. N’Guessan, Y. M.; Probst, J. L.; Bur, T.; Probst, A.; Sci. Total Environ.2009, 407, 2939.
10. Eggleton, J.; Thomas, K. V.; Envinron. Int.2004, 30, 973. 11. Cardoso, A. G. A.; Boaventura, G. R.; Silva, E. V.; Brod, J. A.;
J. Braz. Chem. Soc.2001, 12, 767.
12. Bordon, I.; Sarkis, J. E. S.; Gobbato, G. M.; Hortellani, M. A.; Peixoto, C. M.; J. Braz. Chem. Soc.2011, 22, 1858.
13. Di Leonardo, R.; Tranchida, G.; Bellanca, A.; Neri, R.; Angelone, M.; Mazzola, S.; Chemosphere2006, 65, 2366. 14. Mil-Homens, M.; Branco, V.; Vale, C.; Boer, W.; Alt-Epping, U.;
Abrantes, F.; Vicente, M.; Cont. Shelf Res.2009, 29, 381. 15. Di Leonardo, R.; Vizzini, S.; Bellanca, A.; Mazzola, A.;
J. Marine Syst.2009, 78, 136.
16. http://www.energia.sp.gov.br/a2sitebox/arquivos/ documentos/104.jpg accessed in October 2012.
17. h t t p : / / w w w. e n e rg i a . s p . g ov. b r / p o r t a l . p h p / r eg i o e s -administrativas# accessed in October 2012.
18. http://www.riopreto.sp.gov.br/PortalGOV/SubportaisDownload ?tp=geral&i=59836 accessed in October 2012.
19. http://www.ibge.gov.br/cidadesat/link.php?codmun=354980 accessed in October 2012.
20. http://www.grande.cbh.gov.br/UGRHI15.aspx, acessed in January 2014
21. http://www.cetesb.sp.gov.br/userfiles/file/agua/aguas-superficiais/relatorio-aguas-superficiais-2011.zip accessed in October 2012.
22. Campanha, M. B.; Melo, C. A.; Moreira, A. B.; Ferrarese, R.; Tadini, A. M.; Garbin, E. V.; Bisinoti, M. C.; Pereira, E. R.;
Quim. Nova2010, 33, 1831.
23. Melo, C. D.; Moreira, A. B.; Bisinoti, M. C.; Quim. Nova2009,
32, 1436.
24. Melo, C. A.; Campanha, M. B.; Ferrarese, R. F. M. S.; Tadini, A. M.; Bisinoti, M. C.; Moreira, A. B.; Yabe, M. J. S. In Sustainable Water Management in the Tropics and Subtropics - and Case
Studies in Brazil; Bilibio, C.; Hensel, O.; Selbach, J., eds;
Fundação Universidade Federal do Pampa, UNIKASSEL, PGCult-UFMA: Jaguarão, Brazil, 2012, vol. 3, ch. 17. 25. http://www.mma.gov.br/port/conama/res/res04/res34404.xml
accessed in October 2012.
26. http://www.cetesb.sp.gov.br/media/files/Agua/relatorios/ rios/rel_aguas_int_2003/relatorio_anual_aguas_int_2003.zip accessed in October 2012.
27. http://www.cetesb.sp.gov.br/Agua/relatorios/rios/rel_aguas_ int_2006/relatorio_2006.zip accessed in October 2012. 28. h t t p : / / w w w. g r a n d e . c b h . g o v. b r / _ d o c s / o u t r o s /
DiagnosticodaSituacaodosRHnoRioGrande.pdf accessed in October 2012.
29. http://www.sigrh.sp.gov.br/sigrh/ARQS/RELATORIO/ CRH/1063/ugrhi_15_22.pdf accessed in October 2012. 30. ABNT. NBR 9898: Preservação e Técnicas de Amostragem
de Efluentes Líquidos e Corpos Receptores, Rio de Janeiro,
1987
31. United States Environmental Protection Agency (US EPA) - Method 2016; Sediment Sampling, 1994.
32. Kairytė, M.; Stevens, R. L.; Mar. Geol.2009, 257, 87.
33. Empresa Brasileira de Pesquisa Agropecuária (EMBRAPA);
Manual de métodos de análise de solos, 2nd ed., Rio de Janeiro, 1997.
34. United States Environmental Protection Agency (US EPA) - Method 3050B; Acid Digestion of Sediments, Sludges and Soil, 1996.
36. Krishna, A. K.; Satyanarayanan, M.; Govil, P. K.; J. Hazard. Mater.2009, 167, 366.
37. Passos, E. D.; Alves, J. C.; dos Santos, I. S.; Alves, J. D. H.; Garcia, C. A. B.; Costa, A. C. S.; Microchem. J.2010, 96, 50.
38. Amano, A.; Kuwae, M.; Agusa, T.; Omori, K.; Takeoka, H.; Tanabe, S.; Sugimoto, T.; Mar. Environ. Res.2011, 71, 247.
39. Loska, K.; Wiechuła, D.; Chemosphere2003, 51, 723. 40. Shepard, F. P.; J. Sediment. Petrol.1954, 24, 8.
41. Sageman, B. B.; Lyons, T. W. In Treatise on Geochemistry; Mackenzie, F. T., ed.; Elsevier: Oxford, United Kingdom, 2005, vol. 7, ch. 7.
42. Adachi, K.; Tainosho, Y.; Envinron. Int.2004, 30, 1009.
43. Sezgin, N.; Ozcan, H. K.; Demir, G.; Nemlioglu, S.; Bayat, C.;
Envinron. Int.2004, 29, 979.
44. Wang, Y. F.; Huang, K. L.; Li, C. T.; Mi, H. H.; Luo, J. H.; Tsai, P. J.; Atmos. Environ.2003, 37, 4637.
45. Christofoletti, C. A.; Escher, J. P.; Correia, J. E.; Marinho, J. F. U.; Fontanetti, C. S.; WasteManage. 2011, 71, 2752.
46. Li, G.; Cao, Z.; Lan, D.; Xu, J.; Wang, S.; Yin, W.; Environ. Geol.2007, 52, 1559.
47. http://st-ts.ccme.ca/?chems=all&chapters=3&pdf=1, accessed in January 2014.
48. http://response.restoration.noaa.gov/sites/default/files/ SQuiRTs.pdf accessed in October 2012.
Submitted on: October 16, 2013
Published online: January 21, 2014
Supplementary Information
0103 - 5053 $6.00+0.00S
I
*e-mail: [email protected]
Use of Chemometric Tools to Determine the Source of Metals in Sediments of the
Rivers of the Turvo/Grande Hydrographical Basin, São Paulo State, Brazil
Mariele B. Campanha,a João Paulo Romera,a Jéssica Coelho,a Edenir R. Pereira-Filho,b
Altair B. Moreiraa and Márcia C. Bisinoti*,a
aDepartment of Chemistry and Environmental Sciences, Institute of Biosciences, Literature and
Exact Sciences, São Paulo State University “Júlio de Mesquita Filho” (UNESP), R. Cristóvão Colombo 2265, 15054-000 São José do Rio Preto-SP, Brazil
bDepartment of Chemistry,Federal University of São Carlos,
Rod. Washington Luiz Km 235, 13565-905 São Carlos-SP, Brazil
Table S1. Pearson correlation coefficients (r) for metals, granulometry, and OMC of sediments samples from CAPRP for all periods studied
Element [Cr] [Cu] [Pb] [Ni] [Zn] [Fe] [Mn] [Al] [K] % clay % silt % sand % OMC
Cr 1.00 – – – – – – – – – – – –
Cu 0.71 1.00 – – – – – – – – – – –
Pb 0.87 0.76 1.00 – – – – – – – – – –
Ni 0.91 0.76 0.80 1.00 – – – – – – – – –
Zn 0.46 0.70 0.61 0.39 1.00 – – – – – – – –
Fe 0.93 0.67 0.86 0.89 0.41 1.00 – – – – – – –
Mn 0.86 0.54 0.76 0.84 0.34 0.90 1.00 – – – – – –
Al 0.64 0.63 0.42 0.80 0.21 0.64 0.66 1.00 – – – – –
K 0.87 0.82 0.86 0.90 0.55 0.88 0.82 0.66 1.00 – – – –
% clay 0.65 0.17 0.50 0.65 0.27 0.71 0.68 0.50 0.42 1.00 – – –
% silt 0.79 0.45 0.68 0.77 0.54 0.81 0.72 0.50 0.64 0.78 1.00 – –
% sand –0.78 –0.38 –0.66 –0.76 –0.48 –0.82 –0.73 –0.50 –0.61 –0.88 –0.98 1.00 –
% OMC 0.84 0.66 0.81 0.86 0.72 0.77 0.68 0.54 0.81 0.69 0.79 –0.80 1.00
Table S2. Pearson correlation coefficients (r) for metals, granulometry, and OMC of samples of sediment from RTURARG for all periods studied
Element [Cr] [Cu] [Pb] [Ni] [Zn] [Fe] [Mn] [Al] [K] % clay % silt % sand % OMC
Cr 1.00 – – – – – – – – – – –
Cu 0.82 1.00 – – – – – – – – – –
Pb 0.52 0.79 1.00 – – – – – – – – –
Ni 0.41 0.73 0.95 1.00 – – – – – – – –
Zn 0.54 0.75 0.92 0.95 1.00 – – – – – – –
Fe 0.31 0.59 0.68 0.60 0.58 1.00 – – – – – –
Mn 0.79 0.53 0.22 0.05 0.23 0.14 1.00 – – – – –
Al 0.76 0.69 0.34 0.15 0.27 0.50 0.80 1.00 – – – –
K –0.08 –0.16 –0.18 –0.18 –0.24 –0.04 –0.12 0.04 1.00 – – –
% clay 0.75 0.68 0.54 0.30 0.38 0.87 0.79 0.86 0.79 1.00 – –
% silt 0.42 0.31 0.23 –0.10 –0.03 0.66 0.71 0.76 0.79 0.83 1.00 –
% sand –0.53 –0.42 –0.32 –0.01 –0.08 –0.74 –0.76 –0.81 –0.82 –0.90 –0.99 1.00
% OMC –0.08 –0.13 –0.19 –0.39 –0.40 0.19 0.24 0.31 0.61 0.77 0.78 –0.82 1.00
Highlighted values are significant at the level of 0.01.
Table S3. Pearson correlation coefficients (r) for metals, granulometry, and OMC of samples of sediment from RGRANDE for all periods studied
Element [Cr] [Cu] [Pb] [Ni] [Zn] [Fe] [Mn] [Al] [K] % clay % silt % sand % OMC
Cr 1.00 – – – – – – – – – – – –
Cu 0.89 1.00 – – – – – – – – – – –
Pb 0.85 0.83 1.00 – – – – – – – – – –
Ni 0.43 0.53 0.64 1.00 – – – – – – – – –
Zn 0.39 0.46 0.68 0.97 1.00 – – – – – – – –
Fe 0.87 0.80 0.85 0.76 0.71 1.00 – – – – – – –
Mn 0.25 0.35 0.55 0.91 0.93 0.60 1.00 – – – – – –
Al 0.44 0.54 0.70 0.98 0.98 0.73 0.91 1.00 – – – – –
K 0.12 0.04 0.47 0.70 0.82 0.45 0.71 0.74 1.00 – – – –
% clay –0.22 –0.08 –0.09 –0.18 –0.22 –0.19 0.07 –0.16 –0.45 1.00 – – –
% silt –0.63 –0.51 –0.40 –0.58 –0.58 –0.56 –0.39 –0.54 –0.13 0.52 1.00 – –
% sand 0.60 0.47 0.38 0.56 0.56 0.54 0.34 0.52 0.18 –0.63 –0.99 1.00 –
% OMC 0.68 0.55 0.82 0.80 0.82 0.75 0.78 0.82 0.41 –0.26 –0.44 0.45 1.00