Article
J. Braz. Chem. Soc., Vol. 25, No. 11, 1948-1955, 2014. Printed in Brazil - ©2014 Sociedade Brasileira de Química 0103 - 5053 $6.00+0.00
A
*e-mail: [email protected]
Chemometric Approach in Studying of the Retention Behavior and Lipophilicity of
Potentially Biologically Active
N
-Substituted-2-phenylacetamide Derivatives
Gyöngyi Gy. Vastag,*,a Suzana Lj. Apostolov,a Borko M. Matijevića and
Aleksandar D. Marinkovićb
aUniversity of Novi Sad, Faculty of Sciences, Department of Chemistry, Biochemistry and Environmental Protection, Trg D. Obradovića 3, 21000 Novi Sad, Serbia
bUniversity of Belgrade, Faculty of Technology and Metallurgy, Karnegijeva 4, 11000 Belgrade, Serbia
A atividade biológica potencial de moléculas depende largamente da sua lipofilicidade. A lipofilicidade de derivados de 2-fenilacetamida N-substituída foi investigada experimentalmente, aplicando cromatografia em camada delgada em fase inversa (RP-TLC em RP 18 F254s) na presença de etanol e de dioxano, e usando pacotes de software. A fim de estabelecer a dependência entre a lipofilicidade obtida de diferentes formas foram usados análise de regressão linear e métodos multivariados. Agrupamentos aproximadamente semelhantes dos parâmetros lipofílicos e dos compostos testados foram registados no caso de ambos os métodos quimiométricos usados. Todos os resultados obtidos confirmam o fato de que as análises de regressão linear e multivariada aplicadas oferecem oportunidades para comparar os dados sobre a retenção cromatográfica e parâmetros lipofílicos dos derivados de fenilacetamida investigados. Os resultados sugerem que a lipofilicidade das moléculas estudadas depende largamente da natureza dos substituintes ligados ao átomo de nitrogênio e, por outro lado, que as constantes retenção cromatográfica, RM0, determinada pelo método de RP-TLC, são semelhantes à medida padrão de lipofilicidade, log P, o que torna este método adequado para a previsão de lipofilicidade.
The potential biological activity of a molecule largely depends on its lipophilicity. The lipophilicity of derivatives of N-substituted-2-phenylacetamide was investigated experimentally, by applying thin-layer chromatography on reversed phase (RP-TLC on RP 18 F254s) in the presence of ethanol and dioxane and by using relevant software packages. In order to establish dependence between lipophilicity obtained in different ways, linear regression analysis and multivariate methods were used. Approximately similar groupings of lipophilic parameters and tested compounds were registered in case of both chemometric methods. The obtained results confirm the fact that the applied linear regression analysis and multivariate analysis provide opportunities for comparing chromatographic retention data and lipophilic parameters of the investigated phenylacetamide derivatives. Results suggest that the lipophilicity of investigated molecules largely depends on the nature of the substituents linked to nitrogen atom and on the other hand that the chromatographic retention constants, RM0, determined by RP-TLC method, are similar to the standard measure of lipophilicity, log P, which makes this method appropriate for predicting lipophilicity.
Keywords:N-substituted-2-phenylacetamides, lipophilicity, RP-TLC, chemometrics
Introduction
Amides as a large group of organic molecules show a wide range of biological activities. Among them, phenylacetamide derivatives play an important role, due to their application in human, veterinary and plant medicine.
They are known for their analgesic,1 anti-microbial,2 anti-convulsant,3 anti-arrhythmic,4 anti-tuberculotic,5 and anti-tumor activities.6,7 Generally, the type and intensity of biological activities of phenylacetamides depend strongly on the nature of the substituent attached to the basic molecule.8
examined compound provides the opportunity to identify its potential bioactivity. The selection of structural parameters that are important for the behavior of molecules in a biological medium is facilitated by applying the quantitative structure-activity relationship (QSAR), the quantitative structure-property relationship (QSPR) and the quantitative structure-retention relationship (QSRR) models.
Lipophilicity is one of the most significant molecular descriptor of compounds, which indicates the biological activity of substance, thus determining its transport through a biological system. In the pharmaceutical and environmental chemistry, it is widely used for predicting the relationship between the biological activity and chemical behavior of a substance.9 In most cases, lipophilicity can be quantitatively characterized as log P (the logarithm of the ratio of the concentrations of solute in a saturated 1-octanol-water system).10,11 This parameter is often used as a descriptor in QSAR studies.12 Along with many traditional methods for the determination of molecule lipophilicity, reversed phase thin-layer chromatography (RP-TLC) plays an important role due to its simplicity, possibility of examination of a large number of samples in small quantities, reproducibility and the modest price. The chromatographic retention constant, RM0, obtained in reversed phase thin-layer chromatography is widely used as a measure of lipophilicity, together with reference lipophilic parameter log P.13-18
The aim of this study was to investigate the chromatographic behavior of N-substituted-2-phenylacetamide derivatives using thin-layer chromatography on a reversed phase. The effects of the substituent in tested molecules and the influence of the used organic solvent were investigated as well. In order to examine and visualize similarities and differences between chromatographically and mathematically obtained lipophilicity and grouping of the compounds based on chemical properties of functional groups, linear regression analysis (LR) and two multivariate analysis, cluster analysis (CA) and principal component analysis (PCA), were performed.
The cluster analysis is a convenient method for dividing a group of objects into classes (clusters) based on their similarity.19 CA searches for objects which are close together in the variable spaces and puts them into the same cluster. There are many methods for searching for clusters. Hierarchical cluster analysis begins by considering each object as a cluster of size one and compares the distances between clusters. The two points which are closest together are joined to form a new cluster. This procedure is repeated and if continued indefinitely, will result in grouping all the points together.
There are different ways of calculating the distance between two clusters containing more than one member
(single linkage, complete linkage, average linkage, Ward’s method, etc.). Successive stages of grouping can be shown on a dendrogram. The vertical axis of a dendrogram is a measure of similarity between two objects in obtained clusters. Non-hierarchical cluster analysis is the opposite of hierarchical cluster analysis.
Principal component analysis (PCA) is a powerful technique which is used for reducing the amount of data without much loss of information.19 The idea of PCA is to find the new variables, principal components (PC), which are linear combinations of the original variables. In mathematical terms the principal components are the eigenvectors of the covariance matrix. Corresponding to each PC (eigenvector) is an eigenvalue, which gives the amount of variance in the data set which is explained by that principal component. The principal components are formed in a way that, unlike the original variables, they are not correlated with each other. However, the principal components are also chosen so that the first principal component (PC1) accounts for most of the variation in the data set, while the second (PC2) accounts for the next largest variation and so on. Hence, when significant correlation occurs, the number of useful PCs is much smaller then the number of original variables. Usually, two PCs are sufficient to describe most of the retention data variations in the chromatographic retention data analysis.20
Experimental
The structures of the examined phenylacetamide derivatives are presented in Figure 1.
Pre-coated RP-18W/UV254 plates (Macherey-Nagel GmbH and Co., Duren, Germany) were used as a stationary phase. Solutions for chromatographic investigations were prepared by dissolving 2 mg mL-1 of compounds in ethanol. Mixtures of liquid chromatography (LC) grade organic modifiers (J. T. Baker, Deventer, the Netherlands) and filtered bi-distilled water were used as mobile phase. On the plates were spotted aliquots of 0.2 µL of freshly prepared solutions and the migration distance was 5 cm. Plates were developed in normal unsaturated chambers at room temperature by ascending technique with aqueous solutions of two organic modifiers: ethanol (ϕ= 0.36-0.52, v/v) and dioxane (ϕ = 0.30-0.52, v/v). After development and drying, the plates were examined under the UV light at λ = 254 nm as dark spots. At least three chromatograms were developed for each combination of solvent-solute and the average Rfvalues were calculated.
Chemistry Laboratory, VCCLAB.21 The CA and PCA procedures were performed by Statistica v.12 software (StatSoft Inc., Tulsa, OK, USA).
Results and Discussion
Determination of the retention behavior of the investigated
N-substituted-2-phenylacetamide derivatives
In order to determine the retention behavior of the tested N-substituted-2-phenylacetamide derivatives experimentally, high performance thin-layer chromato-graphy (HPTLC) on reversed phase RP 18 F254s was used in the presence of one protic solvent (ethanol) and one aprotic solvent (dioxane). The retention behavior of the investigated compounds in the selected mixture of solvents is presented in Table 1.
From the results presented in Table 1 it is evident that the retention behavior of the investigated N -substituted-2-phenylacetamide derivatives is affected by the nature of the
substituent –R related to the nitrogen atom of the amide group, as well as the used organic modifier. This can be explained by a different interaction that occurs between the tested compounds and the applied organic solvent during chromatographic analysis. Two kinds of interactions are dominant in the case of the investigated compounds: hydrophobic interactions of substituent –R with the non-polar stationary phase and non-polar interactions of the amide group with mobile phase. By observing the obtained Rf values of the same compound in different organic modifiers it is obvious that there exists no noticeable difference between them. This phenomenon can be explained by the more pronounced interactions between solute and polar mobile phase compared to the interaction of solute with non-polar stationary phase.
The retention data in Table 1 show that the retention of compounds depends more on the nature of the substituent on the nitrogen atom than on the selected organic solvent. From all the physicochemical properties, which may affect the chromatographic behavior of these compounds, the polarity of substituent –R related to the nitrogen atom of the amide group and its electron moving abilities are the most responsible parameters for the different behavior of the investigated molecules in the analyzed systems. The polarity of substituent –R related to the nitrogen atom of the amide group influences the possibilities of the molecule to achieve interaction with stationary chromatographic phases. Therefore, this physicochemical property has the greatest impact on retention of the investigated derivatives in the analyzed conditions. For example, compound 11 in both applied modifiers exhibits the lowest retention, because it has benzenesulfonic acid as a substituent, which provides its greater polarity compared to other compounds. Unlike Figure 1. Structures of the investigated N-substituted-2-phenylacetamides.
Table 1. Rf values of N-substituted-2-phenylacetamide derivatives in the C-18 RP-TLC stationary phase in a variety of mobile phases containing 40% organic modifier and 60% water
Compound
Modifier
Ethanol Dioxane
Rf
1 0.27 0.28
2 0.10 0.12
3 0.24 0.30
4 0.30 0.36
5 0.11 0.18
6 0.42 0.42
7 0.34 0.45
8 0.65 0.60
9 0.88 0.86
10 0.51 0.51
compound 11, compound 2 has the most pronounced retention in all applied organic solvents, achieving the strongest interaction with non-polar stationary phase. This is possibly the consequence of the presence of a hydrophobic biphenyl substituent. Molecules 3 and 4
differ in the presence of methyl group in the structures that leads to a greater retention of compound 3, which is typical for reversed phase chromatography. Compound 7, which differs from molecule 4 by the –CH2 group, as expected has faster movement through the non-polar stationary phase, i.e., lower retention.
On the other hand, compounds with heterocyclic substituent (1, 3, 4, 5, 6, 7, 8 and 10) in contrast to compounds with aromatic rings (2, 9, 11) have the strong electron withdrawing effect.22 Consequently, the amide group in the presence of a heterocyclic substituent achieved different interaction with polar mobile phase than in the presence of aromatic rings, which causes the separation of these compounds during TLC. This phenomenon becomes visible in the correlation retention properties of the investigated compounds with standard measure of lipophilicity.
Experimental lipophilicity of the studied N -substituted-2-phenylacetamide derivatives was determined by thin-layer chromatography on reversed phase in the presence of different amounts of used solvents. Based on the experimentally determined Rf values for each composition of the mixture, RM values were calculated using equation 1:
RM = log (1/Rf – 1) (1)
Calculated RM values were extrapolated to zero concentration of organic modifier using the following equation:
RM = RM0 + mϕ (2)
where ϕis the volume fraction of the organic solvent in the mobile phase, m is the slope of a linear plot and the intercept is the retention constant, RM0.
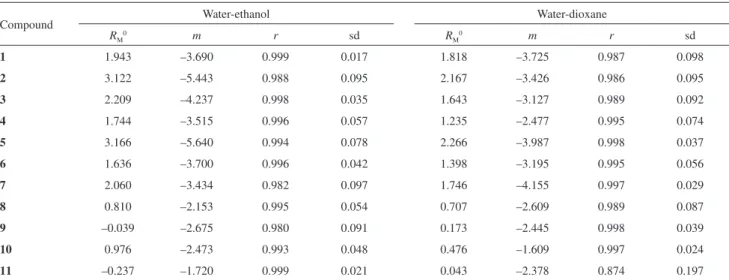
These equations were applied individually on each compound in both modifiers and good linear relationships were obtained. The results for the obtained correlation are presented in Table 2. The validity of linear dependences in the selected field of work for all tested organic modifiers is confirmed with high values of the correlation coefficients, r.
Determination of the lipophilicity of N -substituted-2-phenylacetamide derivatives using mathematical methods
The standard measure of lipophlilicity, log P, of the investigated compounds was calculated by using VCCLAB.
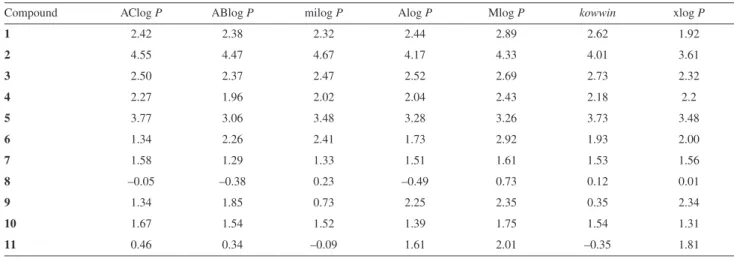
Data shown in Table 3 indicate different values of partition coefficient, log P, of the investigated compounds, probably because of the different ways of calculating this parameter. The highest value of partition coefficient was obtained for compound 2, as was also chromatographically registered, and the lowest value in most cases was obtained for compound 8. This fact is different from the experimental results, where the lowest lipophilicity was registered for compound 11.
Correlation between the retention constant, RM
0, and the
standard measure of lipophilicity, log P
Given that the retention constant, RM0, describes the overall effect of the intermolecular interaction of the compound with the stationary and mobile phases, it has been confirmed that this chromatographic parameter
Table 2. Extrapolated RM0 values, slope (m), correlation coefficients (r), and the standard deviation of estimation (sd), of TLC equations RM = RM0 + mϕ
Compound Water-ethanol Water-dioxane
RM0 m r sd RM0 m r sd
1 1.943 –3.690 0.999 0.017 1.818 –3.725 0.987 0.098
2 3.122 –5.443 0.988 0.095 2.167 –3.426 0.986 0.095
3 2.209 –4.237 0.998 0.035 1.643 –3.127 0.989 0.092
4 1.744 –3.515 0.996 0.057 1.235 –2.477 0.995 0.074
5 3.166 –5.640 0.994 0.078 2.266 –3.987 0.998 0.037
6 1.636 –3.700 0.996 0.042 1.398 –3.195 0.995 0.056
7 2.060 –3.434 0.982 0.097 1.746 –4.155 0.997 0.029
8 0.810 –2.153 0.995 0.054 0.707 –2.609 0.989 0.087
9 –0.039 –2.675 0.980 0.091 0.173 –2.445 0.998 0.039
10 0.976 –2.473 0.993 0.048 0.476 –1.609 0.997 0.024
can be used to express and determine lipophilicity. In order to establish the dependence between the standard measures of lipophilicity (log P) calculated in different ways, and experimentally determined lipophilicity (chromatographic retention constants, RM0), these two values were correlated using a linear regression analysis and different multivariate analysis. The multivariate approach has also often been applied to obtain lipophilicity from the chromatographic retention data.23-28 Two of the most frequently used multivariate methods for the recognition and the classification of the obtained experimental data and determination of the relationships between them are cluster analysis (CA) and principal component analysis (PCA).29-32
The correlation results obtained by using the linear regression analysis for one of the calculated lipophilicity values, AClog P, and chromatographic retention constants, RM0, obtained in dioxane are presented in Figure 2.
As Figure 2 shows, the investigated compounds are grouped into two groups. One group comprises molecules with an aromatic group as substituent (2, 9, 10 and 11), while the second group consists of phenylacetamide derivatives that have a heterocyclic ring as a substituent (1, 3, 4, 5, 6, 7 and 8) related to the nitrogen atom of the amide group. A similar distribution of the tested parameters occurred during the chromatographic retention constant determined in ethanol. The correlation matrix calculated
for various log P and RM0 for the investigated compounds using linear regression analysis is shown in Table 4.
The results presented in Table 4 confirm that good linear relationships exist between retention constants, RM0, obtained by reversed-phase thin layer chromatography and computationally obtained log P coefficients. Much better correlation is registered in the case of compounds which have an aromatic ring as a substituent. The best relationship in most cases was obtained for the correlation between RM0 in both modifiers and kowwin, and the lowest was registered between RM0 and Mlog P (Table 4).
Good linear relationships registered between chromato-graphic retention constants, RM0, in both modifiers and Table 3. Different computational log P values calculated for the investigated N-substituted-2-phenylacetamides
Compound AClog P ABlog P milog P Alog P Mlog P kowwin xlog P
1 2.42 2.38 2.32 2.44 2.89 2.62 1.92
2 4.55 4.47 4.67 4.17 4.33 4.01 3.61
3 2.50 2.37 2.47 2.52 2.69 2.73 2.32
4 2.27 1.96 2.02 2.04 2.43 2.18 2.2
5 3.77 3.06 3.48 3.28 3.26 3.73 3.48
6 1.34 2.26 2.41 1.73 2.92 1.93 2.00
7 1.58 1.29 1.33 1.51 1.61 1.53 1.56
8 –0.05 –0.38 0.23 –0.49 0.73 0.12 0.01
9 1.34 1.85 0.73 2.25 2.35 0.35 2.34
10 1.67 1.54 1.52 1.39 1.75 1.54 1.31
11 0.46 0.34 –0.09 1.61 2.01 –0.35 1.81
Figure 2. Relationships between AClog P values and retention constant,
RM0, in dioxane
Table 4. Correlation matrix for RM0 and different log P: RM0 = a + b log P
Modifier AClog P ABlog P milog P Alog P Mlog P kowwin xlog P
Ethanola 0.988 0.950 0.994 0.982 0.996 0.995 0.972
Ethanolb 0.874 0.861 0.839 0.858 0.746 0.898 0.900
Dioxanea 0.988 0.952 0.989 0.917 0.937 0.972 0.837
Dioxaneb 0.878 0.825 0.820 0.882 0.735 0.876 0.841
the partition coefficients, log P, as a standard measure for lipophilicity of the examined compounds, confirm that the results obtained by the thin-layer chromatography on reversed phase can be used successfully as a measure of lipophilicity of the newly synthesized N -substituted-2-phenylacetamide derivatives.
In addition to the method of linear regression, correlation of the measured parameters of lipophilicity was also preformed by applying different multivariate methods: cluster analysis (CA) and principal component analysis (PCA).
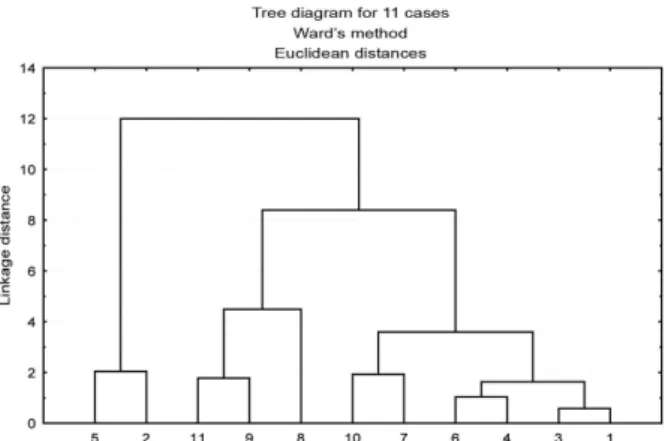
The CA and PCA procedures were performed on the data matrix, where the rows (cases) correspond to the phenylacetamide derivatives, whereas the columns (variables) correspond to the lipophilicity calculated in different ways. In the cluster analysis the Euclidean distance was used as the measure of dissimilarity between objects, and Ward’s linkage method was applied to test the linkage measurement.
The results obtained by using cluster analysis for different parameters of lipophilicity are presented in Figure 3, and for the investigated compounds in Figure 4.
According to the results presented in Figure 3, the cluster analysis has grouped different lipophilic parameters into two clusters. The first cluster includes lipophilic parameters calculated in different ways, (xlog P, Alog P, Mlog P and ABlog P) mainly obtained by using the atom-based methods, except ABlog P.
The second cluster contains the remaining lipophilic parameters, mainly obtained by using the fragmental methods except AClog P.
Deviation of ABlog P can be explained by the fact that this lipophilic parameter, in contrast to the other fragmental log P, combines the advantages of reductionistic and constructionistic approaches.33
AClog P belongs to atom-based methods, in which the obtained result is highly dependent on the atom type parameterization. Separation of AClog P from the other atomic lipophilic parameters can be interpreted with Actelion’s AClog P definition strategy which this log P follows.34
What is important to emphasize is that the second cluster can be divided into two sub-clusters; one sub-cluster involves lipophilic parameters obtained experimentally (RM0 obtained in used organic modifier), and the other sub-cluster lipophilic includes the parameters milog P, AClog P and kowwin.
The grouping of the studied lipophilic parameters in this way indicates that the cluster analysis is sensitive enough to distinguish between the experimental and the computational values of lipophilic parameters, and also this distribution of parameters suggests that experimental values are in better agreement with the standard measure of lipophilicity with which they formed the same cluster.
Figure 4 shows that the application of the CA procedure on phenylacetamide derivatives resulted in the dendrogram with three clearly defined clusters. The first cluster contains the two most lipophilic molecules (2 and 5), the second cluster comprises compounds that have the most polar character of all (8, 9 and 11) and the third cluster involves compounds with moderate lipophilicity.
Principal component analysis is a very useful technique for investigations which contain a lot of data obtained in different ways, because elimination of the redundancy of the data and reduction of the data volume can be achieved by recognizing the basic components. PCA has the ability to decompose the original retention data matrix into several products of multiplication: loading (retention data) and score (investigated compounds) vectors,35 whereby new variables, so-called principal components, PC, are obtained. A maximum of the total variance should account for the first principal component (PC1), the second PC should be uncorrelated with the first one and should account for a Figure 3. Dendrogram of the lipophilicity parameters in the space of 11
measured values.
maximum of residual variance, and so on until the total variance is accounted for.
In our investigation the three principal components have described 98% (PC1 85.44%, PC2 10.94% and PC3 1.62%) of total variance in the data.
Loading plots, which can show similarity between the analyzed data obtained by applying PCA procedures on the lipophilicity calculated in different ways (variables), are presented in Figure 5 for two dominant PC (PC1 vs. PC2).
Two specific groups of lipophilic parameters can be registered in Figure 5. The first group includes lipophilic parameters which have negative values for both PCs (AClog P, ABlog P, Mlog P, Alog P and xlog P), and which were obtained by using atom-based method and fragmental ABlog P. Partial separation of Mlog P, Alog P and xlog P is observed. The lipophilic parameters obtained experimentally and the two remaining fragmental partition coefficients, milog P and kowwin formed the second group with negative values for PC1 and positive values for PC2. This classification is very similar to the grouping of compounds, which was obtained in cluster analysis; the only difference is the grouping of AClog P. PCA, unlike CA, has recognized and classified AClog P among the other lipophilic parameters obtained by using the atom-based method.
As in the case of cluster analysis, it can be concluded that greater similarity exists between the chromatographic retention constant, RM0, and the fragmental partition coefficients (milog P and kowwin) than with other log P values. The worst agreement can be expected between RM0 and Mlog P, Alog P, xlog P.
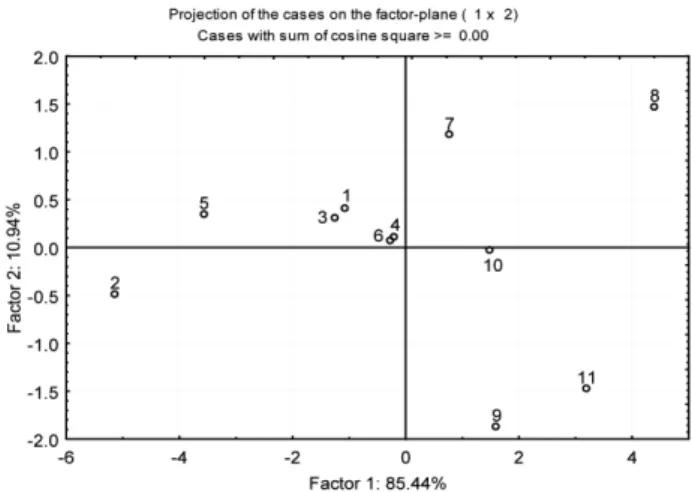
The possibility of separation of the tested derivatives based on differences in their lipophilicity is one of the important features of PCA. Corresponding score plots obtained by PCA for the two dominant PC (PC1 85.44% and PC2 10.94%) are presented in Figure 6.
From Figure 6 it is evident that the first two PCs resulted in almost perfect classification of the compounds based on the nature of the substituent related to the nitrogen atom
of the amide group. The investigated compounds were grouped more or less in accordance with their chemical structures. The differences between them are reflected in the value of PC1. Compounds with lipophilic substituent have negative values of PC1, while in the case of compounds with unlipophilic groups a positive PC1 is registered. The most lipohilic compound 2 has the most negative value of PC1, which is the occurrence already registered in the case of the substituted phenylacetamide derivatives.36 The most positive PC1 was calculated for compound 8 which has the smallest log P values.
It should also be noted from Figure 6 that compounds are separated based on the value of PC2. Compounds which contain aromatic rings as substituents have negative PC2 values, in contrast to compounds with heterocyclic substituents, which are described with positive PC2 values. Grouping of compounds in such way cannot be registered in cluster analysis but is in a full accordance with the results obtained by the linear regression analysis.
Conclusions
Eleven N-substituted-2-phenylacetamide derivatives were studied in order to define their lipophilicity. Lipophilic characteristics of the investigated compounds were determined in two ways: experimentally by using reversed phase thin layer chromatography in presence of different organic modifiers (ethanol and dioxane), and computationally from structural formula applying different mathematical methods within relevant software packages.
The obtained chromatographic results indicate that the retention of investigated compounds depends on the nature on the substituent on the nitrogen atom rather than the selected organic solvent. In order to establish the dependence between experimentally obtained RM0 as a measure of lipophilicity and partition coefficient, log P, Figure 5. Loading plots as a result of PCA.
as a standard measure of lipophilicity, classical linear regression analysis and multivariate methods, CA and PCA were performed.
The obtained results indicate that all used methods gave an approximately similar grouping of the studied lipophilic parameters and investigated compounds. In this way two important things are demonstrated. First, that chromatographic retention parameters of the investigated N-substituted-2-phenylacetamide derivatives obtained by RP-TLC are in good agreement with the standard measure of lipophilicity, which means that RM0 of the investigated compounds could be used for the description of their lipophilicity. Second, that the used chemometric methods are able to reduce the dimensionality of the data and create a connection between large numbers of data obtained in different ways.
Acknowledgements
The presented results are part of the research project No. 172013 supported by the Ministry of Education, Science and Technological Development of the Republic of Serbia.
References
1. Özkay, D. Ü.; Özkay, Y.; Can, Ö. D.; Med. Chem. Res. 2011,
20, 152.
2. Jamkhandi, C. M.; Disouza, J. I; Res. J. Pharm. Technol. 2012,
5, 1072.
3. Kadadevar, D.; Chaluvaraju, K. C.; Niranjan, M. S.; Sultanpur, C.; Madinur, S. K.; Nagaraj; Hegde, M.; Smitha, M.; Chakraborty, K.; Int. J. ChemTech Res. 2011, 3, 1064. 4. Khairullina, V. R.; Tarasov, G. P.; Gerchikov, A. Ya.; Zarudii,
F. S.; Pharm. Chem. J. 2012,45, 597.
5. Patel, R. V.; Kumari, P.; Rajani, D. P.; Chikhalia, K. H.; Med.
Chem. Res. 2013, 22, 195.
6. Chahrour, O.; Abdalla, A.; Lam, F.; Midgley, C.; Wang, S.;
Bioorg. Med. Chem. Lett. 2011, 21, 3066.
7. Chen, I. L.; Chen, J. J.; Lin, Y. C.; Peng, C. T.; Juang, S. H.; Wang, T. C.; Eur. J. Med. Chem. 2013, 59, 227.
8. Modi, N. R.; Shah, R. J.; Patel, M. J.; Suthar, M.; Chauhan, B. F.; Patel, L. J.; Med. Chem. Res. 2011, 20, 615.
9. Djaković-Sekulić, T.; Sârbu, C.; Perisic-Janjic, N.; J. Planar
Chromatogr. - Mod. TLC 2005, 18, 432.
10. Leo, A.; Hansch, C.; Elkins, D.; Chem. Rev. 1971, 71, 525. 11. Todeschini, R.; Consonni, V.; Handbook of Molecular
Descriptors; Wiley VCH Verlag GmbH: Weinheim, 2000. 12. Wiktorowicz, W.; Markuszewski, M.; Krysiński, J.; Kaliszan,
R.; Acta Pol. Pharm. 2002, 59, 295.
13. Perišić-Janjić, N.; Vastag, Gy.; Tomić, J.; Petrović, S.; J. Planar Chromatogr. - Mod. TLC 2007, 20, 353.
14. Gocan, S.; Cobzac, S.; Grinberg, N.; J. Liq. Chromatogr. Relat.
Technol. 2007, 30, 1669.
15. Csermely, T.; Kalász, H.; Deák, K.; Hasan, M. Y.; Darvas, F.; Petroianu, G.; J. Liq. Chromatogr. Relat. Technol.2007, 31, 2019.
16. Vaštag, D.; Perišić-Janjić, N.; Tomić, J.; Petrović, S.; J. Planar Chromatogr. - Mod. TLC 2011, 24, 435.
17. Perisic-Janjic, N.; Kaliszan, R.; Wiczling, P.; Milosevic, N.; Uscumlic, G.; Banjac, N.; Mol. Pharmaceutics 2011, 8, 555. 18. Hawrył, A.; Kumierz, E.; Pisarczyk, P.; Wujec, M.;
Waksmundzka-Hajnos, M.; Acta Chromatogr. 2012, 24, 271. 19. Miller, J. N.; Miller, J. C.; Statistics and Chemometrics for
Analytical Chemistry, 5th ed.; Pearson Education Limited:
Edinburgh Gate Harlow, England, 2004.
20. Sârbu, C.; Djaković-Sekulić, T.; Perišić-Janjić, N.; J. Pharm.
Biomed. Anal. 2002, 30, 739.
21. http://www.vcclab.org accessed in May 2011.
22. Lopes, A. B.; Miguez, E.; Kümmerle, A. E.; Rumjanek, V. M.; Fraga, C. A. M.; Barreiro, E. J.; Molecules 2013, 18, 11683. 23. Sârbu, C.; Todor, S.; J. Planar Chromatogr. - Mod. TLC 1998,
11, 123.
24. Komsta, L.; Skibiński, R.; Berecka, A.; Gumieniczek, A.; Radkiewicz, B.; Radoń, M.; J. Pharm. Biomed. Anal. 2010,
53, 911.
25. Dabić, D.; Natić, M.; Džambaski, Z.; Stojanović, M.; Marković, R.; Milojković-Opsenica, D.; Tešić, Z.; J. Liq. Chromatogr. Relat. Technol. 2011, 34, 791.
26. Cozma, A.; Zaharia, V.; Ignat, A.; Gocan, S.; Grinberg, N.;
J. Chromatogr. Sci. 2012, 50, 157.
27. Tache, F.; Naşcu-Briciu, R. D.; Sârbu, C.; Micǎle, F.; Medvedovici, A.; J. Pharm. Biomed. Anal. 2012, 57, 82. 28. Komsta, L.; Kobyłka, M.; J. Chromatogr. Sci. 2013, 51, 400. 29. Héberger, K.; Chemom. Intell. Lab. Syst. 1999, 47, 41. 30. Dallos, A.; Ngo, H. S.; Kresz, R.; Héberger, K.; J. Chromatogr. A
2008, 1177, 175.
31. Djaković-Sekulić, T.; Smolinski, A.; Perišić-Janjić, N.; Janicka, M.; J. Chemom. 2008, 22, 195.
32. Rabtti, E. H. M. A.; Natić, M. M.; Milojković-Opsenica, D. M.; Trifković, J. D.; Vučković, I. M.; Vajs, V. E.; Tesic, Z. Lj.;
J. Braz. Chem. Soc. 2012, 23, 522.
33. Mannhold, R.; Poda, G. I.; Ostermann, C.; Tetko, I. V.; J. Pharm.
Sci. 2009, 98, 861.
34. Estrada-Tejedor, R.; Sabaté, N.; Broto, F.; Nonell, S.; Afinidad
2013, 70, 250.
35. Csomós, E.; Héberger, K.; Simon-Sarkadi, L.; J. Agric. Food
Chem. 2002, 50, 3768.
36. Vastag, Gy.; Apostolov, S.; Perišić-Janjić, N.; Matijević, B.;
Anal. Chim. Acta. 2013, 767, 44.
Submitted: April 3, 2014