Printed in Brazil - ©2006 Sociedade Brasileira de Química 0103 - 5053 $6.00+0.00
Article
Direct Determination of Lead in Human Urine and Serum Samples by Electrothermal
Atomic Absorption Spectrometry and Permanent Modifiers
Daniel Andrada,a Frederico G. Pinto,a Cristina Gonçalves Magalhães,a Berta R. Nunes,a Milton B. Francob and José Bento Borba da Silva*,a
a
Departamento de Química, Universidade Federal de Minas Gerais, Avenida Antônio Carlos 6627, 31270-901 Belo Horizonte - MG, Brazil
b
Laboratório de Absorção Atômica, Centro de Desenvolvimento de Tecnologia Nuclear (CDTN/CNEN), Belo Horizonte - MG, Brazil
O objeto do presente estudo foi o desenvolvimento de metodologias alternativas para determinação direta de chumbo em amostras não digeridas de urina humana e soro, por espectrometria de absorção atômica com atomização eletrotérmica. Neste sentido algumas substâncias foram investigadas para atuarem como modificador químico. Volumes de 20 µL de
amostras de urina diluídas 1 + 1, v/v e de soro 1 + 4, v/v, com HNO3 1% v/v e 0,02% v/v de cloreto de trimetilcetil amônio (CTAC) foram preparados diretamente nos copos do amostrador automático e introduzidos no forno de grafite. Para modificadores em solução foram usados 10 µL. Curvas de
temperaturas de pirólise e atomização foram usadas em todas otimizações nas matrizes diluídas. Para urina, com o uso de irídio permanente (500 µg), as melhores temperaturas de pirólise e
atomização foram de 900 e 1600 oC respectivamente, com uma massa característica de 12 pg
(recomendada de 10 pg), com pulsos de absorção simétricos e fundo corrigido. Amostras de urina contaminadas apresentaram recuperações entre 86 e 112%, usando Ir permanente. Analisando amostras de urina certificada, os resultados encontrados foram concordantes com os valores certificados (considerando um intervalo de confiança de 95%) para dois níveis do metal. Para soro, bons resultados foram obtidos com a mistura de Zr + Rh ou Ir + Rh como modificadores permanentes, com massas características de 9,8 e 8,1 pg respectivamente. Recuperações de amostras de soro contaminadas variaram entre 98,6 e 100,1% (Ir + Rh) e entre 93,9 e 105,2% (Zr + Rh). Em ambos os estudos de recuperação, o desvio padrão relativo (n=3) foi menor que 7%. A calibração para ambas as amostras foi feita através de curvas de calibração aquosas que apresentaram r2
maior que 0,99. Os limites de detecção foram de 0,7 µg L-1 para as amostras de soro, usando Zr +
Rh permanente, e de 1,0 µg L-1 para urina com irídio permanente.
The object of the present study was the development of alternative methods for the direct determination of lead in undigested samples of human urine and serum by electrothermal atomic absorption spectrometry (ET AAS). Thus, some substances have been investigated to act as chemical modifiers. Volumes of 20 µL of diluted samples, 1 + 1, v/v for urine and 1 + 4, v/v for serum, with
HNO3 1% v/v and 0.02% v/v of cetil trimethyl ammonium chloride (CTAC) were prepared directly in the autosampler cups and placed into the graphite furnace. For modifiers in solutions 10 µL were
used. Pyrolysis and atomization temperature curves were used in all optimizations in the matrixes diluted as exposed. For urine with permanent iridium (500 µg), the best pyrolysis and atomization
temperatures were 900 and 1600 ºC, respectively, with a characteristic mass of 12 pg (recommended of 10 pg), with symmetrical absorption pulses and corrected background. Spiked urine samples presented recoveries between 86 and 112% for Ir permanent. The analysis results of certified urine samples are in agreement with certified values (95% of confidence) for two levels of the metal. For serum, good results were obtained with the mixture of Zr+Rh or Ir+Rh as permanent modifiers, with characteristic masses of 9.8 and 8.1 pg, respectively. Recoveries from spiked serum samples varied between 98.6 and 100.1% (Ir+Rh) and between 93.9 and 105.2% (Zr+Rh). In both recovery studies, the relative standard deviation (n=3) was lower than 7%. Calibration for both samples were made with aqueous calibration curves and presented r2 higher than 0.99. The limits of detection were 0.7 µg L-1 for serum samples, with Zr+Rh permanent, and 1.0 µg L-1 for urine with iridium permanent.
Keywords: electrothermal atomic absorption spectrometry, lead, urine, serum, iridium, iridium plus rhodium, permanent modifier
Introduction
Human exposure to lead derives for several sources, but mainly from soil, air, water, and ingestion under several forms. The effects of lead on the organism have been known practically since man learned how to work with this metal. There is an interesting study by Gilfilian (1965) that attributes the Fall of the Roman Empire to the use of seasonings manipulated in lead utensils.1
After absorption, lead distributes through the organism. Studies have shown that in blood, its stocking life is 25 days. Around 95% of the absorbed lead deposits in bones and teeth, the remaining 5% in soft tissues and the blood. The average life of lead in soft tissues and in bones is around 40 days and more than 25 years, respectively.2
Cake et al.3 studied the relationship between lead exposure and metal levels in blood serum and bone. They showed that Pb in the serum is a better indicator of chronic contamination (endogenous exposure) and is toxicologically very significant. Ikeda et al.4 studied the absorption kinetics mechanism of Pb in blood serum and concluded that free lead (Pb+2) is very low in serum, which probably hinders its natural elimination.
Lead can cause several harms to health. It interferes with the production of hemoglobin, causes renal, neurological disturbances and affects the encephalon.5 These effects can be evidenced and can be correlated to several levels of its concentration in blood. In reality, it is in children that damages can happen more precociously. The FAO/WHO Committee for the effects and the limits of exposure to lead estimates a fall in Intelligence Quotient (IQ) from 1 to 3 points for each 10 μg dL-1 increase in lead in blood in children.6 As their hematoencephalic barrier is still under development, intoxication in the early phases of life can lead to behavioral disturbances, hearing loss, and low IQ. Retarded growth, anemia, and weight loss have also been observed even with low lead blood levels.5
A lead blood concentration below 10 μg dL-1 is acceptable according to WHO, Center for Disease Control (CDC), and American Conference of Industrial Governmental Hygienists (ACGIH). ACGIH establishes the same limit for pregnant women.5 The weekly ingestion of lead considered acceptable is 25 μg kg-1.6
In ET AAS studies, Lima et al.7 used a mixture of W+Rh as a permanent modifier and compared the results obtained with those of Pd+Mg modifier. White,8 compared ICP-MS blood and urine lead levels with those obtained by ET AAS. These two techniques were in good agreement. Djane et al.9 used a system of support liquid membrane (SLM) to determine lead in urine. The extraction time varied from 30 min to 4 h and the extraction
efficiency was around 95%. Chen and Littlejohn,10 determined Pb in urine and certified urine samples by ET AAS. The method included a Pb extraction system by chelating agents and solvent extraction. The technique presented a limit of detection of 4 mg L-1.
In an interlaboratorial study made by Quiao et al.,11 ET AAS was used to determine Pb in urine and presented agreement with all other methods used and therefore the technique was validated. Manton et al.12 compared serum lead concentration measured by stable isotope dilution with thermal ionization mass spectrometry and blood lead concentrations measured by ET AAS in 73 women of child bearing age and found a ratio (r) of 0.83.
Grinberg and Campos13 studied the behavior of iridium as a thermally deposited permanent modifier for the determination of lead in whole blood and urine by GFAAS. A mixture of 0.1%, v/v Triton X-100 and 0.2%, v/v nitric acid was used as diluent. In the optimized coating procedure, up to 1,100 firings were possible with the same coating without sensitivity loss, while In the electrothermal atomic absorption spectrometric determination of cadmium and lead with stabilized phosphate deposited on permanently modified platforms by the optimized coating procedure, Tsalev et al.14 obtained up to 1,100 firings with the same coating without sensitivity loss. According to the authors, the thermally stabilized phosphate on either Zr–Ir- or W– Ir-treated platforms serves as a permanent modifier in environmental waters by multiple hot injections of large sample aliquots. Applications to water and biological certified reference materials were tabulated and show good agreement with certified values. The characteristic mass of Cd was 0.7–1.0 pg and of Pb was 26–31 pg.
The objective of the present work is to attempt the direct determination of lead in human urine and serum samples without previous digestion by ET AAS with different chemical modifiers.
Experimental
Instrumentation
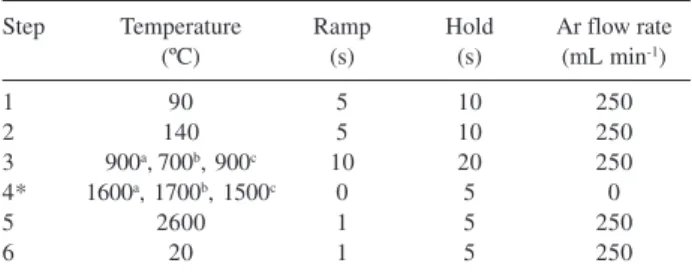
and the calibration solutions pipetted into the graphite tube was 20 μL. The volume of chemical modifiers in solution was 10 μL. Argon, 99.996% (White Martins, Belo Horizonte, MG, Brazil), was used as purge gas. Pyrolytic-graphite-coated tubes with integrated platform (Perkin Elmer, Part Number B3001262 – B3001261) were used in all studies. In the studies with permanent modifier, the tubes were treated as previously described for either Ir and Rh,15 or for Ru,16 i.e., by applying 50 μL of a 1g L-1 either Ru, or Ir, or Zr solution, independently for each modifier and submitting the tube to a specific temperature program. This procedure was repeated 10 times in order to obtain a permanent modifier deposit of 500 μg. The same treatment was used for obtaining Ir + Rh in tube (250 μg of each). The graphite furnace temperature program for the determination of lead was optimized for urine and serum samples as shown in Table 1.
Reagents and solutions
All chemicals used were of analytical-reagent grade, unless otherwise specified. Water was deionized in a Milli-Q system (Millipore, Bedford, MA, USA). Nitric acid was from Merck (Darmstadt, Germany, Nº. 7587956).
The following 1 g L-1 stock solutions were used: ruthenium (Fluka, Buchs, Switzerland, Nº. 84033), rhodium (Fluka, Nº. 58195), all in 1mol L-1 hydrochloric acid, magnesium nitrate solution, modifier for graphite furnace AAS (Merck, Nº. B593213 431) and palladium nitrate solution, modifier for graphite furnace AAS (Merck, Nº. B936989 710). The lead stock solution (1 g L-1) in ~0.3 mol L-1 nitric acid was from Merck (Darmstadt, Germany, No.90361929).
All glasses were previously abundantly washed with a detergent solution, rinsed with water, maintained in bath with nitric acid 50% v/v for a period not inferior to 1 h, and later on rinsed several times with deionized water. The autosampler cups were submitted to the same treatment.
Procedure
Urine samples were diluted with 1 + 1, v/v, HNO3 1%, v/v and 0.02%, v/v cetyl trimethyl ammonium chloride (CTAC) prepared directly in the autosampler cups and introduced into the graphite furnace. For serum samples, initially studied a 1 + 4, v/v dilution with the same diluent. CTAC, a surfactant, acted as a diluent, helping in the extraction of the metal, and as a detergent for cleaning possible carbonaceous residues formed inside the graphite tube. It also made cleaning the autosampler capillary between measurements easy. The calibration of both matrices was performed with aqueous solutions in the range of 0.0 – 50.0 μg L-1 lead.
To verify the accuracy of the proposed methodology, recovery of spiked urine samples with 5.2, 7.4, 11.8, 15.4, and 18.2 μg L-1 and for the serum samples with 10.0, 20.0, 30.0, and 40.0 μg L-1 lead were evaluated.
Recovery studies were made against aqueous calibration curves. The limit of detection (LOD, μg L-1) was calculated by using the equation LOD = 3 x SBL/b, where SBL is the standard deviation of ten blank measurements (nitric acid 1% v/v with CTAC) and b is the calibration curve slope.17
Reference materials
Certified urine samples from Bio Rad (US Bio Rad Laboratories, Anaheim, USES), level 1 (Code 4001) and level 2 (Code 4051) were analyzed.
Results and Discussion
Pyrolysis and atomization temperature curves
For comparison of the thermal behavior of lead submitted to a furnace temperature program on each of the surfaces used, pyrolysis and atomization temperature curves for lead in the presence of matrix (Figures 1 and 2 for urine and serum samples, respectively) were obtained. For urine samples, comparisons of the determination of lead without modifier with the Pd + Mg mixture in solution (universal modifier), Ir and Ru (500 μg of each) as permanent modifiers was investigated. Without the use of chemical modifier and with Ru as permanent modifier, the absorbance is lower and the background is higher comparatively to the best modifiers. These results can probably be attributed to the inefficient background correction with a deuterium lamp. With the use of the Pd + Mg mixture, the best pyrolysis and atomization temperatures were 1300 and 1800 ºC, with a characteristic mass of 15 pg (manufacturer recommendation, Table 1. Temperature program for Pb determination in human urine and
serum samples by ET AAS with Ir for urine and Ir + Rh or Zr + Rh for serum as permanent modifiers
Step Temperature Ramp Hold Ar flow rate (ºC) (s) (s) (mL min-1)
1 90 5 10 250
2 140 5 10 250
3 900a,700b, 900c 10 20 250
4* 1600a, 1700b, 1500c 0 5 0
5 2600 1 5 250
6 20 1 5 250
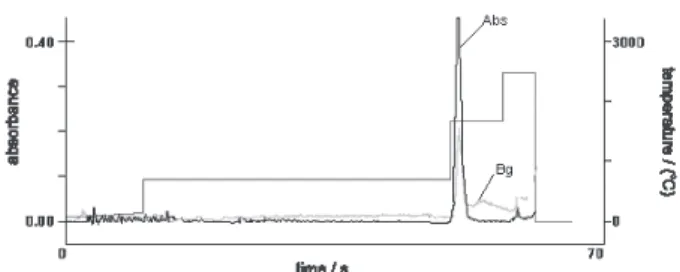
10 pg in aqueous solution with Pd + Mg as a modifier in solution).18 With ruthenium (500 μg), no peak was obtained, but a uniform and repetitive plateau that does not return to the baseline even after 15 s of atomization was observed. With iridium as permanent modifier (500 μg), the best temperatures were 900 and 1600 ºC. However, a higher sensitivity was obtained with a characteristic mass of 12 pg. In these conditions, the peak was symmetric and was formed in about 3 s with corrected and low background (about 0.2 absorbance, s).
For serum samples, it initially determined lead in one-fold diluted samples spiked with 20 μg L-1 without the use of chemical modifier. For all the temperature ranges studied, the absorbance values were negative and the background was very high. The best results were obtained with a dilution of 1 + 4.
In the serum samples, the comparison of the thermal behavior of lead submitted to a furnace temperature program with each one of the surfaces was made by obtaining pyrolysis and atomization temperature curves in the presence of the matrix (Figure 2). In order to evaluate these results, determinations without modifier use, with the Pd + Mg
(universal modifier) mixture, with iridium in solution, and Ru, Ir, Zr (500 μg of each) and Ir + Rh and Zr + Rh (250 + 250 μg of each) as permanent modifiers were compared.
Good results were obtained for serum samples only with either Zr + Rh or Ir + Rh mixtures, which presented the higher sensitivity (characteristic masses of 9.8 and 8.1 pg, respectively). In both conditions, the peak was symmetric, formed in about 3 s, and had corrected and low background (about 0.2 absorbance, s). With other modifiers, it was not obtained a good peak, only a uniform and repetitive plateau that does not return to the baseline even after 15 s atomization. Without modifier, sensitivity is the lowest, and the background was not corrected.
Analytical figures of merit
Aqueous calibration curves for urine and serum samples presented an r2 higher than 0.99. Urine samples spiked with
5.2, 7.4, 11.8, 15.4, and 18.2 μg L-1 Pb, presented recoveries between 86 a 112%, as shown in Table 2. The analysis of certified urine samples (Biorad) were in good agreement with certified values (95% confidence) for two levels of the metal, as shown in Table 3.
Serum samples spiked with 10.0, 20.0, 30.0, and 40.0 μg L-1 Pb presented recoveries between 98.6 and 100.1% (Ir + Rh) and between 93.9 and 105.2% (Zr + Rh). In both recovery studies, the relative standard deviation (n=3) was lower than 7%. Recovery results are shown in Tables 4 and 5.
For serum samples, the limit of detection, LOD for Zr + Rh was 0.7 μg L-1, and for urine samples with Ir, it was 1.0 μg L-1.
Table 3. Comparison of lead concentration in certified urine samples and the proposed methodology
Level Determined concentrationa Certified concentrationa
(μg L-1) (μg L-1)
1 14.8 ± 3.0 15.2 ± 0.3 2 71.4 ± 14.3 72.8 ± 2.5
a(mean ± standard deviation, n=3).
Table 2. Recovery of spiked urine sample with lead, analyzed by ET AAS with Ir (500 μg) as permanent modifier
Expected Determineda
concentration concentration Recovery (%) (μg L-1) (μg L-1)
05.20 04.5 ± 0.2 086.0 07.40 07.2 ± 0.5 097.3 11.80 12.1 ± 0.5 102.5 15.40 16.7 ± 0.8 108.4 18.20 20.4 ± 1.0 112.0
a(mean ± standard deviation, n=3).
Figure 1. Pyrolysis and atomization temperature curves for 420 pg of Pb in urine samples with either Pd + Mg or iridium permanent as modifier.
Conclusions
Ir and Ir + Rh and Zr + Rh mixtures revealed to be prominent permanent modifiers for the direct determination of Pb in urine and serum, respectively. The methodology developed here with the dilution of urine, 1 + 1, and serum, 1 + 4, both with HNO3 1% v/v and 0.02% v/v cetil trimethyl ammonium chloride (CTAC) directly in the autosampler cups presented good sensitivity with symmetrical peaks, corrected background, and recovery values within the normal value range of urine and serum close to 100%.
Acknowledgments
The authors are thankful to Conselho Nacional de Pesquisas e Desenvolvimento Tecnológico (CNPq). C. G. Magalhães, B. R. Nunes, F. G. Pinto and D. Andrade has a scholarship from CNPq. J. B .B. Silva is grateful to CNPq for the research grant.
References
1. CDC, Wonder, Case Studies in Environmental Medicine: Lead Toxicity, 1992; http://cdc.gov/wonder/prevguid/previguid.htm; Accessed in December of 2004.
2. Paoliello, M. M. B.; Rev. Saúde Pública1997, 31, 144. 3. Cake, K. M.; Bowins, R. J.; Vaillancourt, V. C.; Gordon, C. L.;
MacNutt, R. H.; Laporte, R.; Webber, C. E.; Chettle, D. R.; Am. J. Ind. Med. 1996, 29, 440.
Table 5. Recovery of spiked serum samples analyzed by ETAAS with Zr + Rh (520 μg) as a permanent modifier
Expected Determined
concentration concentrationa Recovery (%)
(μg L-1) (μg L-1)
10.0 10.5 ± 0.6 105.2 20.0 21.6 ± 0.3 108.2 30.0 28.2 ± 0.7 093.9 40.0 39.9 ± 3.5 099.8
a(mean ± standard deviation, n=3).
Table 4. Recovery of spiked serum sample with lead analyzed by ET AAS with Ir + Rh (500 μg) as a permanent modifier
Expected Determined
concentration concentrationa Recovery (%)
(μg L-1) (μg L-1)
10.0 10.1 ± 0.4 100.1 20.0 19.7 ± 1.3 098.6 30.0 29.8 ± 1.2 099.4 40.0 16.7 ± 0.8 098.6
a(mean ± standard deviation, n=3).
4. Ikeda, M.; Zang, Z. W.; Shimbo, S.; Watanable, T.; Nakatsuka, H.; Moon, C. S.; Matsuda-Inoguch, N.; Higashikawa, K.; Sci. Total Environ.2000, 246, 97.
5. Hall, A. H.; Rumac, B. H.; Toxicology and Occupational Medicine System, Tomes Plus® System: Englewood, 1997.
6. FAO/OMS - Documento de Trabajo sobre el Plombo – 26th
Reunion del Comite Del Codex sobre Aditivos Contaminantes
de los Alimentos, February: São Paulo, 1994.
7. Lima, E. C.; Barbosa Jr., F.; Krug, F. J.; Fresenius’ J. Anal. Chem. 2001, 369, 496.
8. White, M. A.; J. Trace Elem. Med. Biol.1999, 13, 93. 9. Djane, N. K.; Armalis, S.; Ndung’u, K.; Johansson, G.;
Mathiasson, L.; Analyst 1997, 122, 1073. 10. Chen, T.; Littlejohn, D.; Analyst 1993, 118, 541.
11. Quiao, H.; Parsons, P. J.; Slavin, W.; Clin. Chem. 1995, 41, 1451.
12. Manton, W. I.; Rothemberg, S. J.; Manalo, M.; Environ. Res. 2001, 86, 263.
13. Grinberg, P.; Campos, R. C.; Spectrochim. Acta, Part B 2001, 56, 1831.
14. Tsalev, D. L.; Lampugnani, L.; Gerogieva, R.; Chakarova, K. K.; Petrov Jr. I. I.; Talanta 2002, 58, 331.
15. Silva, J. B. B.; Giacomelli, M. B. O.; Souza, I. G.; Curtius, A. J.; Microchem. J. 1998, 60, 249.
16. Silva, J. B. B.; Silva, M. A. M.; Curtius, A. J.; Welz, B.; J. Anal. At. Spectrom. 1999, 14, 1737.
17. Shan, X.Q.; Bei, W.; J. Anal. At. Spectrom. 1995, 10, 791. 18. Welz, B.; Sperling, M.; Atomic Absorption Spectrometry,
Wiley-VCH: Weinheim, 1997.
Received: February 14, 2005
Published on the web: February 13, 2006 Figure 3. Absorption pulse for 0.5 ng of Pb in urine with iridium as per-manent modifier.