0103 - 5053 $6.00+0.00
Article
* e-mail: [email protected]
Comparative Study of Green’s Function Matrix Elements and Charge Transfers Obtained
from Different Partitioning Schemes of Molecular Charge in Hydrogen-Bonded Complexes
Antenor J. Parnaíba-da Silva, João Bosco P. da Silva, A. Arnóbio S. da Gama and Mozart N. Ramos*
Departamento de Química Fundamental - Universidade Federal de Pernambuco, 50740-540 Recife-PE, Brazil
Cálculos de orbitais moleculares ab initio RHF e MP2 usando os conjuntos de base
4-31G**, 6-311G** e cc-pVTZ têm revelado que os valores de GD,A mostram uma boa correlação com transferências de cargas atômicas intermoleculares obtidas a partir de diferentes esquemas de partição para os complexos de hidrogênio CNH…CNH, NCH…CNH, CNH…NCH e NCH…NCH. Isto é especialmente evidente quando a distância da ligação de hidrogênio é progressivamente aumentada até 4,5 Å. Entretanto, valores de GD,A mostram uma melhor correlação linear com valores de ∆Q usando as cargas Mülliken corrigidas, que são obtidas do modelo carga-fluxo de carga-recobrimento (CCFO) para intensidades no infravermelho. Neste caso, ambos GD,A e ∆Q formam duas curvas exponenciais praticamente superpostas. Por outro lado, valores de GD,A mostram uma menor concordância com valores de ∆Q obtidos das cargas atômicas derivadas dos orbitais de ligação naturais. Isso é claramente verificado quando é considerada a taxa de decaimento exponencial de primeira ordem de GD,Aversus∆Q obtida de diferentes esquemas de partição de carga.
RHF and MP2 ab initio molecular orbital calculations using the 4-31G**, 6-311G** and
cc-pVTZ basis sets have revealed that the Green’s function matrix element (GD,A) values show a good correlation with the amount of intermolecular transferred charges obtained from different charge partitioning schemes for the CNH…CNH, NCH…CNH, CNH…NCH and NCH…NCH hydrogen bonded complexes. This is evident specially when the hydrogen bond distance is progressively increased from the equilibrium position until 4.5 Å. However, GD,A values show a better linear correlation with ∆Q values using corrected Mülliken charges, which are obtained from the charge-charge flux-overlap (CCFO) model for infrared intensities. In this case, both GD,A and ∆Qcorr form two practically superposed exponential curves. On the other hand, GD,A values show a smaller agreement with ∆Q values obtained from atomic charges derived from natural bonding orbitals. This is clearly verified when considering the first order exponential decay rate of GD,A versus ∆Q obtained from different charge partitioning schemes.
Keywords: hydrogen bond, ab initio calculations, charge transfer, Green´s function, atomic
charge partitioning
Introduction
When a hydrogen-bonded complex is formed, an intermolecular charge transfer occurs, and its magnitude is sometimes directly associated with the hydrogen bond strength.1 Currently, this charge transfer is obtained from atomic charges derived from ab initio molecular orbital calculations with different basis sets. These charges can be computed from different partitioning schemes of molecular charge. This procedure may suggest a qualitative idea of the magnitude of
(GD,A)7 in hydrogen-bonded complexes of the
CnNH…CnNH and CnNH…NCnH (n = 1 and 3) type.
The Green’s function formalism was introduced as a tool for the calculation of bridge mediated donor-acceptor interactions Vda = VdD GDA VAa7 that appears in the Fermi’s Golden Rule expression of a
diabatic electron transfer rate, 8 and
molecular wire conductance.9 Then, a correlation is observed among the charge transfer probability and the magnitude of the charge transferred upon the formation of the H-bond.
There we have verified that the larger is the intermolecular charge transfer for a given complex, the larger its GD,A value appears to be. We have also noted that GD,A and ∆Qcorr are associated with the binding energies of these complexes. Furthermore, both GD,A and
∆Qcorr show the same behavior when the hydrogen
bonding distance is progressively increased from the equilibrium position until 4.5 Å, forming two practically superposed exponential curves.
It is also interesting to point out that hydrogen bonding is believed to play an important hole in electron transfer. An electron tunneling pathway model, described as a sequence of covalent, hydrogen bonding and through space interactions, was developed and applied for the reproduction and prediction of electron transfer rates in
modified metalloproteins.10 Some molecular model
systems with hydrogen bonding on the pathway from electron donor to electron acceptor have been designed for experimental studies.11 The behavior of G
D,A through this hydrogen bonding bridge was compared with covalent saturated and unsaturated bridges and indeed it shows a faster decay with the separation distance.12
In this paper we intend to compare GD,A values with intermolecular charge transfers obtained from different partitioning schemes of molecular charge. Besides the corrected Mulliken charges5, we also consider the standard
Mulliken charges13, atomic charges derived from
electrostatic potentials14 and those obtained from natural
bonding orbitals.15 This comparative study will be
performed on the CNH…CNH, NCH…CNH, CNH…NCH
and NCH…NCH complexes employing RHF16 and MP217
ab initio molecular orbital calculations with the 4-31G**18, 6-311G**19 and cc-pVTZ20 basis sets.
Calculations
The procedures to obtain Green’s function matrix elements and the corrected Mulliken charges are given in References 6 and 5, respectively. The ab initio calculations
were performed with the GAUSSIAN 94 program.21 In this procedure, the molecular geometry of the isolated molecules and their hydrogen-bonded complexes at the equilibrium distance were fully optimized and no imaginary frequency was observed. The MP2 calculations were performed using the electron frozen core approximation. It is also important to call attention that the GD,A values were calculated using natural bonding orbitals while s and p atomic orbitals or hybrids were used as intermediate steps on the construction of these natural orbitals. These later have been shown to be more adequate in analyzing electron transfer interaction propagation.22
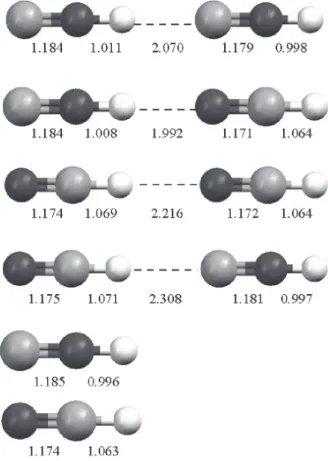
The MP2/4-31G** optimized geometries of CNH… CNH, NCH…CNH, CNH…NCH and NCH…NCH complexes and their monomers are given in Figure 1. The internal default criteria of Gaussian 94 were used in all calculations.
Results and Discussion
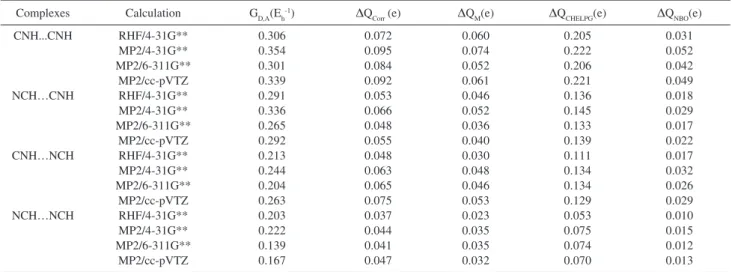
Table 1 shows GD,A and ∆Q values using the MP2 and RHF levels of calculation with the 4-31G**, 6-311G** and cc-pVTZ basis sets for the CNH…CNH, NCH…CNH,
CNH…NCH and NCH…NCH complexes. Here ∆Q is
the amount of transferred atomic charge from a molecule to another when the hydrogen bond is formed. This quantity is obtained from four different partitioning schemes of molecular charge: (i) ∆Qcorr is obtained from the corrected Mulliken charges using the charge- charge flux-overlap (CCFO) model for infrared intensities; (ii) ∆QM is calculated from the traditional Mulliken charges; (iii) ∆QCHELPG is obtained from atomic charges derived from electrostatic potentials and, finally, (iv) ∆QNBO is obtained from atomic charges using natural bonding orbitals. Initially, we can note from Table 1 that the GD,A values show a good correlation with the ∆Q values for these four different partitioning schemes of molecular charge. In general, we can verify that the larger is the Green’s function matrix elements (GD,A) for a given complex, the larger its corresponding charge transfer appears to be. This can be visualized in Figure 2 considering GD,A and ∆QCHELPG values for the four
hydrogen-bonded complexes here employed using the RHF/4-31G**, MP2/4-31G**, MP2/6-311G** and MP2/ cc-pVTZ calculations.
For example, GD,A values using the MP2/4-31G**
calculation level for the CNH...CNH, NCH...CNH,
CNH...NCH and NCH...NCH complexes are 0.354 Eh-1,
0.336 Eh-1, 0.244 E
h-1 and 0.222 Eh-1, respectively, whereas their corresponding values for ∆QCHELPG are 0.222 e, 0.145 e, 0.134 e and 0.075 e, respectively. We have also investigated a possible correlation between lnGD,A values and rH...X hydrogen bond lengths involving the hydrogen-bonded complexes here studied. However, our results show that these parameters are not correlated. While lnGD,A values follow the order: CNH...CNH > NCH...CNH > CNH...NCH > NCH...NCH, as can be seen in Table 1, the hydrogen bond lengths, in turn, follow the order: NCH...CNH > NCH...NCH > CNH...CNH > CNH...NCH. This later can be seen in considering the rH...X values obtained from the MP2/4-31G** calculations shown in Figure 1.
GD,A values always follow for a given calculation the order: CNH…CNH > NCH…CNH > CNH…NCH > NCH…NCH. However, some inversions are found for the values of the intermolecular charge transfers involving the NCH…CNH and CNH…NCH complexes. For
example, GD,A values for NCH…CNH and CNH…NCH
are 0.265 Eh-1 and 0.204 E
h-1, respectively, using the MP2/ 4-31G** calculation whereas their corresponding ∆Qcorr values are 0.048 e and 0.065 e, respectively. Although the trend is always consistent for the CNH…CNH and NCH…NCH complexes, some inversions occur for the NCH…CNH and CNH…NCH complexes. It is also important to point out that RHF/4-31G** calculations show GD,A and ∆Q values smaller than its MP2/4-31G** corresponding values. For example, the GD,A values using
Table 1. GD,A and ∆Q values for the CNH…CNH, NCH…CNH, CNH…NCH and NCH…NCH complexes using the MP2 and RHF calculations levels with the 4-31G**, 6-311G** and cc-pVTZ basis sets
Complexes Calculation GD,A(Eh-1) ∆Q
Corr (e) ∆QM(e) ∆QCHELPG(e) ∆QNBO(e)
CNH...CNH RHF/4-31G** 0.306 0.072 0.060 0.205 0.031
MP2/4-31G** 0.354 0.095 0.074 0.222 0.052
MP2/6-311G** 0.301 0.084 0.052 0.206 0.042
MP2/cc-pVTZ 0.339 0.092 0.061 0.221 0.049
NCH…CNH RHF/4-31G** 0.291 0.053 0.046 0.136 0.018
MP2/4-31G** 0.336 0.066 0.052 0.145 0.029
MP2/6-311G** 0.265 0.048 0.036 0.133 0.017
MP2/cc-pVTZ 0.292 0.055 0.040 0.139 0.022
CNH…NCH RHF/4-31G** 0.213 0.048 0.030 0.111 0.017
MP2/4-31G** 0.244 0.063 0.048 0.134 0.032
MP2/6-311G** 0.204 0.065 0.046 0.134 0.026
MP2/cc-pVTZ 0.263 0.075 0.053 0.129 0.029
NCH…NCH RHF/4-31G** 0.203 0.037 0.023 0.053 0.010
MP2/4-31G** 0.222 0.044 0.035 0.075 0.015
MP2/6-311G** 0.139 0.041 0.035 0.074 0.012
MP2/cc-pVTZ 0.167 0.047 0.032 0.070 0.013
the RHF/4-31G** level of calculation are 0.306 Eh-1, 0.291 Eh-1, 0.213 E
h-1 and 0.203 Eh-1 for the CNH…CNH, NCH…CNH, CNH…NCH and NCH…NCH complexes, respectively, whereas their MP2/4-31G** corresponding values are 0.354 Eh-1, 0.336 E
h-1, 0.244 Eh-1 and 0.222 Eh-1, respectively.
The larger values for both GD,A and ∆Q are verified for the CNH…CNH complex, whereas their smaller values are verified in NCH…NCH. This can be understood in considering the greater acid character of CNH with respect
to NCH. In this sense, it is also interesting to take into account their HOMO and LUMO energies. The values of
ε
HOMO and εLUMO, for CNH are –13.363 eV and 3.608 eV, respectively, using the MP2/cc-pVTZ calculation level whereas its corresponding values for NCH are –13.374 eV and 3.848 eV, respectively. The energy gap for CNH is 16.970 eV, whereas for NCH is 17.223 eV. Therefore, the charge transfer in CNH…CNH is larger than in NCH…CNH. Furthermore, this transfer is larger in CNH…NCH than in NCH…NCH.
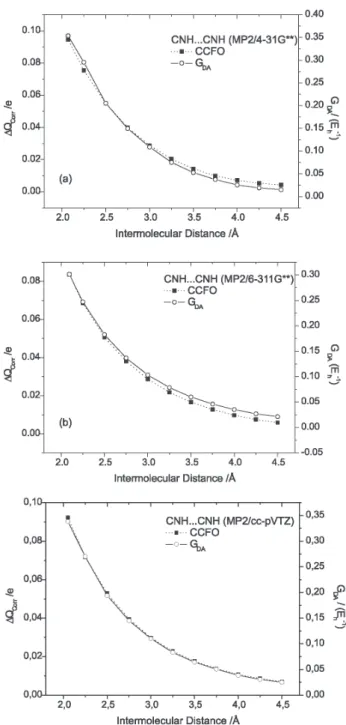
We have already verified6 that both G
D,A and ∆Qcorr follow an exponential behavior when the hydrogen bonding distance is progressively increased from the equilibrium position until 4.5 Å. Indeed, their exponential curves are practically superposed for both MP2 and RHF calculation levels. Figure 3 clearly shows this behavior for the CNH…CNH complex employing the MP2 level of calculation with the 4-31G**, 6-311G** and cc-pVTZ basis sets, analogously to what was verified for the other complexes.
Furthermore, we can note in Figure 4 that this exponential behavior is also verified for the other charge partitioning schemes.
However, a still better agreement is verified when corrected Mulliken charges are used to obtain charge transfer values. This can be better understood in considering that the overlap term, which is added to standard Mulliken charge to obtain the corrected Mulliken charge of the α atom, contains electronic contributions from atomic dipoles and lone pairs.6 As a consequence, it is expected that the corrected Mulliken charges can give a better description of the distribution of molecular atomic charge. On the other hand, it is less accentuated when NBO atomic charges are employed. This can be also visualized in Table 2 considering the first order exponential decay rate (t) of these parameters using the MP2 H-bond distance at equilibrium position with the 4-31G**, 6-311G** and cc-pVTZ basis sets. Here t is given by
(1)
where r is the H-bond equilibrium distance, Γ is GD,A or
∆Q obtained at distance r and A is the pre-exponential factor of the fitting curve. From this Table we can observe that the exponential decay rate obtained from ∆Qcorr is in better agreement with that obtained from the GD,A than its corresponding use of ∆QM, ∆QCHELPG and ∆QNBO values for the CNH…CNH, NCH…CNH, CNH…NCH and NCH…NCH complexes. The major difference has been verified for ∆QNBO.
Table 2. First order exponential decay rate ( t ) of GD,A and ∆Q with respect to calculated intermolecular distance at equilibrium position
Complexes Calculation t (GD,A) t (∆Qcorr) t (∆QM) t (∆QCHELPG) t (∆QNBO)
CNH...CNH MP2/4-31G** 0.763 0.769 0.579 0.723 0.353
MP2/6-311G** 0.709 0.710 0.783 0.816 0.358
MP2/cc-pVTZ 0.700 0.698 0.717 0.795 0.361
NCH…CNH MP2/4-31G** 0.657 0.654 0.548 0.784 0.394
MP2/6-311G** 0.661 0.722 0.781 0.795 0.443
MP2/cc-pVTZ 0.684 0.710 0.768 0.807 0.395
CNH…NCH MP2/4-31G** 0.715 0.773 0.632 0.773 0.423
MP2/6-311G** 0.650 0.686 0.776 0.787 0.359
MP2/cc-pVTZ 0.781 0.673 0.673 0.786 0.326
NCH…NCH MP2/4-31G** 0.736 0.665 0.614 0.806 0.454
MP2/6-311G** 0.713 0.720 0.776 0.839 0.440
MP2/cc-pVTZ 0.700 0.702 0.788 0.824 0.370
Conclusions
Our calculations have revealed that GD,A values show a good correlation with intermolecular charge transfers obtained from different partitioning schemes of molecular charge for the CNH…CNH, NCH…CNH, CNH…NCH and NCH…NCH hydrogen-bonded complexes. This is clearly verified when the hydrogen bonding distance is progressively increased from the equilibrium position until
4.5 Å. In this case, GD,A values show a very similar behavior with the charge transfers using corrected Mulliken charges obtained from the charge-charge flux-overlap model for infrared intensities. Indeed, GD,A and ∆Qcorr yield two exponential curves practically superposed. The first order exponential decay rate is useful to numerically express this behavior. Currently, studies are in progress in our laboratory in order to evaluate this similarity between GD,A and ∆Q for other hydrogen-bonded complexes.
Acknowledgments
The authors thank CNPq, CAPES and FINEP for partial financial support. The final form of the text was benefited by the referres comments wich are gratefully acknoledged.
References
1. Araújo, R. C. M. U.; Ramos, M. N.; J. Mol. Struct. (Theochem)
1996, 366, 233; Lopes, K. C.; Pereira, F. S.; Ramos, M. N.; Araújo, R. C. M. U.; Spectrochim. Acta, Part A2001, 57A, 1339; Araújo, R. C. M. U.; Ramos, M.N.; Spectrochim. Acta, Part A1995, 51A, 821.
2. King, W. T.; Mast, G. B.; J. Phys. Chem.1976, 80, 2521. 3. Gussoni, M.; Castiglioni, C.; Ramos, M. N.; Rui, M.; Zerbi,
G.; J. Mol. Struct.1990, 224, 445.
4. Rui, M; Ramos, M. N.; Castiglioni, C.; Gussoni, M.; Zerbi, G.; Mol. Cryst. Liquid Cryst.1990,187, 275.
5. Gussoni, M.; Ramos, M. N.; Castiglioni, C.; Zerbi, G.; Chem. Phys. Lett. 1987, 142, 515; Gussoni, M.; Ramos, M. N.; Castiglioni, C.; Zerbi, G.; Chem. Phys. Lett. 1989, 160, 200. 6. Parnaíba-da-Silva, A. J.; da Silva, J. B. P.; da Gama, A. A. S.;
Ramos, M. N.; Chem. Phys. Lett.2002, 362, 159.
7. da Gama, A. A. S.; Theor. Chim. Acta1985, 68, 159; Larsson, S.; J. Am.Chem.Soc.1981, 103, 4034.
8. Marcus, R. A.; Sutin, N.; Biochim. Biophys. Acta1985, 811,
265.
9. Mujica, V.; Kemp, M.; Ratner, M. A.; J. Chem. Phys.1994, 101, 6849.
10. Beratan, D.N.; Onuchic, J.N.; Betts, J.N.; Bowler, B.E.; Gray, H.B.; J. Am. Chem. Soc.1990, 112, 7915.
11. de Regge, P.J.F.; Williams, S.A.; Therien, M.J.; Science1995, 269, 1409.
12. Parnaíba-daSilva, A.J.; da Gama, A.A.S.; Chem. Phys. Lett.
1998, 296, 483.
13. Mulliken, R. S.; J. Chem. Phys.1955, 23, 1833.
14. Cox, S. R.; Williams, D. E.; J. Comput. Chem.1981, 2, 304; Chirlian, L. E.; Francl, M. M.; J. Comput. Chem.1987, 8, 894.; Breneman, C. M.; Wiberg, K. B.; J. Comput. Chem.1990, 11, 361.
15. Reed, A. E.; Weistock, R. B.; Weinhold, F. A.; J. Chem. Phys.
1985, 83, 735.
16. Atkins, P.W.; Molecular Quantum Mechanics, 2th ed., Oxford
Press: Oxford, 1983.
17. Moller, C.; Plesset, M. S.; Phys. Rev.1934, 46, 618. 18. Gordon, M. S.; Chem. Phys. Lett.1980, 76, 163.
19. Raghavachari, K.; Pople, J. A.; Replogle, E. S.; Head-Gordon, M.; J. Phys. Chem.1990, 94, 5579.
20. Kendall, R. A.; Dunning Jr., T. H.; Harrison, R. J.; J. Chem. Phys.1992, 96, 6796.
21. Frisch, M. J.; Trucks, G. W.; Schlegel, H. B.; Gill, P. M. W.; Johnson, B. G.; Robb, M. A.; Cheeseman, J. R.; Keith, T.; Petersson, G. A.; Montgomery, J. A.; Raghavachari, K.; Al-Laham, M. A.; Zakrzewski, V. G.; Ortiz, J. V.; Foresman, J. B.; Cioslowski, J.; Stefanov, B. B.; Nanayakkara, A.; Challacombe, M.; Peng, C. Y.; Ayala, P. Y.; Chen, W.; Wong, M. W.; Andres, J. L.; Replogle, E. S.; Gomperts, R.; Martin, R. L.; Fox, D. J.; Binkley, J. S.; Defrees, D. J.; Baker, J.; Stewart, J. P.; Head-Gordon, M.; Gonzalez, C.; Pople, J. A.; Gaussian 94, Revision E.3, Gaussian, Inc.: Pittsburgh PA, 1995.
22. Santana, O.L.; da Gama, A.A.S.; Int. J. Quantum Chem.2005,
102, 265.
Received: December 9, 2004