The role of vertical disparities in the oblique effect
J. Antonio Aznar-Casanova
1, Aurora Torrents
2and Nelson Torro Alves
3 1 University of Barcelona, Spain2Universitat Politécnica de Catalunya, Spain 3 Universidade Federal da Paraíba, Brazil.
Abstract
A great deal of studies using different visual tasks (e.g., Vernier acuity tasks, tilt illusion, crowding, etc) have revealed that our perception is strongly inluenced by the orientation of the stimulus. Most studies have investigated visual acuity in two-dimensional visual spaces (2D) but little is known about the effect of line orientation in depth perception (3D). In one experiment, Vernier Acuity (VA) in frontoparallel (2D) and medial (3D) planes was investigated. We used a virtual reality setup inducing inter-ocular disparities to simulate a 3D visual space, and a common computer screen to present stimuli in the frontal plane. In the experiment, by using the method of constant stimuli, the observer compared VA in the 2D and 3D visual spaces as a function of the stimulus orientation. Results showed that only judgments in the 3D condition were affected by the well-known ‘oblique effect’, and some impairment in stereoacuity (lines in depth plane) in comparison to 2D acuity (lines in frontal plane) was observed. We attributed the cause for such deterioration in stereoacuity to changes in vertical disparities. Keywords: binocular vision, depth perception, stereoacuity, vernier acuity.
Received 13 December 2007; received in revised form 30 September 2008; accepted 16 October 2008. Available online xx December 2008
J. Antonio Aznar-Casanova - Department of Basic Psychology, Faculty of Psychology, University of Barcelona, Spain. Aurora Torrents - Departament d’Optica i Optometria. Universitat Politècnica de Catalunya, Spain. Nelson T. Alves - Departamento de Psicologia. Universidade Federal da Paraíba, João Pessoa, Brazil. Correspondence regarding this article should be directed to: J. Antonio Aznar-Casanova - Department of Basic Psychology, Faculty of Psychology, University of Barcelona, Spain Passeig Vall d’Hebron, 171, 08035 - Barcelona (SPAIN); Tel: +34 93 3125017; Fax: +34 93 4021363; E-mail: [email protected]
Introduction
The visual system exhibits several anisotropies, and according to Campbell and Kulikowski (1966) and Maffei and Campbell (1970) such anisotropies have a neural basis. One example of them is the inhomogeneous spatial resolution in the visual ield (De Valois & De Valois, 1988). Another type of
anisotropy is related to the perceived orientation of
pictorial elements, such as lines, gratings, and edges.
Certainly, horizontal and vertically oriented lines are
more accurately perceived than oblique lines.
In the past, studies with human beings on orientation of stimuli revealed the well-known oblique effect (see
Appelle, 1972 and Howard, 1982 for a review). It refers to the well-established fact that our discriminability of orientation or direction is signiicantly better around the cardinal (horizontal or vertical) axes compared
to oblique axes. The oblique effect can be found in
a great variety of visual tasks (e.g. grating acuity, Landolt C test, Vernier acuity, contrast sensitivity,
orientation discrimination, motion direction, etc.). As far as animal research is concerned, several studies
have shown evidence for a preferential processing of
horizontal and vertical stimuli. Monkeys, in particular, show a clear oblique effect (Bauer, Owens, Thomas, & Held, 1979), but also the octopus, the goldish, the
pigeon, the rabbit, the squirrel, the rat, the cat, and the
chimpanzee (see Appelle, 1972 for a review of the early
literature on the topic). Nowadays, such effect has not
been completely explained either by psychophysical or
neurophysiological approaches.
Earlier reports on the oblique effect were described by Mach (1861) and Jastrow (1893), who asked observers to copy visually presented lines or to adjust them to a speciic orientation. Three decades later, Emsley (1925) found that the point of best visual acuity
takes place in horizontal and vertical orientations, when
compared to stimuli oriented at 45º or between 110º to 140º. This effect was initially attributed to astigmatism, but even after correcting lenses were it to the subject, the phenomenon remained and was termed ‘residual astigmatism’. More recently, Westheimer (2005) measured Vernier acuity for lines varying in orientation and found that the threshold was 2.29 times greater (less
Interestingly, one experiment conducted by Higgins and Stultz (1948) revealed that tilting the head of the observer up to align the visual ield to the orientation of the lines improved VA. These results suggested that the retinal image orientation was more important than the object orientation. However, subsequent studies have been ambiguous on this point (Luria, 1963; Attneave & Olson, 1967; Horn & Hill, 1969).
From the psychophysical approach, research has produced robust evidence to suggest that the human perception of oblique lines is somewhat inferior to the perception of horizontal and vertical lines (Campbell & Kulikowski, 1966; Davidoff, 1974; Essock, 1990; Heeley & Timney, 1988; Zlaskova, 1993). Research using sinusoidal grating as stimuli have shown that the
accuracy and the precision for high spatial frequencies or low contrast is worse for oblique than for cardinal
orientations (Bowker & Mandler, 1981). Research using oriented lines (Andrews, 1967; Bouma & Andriessen, 1968; Westheimer & Beard, 1998) has also revealed
the oblique effect both in accuracy (e.g., constant error) and precision (e.g., standard deviation). That is why the
oblique effect is currently thought to be one of the most robust effects in human psychophysics.
From the neurophysiological approach, research
on the oblique effect has been interested in providing
evidence on its underlying neural mechanisms. It began
with the discovery of orientation detectors in the visual
cortex of cats and monkeys by Hubel and Wiesel (1959, 1977), and Pettigrew, Nikara and Bishop (1968). Since
then, a great deal of studies have shown that in the
visual cortex of animals there are more cells responding
to horizontal and vertical than to oblique orientations
(DeValois, Yund, & Hepler, 1982; Kennedy, Martin, Orban, & Whitteridge, 1985; Mansield & Ronner, 1978; Coppola, White, Fitzpatrick, & Purves, 1998; Keil & Cristobal, 2000). As far as neuroscience is concerned,
Maffei and Campbell (1970) found an oblique effect in humans by means of visual evoked potential, and Li,
Peterson and Freeman (2003) analysed a population of 4,418 cells in the striate cortex of the cat. They found
that both quantity of cells and bandwidth of orientation tuning varied as a function of the preferred orientation.
They demonstrated that most cells prefer horizontal and
vertical orientations to oblique angles.
Summarizing the above, the oblique effect can be explained by a higher number of neurons available for
processing horizontal and vertical orientations relative
to oblique ones. This imbalance in the allocation of
resources is translated into higher visual acuity at cardinal orientations. An alternative explanation, however,
emphasizes the evolutionary inluence of the layout of objects in the world. According to Keil and Cristobal (2000) this implies ‘‘that the physical structure of the environment provides constraints for the evolutionary process, and it is this structure that also exerts strong
inluences on postnatal development of an organism.’’
(Keil & Cristobal, 2000, p. 697). Thus, the perception of orientation could be ‘‘determined by the relative frequency of the possible sources of angle projections that observers
have experienced.’’(Nundy, Lotto, Coppola, Shimpi, & Purves, 2000, p. 5592).
The rationale for such explanation is based on
the idea that only oblique orientations cause vertical
disparities. Indeed, images have vertical disparities
because the distance between a given point to one eye is greater than that to the other eye. As a consequence of this
asymmetrical convergence, the amplitude of the binocular
subtense angle of these two points is unequal for the left
eye and right eye (Howard & Rogers, 2002). Therefore, the binocular vertical disparity can be computed by the difference between the amplitudes of the binocular
subtense angle in the eyes.
Ogle (1955) demonstrated that, besides horizontal
disparities, vertical disparities could elicit stereoscopic
depth. He also showed some deterioration in the
stereoscopic depth perception as the increase of vertical disparities takes place. However, he found that it decreases down to a null value, beyond which stereopsis does not occur, with the increasing of the peripheral
angle of the stimulus. Therefore, according to Ogle, the existence of deinite limits in the extent to which both horizontal and vertical disparities may be introduced,
without abolishing stereoscopic depth, suggests the
existence of neuroanatomical limiting structures and a
neurophysiological process for stereopsis.
In order to verify the role of vertical disparities
in the oblique effect, we conducted a psychophysical
experiment using two parallel oriented lines, in which two-dimensional (2D) Vernier acuity and three-dimensional (3D) stereoacuity were compared. In the case of 2D visual acuity, the observer was asked to judge vertical separation, while in the case of 3D visual acuity (stereoacuity), the participant was asked to perform judgments about the separation of the lines in depth. Obviously, in the perception of a 3D visual scene, lines oriented 90º practically do not present vertical disparity. On the other hand,
oblique lines produce vertical disparities which vary
in accordance to the stimulus orientation. In the case of 2D visual acuity, variations in vertical disparities
are practically negligible.
Experiment: Method
Subjects
Stimuli
Standard stimuli consisted of two 50 mm-long parallel red lines against a black background. Depending on the experimental condition the lines could be oriented at 0º, 15º, 30º, 45º, 60º, 75º and 90º. As Figure 1 shows, in the case of Vernier acuity (2D stimuli), the horizontal
(∆H) and vertical (∆V) separations were kept constant to
15 mm and 16 mm, respectively, in all orientations. In the
case of stereoacuity, the separation in depth (∆D) was it
to 20 mm, and the length of the lines and the horizontal separation between them (∆H) were kept constant.
In the case of 2D stimuli, nine comparison stimuli were equal to the standard stimulus except that the vertical
separation between the two lines could vary between 12 and
20 mm, with 1 mm increases (12, 13, 14, 15, 16, 17, 18, 19, 20). Since the viewer’s distance from the screen was 1 m, the subtended visual angle of the lines of the standard stimulus was 2.86º, being 0.86º the horizontal separation and 0.92º (or 55 min arc) the vertical separation. Vertical separations of the comparison stimuli varied from 41.25 to 68.75 min arc.
As for the 3D stimuli, the comparison stimuli varied
only in the separation in depth (∆D), which could randomly
range from 12 to 28 mm in steps of 2 mm (12, 14, 16, 18, 20, 22, 24, 26, 28). That is to say, the angular separation in depth varied from 41.25 to 96.23 min arc, with steps of 6.87 min arc. The steps were greater in this condition because the judgments are more dificult to be performed.
The color used for the Vernier lines was always red.
All stimuli were generated and displayed by using a PC Pentium V 3000 MHz, with a 3D-Lab Wildcat VP 870 stereo graphic card. Stereoscopic stimuli (3D case) were presented by means of shooter goggles (LCD) by CrystalEyes®. However, in the 2-D case, stimuli were
seen without goggles (*).
A computer program written in C++ and the glut32 library under OpenGL generated and randomly presented the stimuli in the experiment. We designed
14 tests, seven for 2D Vernier acuity and other seven for stereoacuity. A speciic program, according to the method of constant stimuli, was elaborated for each one of the seven orientations (0º, 15º, 30º, 45º, 60º, 75º, 90º). A chinrest allowed us to control head position and
distance of the observer to the stimulus.
Procedure
The observer was seated in a chair in front of the
computer, with his head on the chinrest. The screen was
positioned in the frontoparallel plane and stimuli were
registered ixating the gaze directly on them (i.e., central visual ield). The room was dimly lit (4 cd/m2). The
participant was instructed for a brief period of training (20 trials) to respond to the stimuli, according to the method of constant stimuli, by clicking with the left (longer) or the right (shorter) button of the mouse. After this training, the observer was asked to perform 14 tests, which consisted of two visual conditions, namely, the 2D Vernier acuity and the 3D stereoacuity; in each one of them the lines were presented in seven different orientations. We will refer to the test composed by nine vertical separations repeated eight times (72 trials) as an orientation block.
The task of the observer consisted of deciding
whether the bars of the comparison stimulus were more or less separated than the bars of the standard stimulus (two-alternative forced choice experimental paradigm), by clicking on the right and left buttons of the mouse, respectively. Of course, in the case of 2D Vernier acuity,
the participant attended to the vertical separation (∆V),
whereas in the case of 3D stereoacuity, the participant attended to the separation of the lines in depth. In an
orientation block, the trial sequence began with a short
warning sound (a beep with a 100 ms duration and 500 Hz
frequency), followed by the presentation of the standard
stimulus (two oriented lines) on the screen for 1500 ms. After a delay of 500 ms, the comparison stimulus was
Figure 1. Standard stimulus used in the case of 2D Vernier acuity for 0º orientation.
then presented for 1500 ms. The observer had no time constraints to respond to the stimuli and 1 s after his response a new trial was displayed. Each orientation block took around 10 min to be concluded. In the experimental
sessions, each orientation block was presented three
times. The participant performed all the experiment in seven sessions of six blocks (14 blocks x 3 repetitions = 42 blocks). Three minutes of interval were given between
blocks to the participant, therefore each session lasted
90 min. In brief, the observer performed 3024 trials, involving 10 hours and 30 minutes of experiment.
Difference threshold was calculated as the between-quartile half-difference in min arc by the formula: DT= (Q3 – Q1)/2 ; where Quartile 1 is the value for the proportion point equal to 0.25 and Quartile 3 is the value for the proportion point equal to 0.75.
Results
We measured the participant’s capability for discriminating line separation in 14 tests, which resulted from the combination of two visual conditions (2D and 3D
separations) by seven orientations. Two psychophysical
parameters were used, one to indicate accuracy of the comparison judgments (constant error) and another to
indicate precision or sensitivity (difference threshold).
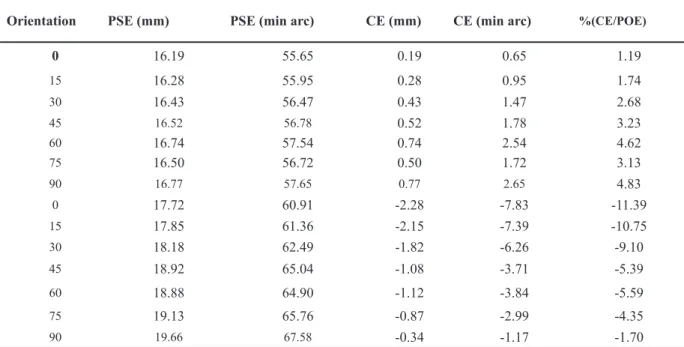
In Table 1, values of the Point of Subjective Equality (PSE) and constant error (CE) for all tests are presented.
Notice that we use the percentage of constant error
(%CE) with respect to the Point of Objective Equality (POE), in order to enable the comparison between the 2D and 3D visual conditions.
Figure 2 shows the percentage of CE by plotting the two visual conditions (2D and 3D) as a function of the
orientation of the lines. We it a linear function to these
points and Figure 2 shows the regression equation and
the determination coeficient for both 2D Vernier acuity and 3D stereoacuity. In the latter, the percentage of CE can be superior to 10%, whilst in the case of 2D the percentage of constant errors (%CE) was lower than 5%. In Figure 2, we can see an opposite trend between these two visual conditions, increasing from 0º to 90º in the two-dimensional case, but decreasing from 0º to 90º in the three-dimensional one. Therefore, these slopes reveal the inluence of the orientation of the Vernier lines on the
accuracy for visual acuity. Thus, we have obtained a good
linear it in both cases, two-dimensional visual condition (2D: R2= 0.80; S.E. = 0.66) and stereo or
three-dimensional case (3D: R2= 0.95; S.E. = 0.87).
We want to highlight two details of these results.
First, in both visual conditions an oblique effect has
been found; that is to say, the percentage of the constant error (%CE) increased and decreased, respectively, for the 2D and 3D conditions as a function of the orientation
of the lines. Second, this change surprisingly occurred in an opposite sense with respect to the orientation.
That is to say, we found a systematic trend toward some overestimation in the case of the 2D visual condition and this trend was inverted (underestimation) in the case of the 3D visual condition. More precisely, the slope shows an opposite trend, namely, in the 2D case, as the orientation increased, %CE also increased, whilst in the 3D case, as the orientation increased, %CE decreased. Certainly, a signiicant difference between the slopes of
the regression lines with respect to the null hypothesis
(0º inclination of the slope, which would indicate that orientations do not affect the judgments) was found in both conditions: 2D VA [t(10)= 4.408; P<.007;
Orientation PSE (mm) PSE (min arc) CE (mm) CE (min arc) %(CE/POE)
0 16.19 55.65 0.19 0.65 1.19
15 16.28 55.95 0.28 0.95 1.74
30 16.43 56.47 0.43 1.47 2.68
45 16.52 56.78 0.52 1.78 3.23
60 16.74 57.54 0.74 2.54 4.62
75 16.50 56.72 0.50 1.72 3.13
90 16.77 57.65 0.77 2.65 4.83
0 17.72 60.91 -2.28 -7.83 -11.39
15 17.85 61.36 -2.15 -7.39 -10.75
30 18.18 62.49 -1.82 -6.26 -9.10
45 18.92 65.04 -1.08 -3.71 -5.39
60 18.88 64.90 -1.12 -3.84 -5.59
75 19.13 65.76 -0.87 -2.99 -4.35
90 19.66 67.58 -0.34 -1.17 -1.70
S.E.= .008] and 3D stereo [t(10)= 9.82; P<.001; S.E.= .011]. Alternatively, the percentage of constant error (%CE_POE) was analyzed with an ANOVA taking visual condition (2D and 3D) and orientation (0º, 15º, 30º, 45º, 60º, 75º, 90º) as between subjects factors and each repetition block (3 blocks) as a new measure. Mean percentage of the constant error for the two visual
conditions as a function of the orientation are plotted
in Figure 2. Overall, constant error varied with visual condition [F(1,154)= 68.575; P<.001] and orientation [F(1,154)= 2.354; P<.033]; however, the interaction between these two factors was not signiicant [F(1,154)= 0.606; P>.60]. Therefore, in respect to accuracy (%CE),
such factors operate in an independent way.
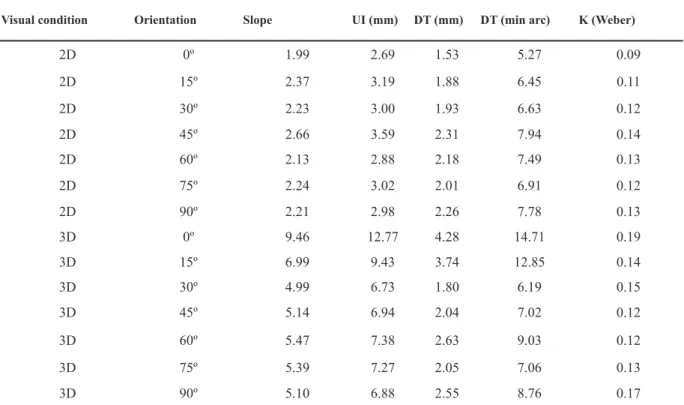
In Table 2, we show the slopes of the psychometric function, the uncertainty interval (UI), the differential threshold (DT) and the Weber fraction (K).
Figure 3 shows the psychometric functions, i.e., the probability that the separation of the comparison stimuli was greater than the separation of the standard stimulus (Cp > St) for each orientation. The slope of the psychometric function indicates the sensitivity (precision)
of the observer in the task, where the greater the slope, the higher the precision. Figure 3 shows, respectively,
all slopes for the 2D and 3D stimuli as a function of
the orientation of the lines. As we can see, slopes were
greater for 2D stimuli, which implies a greater sensitivity of the participant in judging 2D than 3D separations. Interestingly, in the case of 3D separations, the worst sensitivity was obtained for 0º oriented lines, which was modulated by the orientation of the Vernier lines, while in the case of 2D separations no signiicant differences were
found between different orientations.
The difference threshold (DT) may be interpreted as the reciprocal of the sensitivity (DT= 1/sensitivity).
Therefore, a low value indicates a high capability to
discriminate the separation between stimuli (standard and comparison). The Weber fraction (K= DT/POE, where POE means Point of Objective Equality or standard value) also informs us about the sensitivity, but not in a dimensional way. Figure 4 shows that in both cases, in the 2D and 3D separations, values of the differential threshold vary from 0º to 90º oriented lines. Surprisingly, such changes were not exactly the same for the different orientations. These igures (3 and 4) show that, in general, the discrimination was worse for judging 3D separations in comparison to 2D ones, particularly for 0º oriented lines. These results are curious, because
Visual condition Orientation Slope UI (mm) DT (mm) DT (min arc) K (Weber)
2D 0º 1.99 2.69 1.53 5.27 0.09
2D 15º 2.37 3.19 1.88 6.45 0.11
2D 30º 2.23 3.00 1.93 6.63 0.12
2D 45º 2.66 3.59 2.31 7.94 0.14
2D 60º 2.13 2.88 2.18 7.49 0.13
2D 75º 2.24 3.02 2.01 6.91 0.12
2D 90º 2.21 2.98 2.26 7.78 0.13
3D 0º 9.46 12.77 4.28 14.71 0.19
3D 15º 6.99 9.43 3.74 12.85 0.14
3D 30º 4.99 6.73 1.80 6.19 0.15
3D 45º 5.14 6.94 2.04 7.02 0.12
3D 60º 5.47 7.38 2.63 9.03 0.12
3D 75º 5.39 7.27 2.05 7.06 0.13
3D 90º 5.10 6.88 2.55 8.76 0.17
Figure 2. Percentages of Constant Error (CE) in relation to the Point of Objective Equality (POE) for the seven orientations in the 2D and 3D visual conditions.
the worst discrimination in the 3D condition coincides with the lowest vertical disparity, i.e., 0º oriented lines.
The difference threshold (DT) was analyzed with an ANOVA taking visual condition (2D and 3D) and orientation (0º, 15º, 30º, 45º, 60º, 75º, 90º) as between subjects factors and each repetition block (3 blocks by 4 participants, N= 12) as a new measure. Mean percentage of DT for the two visual conditions as a function of the orientation are plotted in Figure 4. Overall sensitivity (DT) varied with visual condition [F(1,154)= 6.201; P<.014]. However, neither the orientation [F(1,154)= 0.382; P<.89] nor the interaction between these two factors [F(1,154)= 0.823; P<.554] were signiicant.
In brief, the most important result is that sensitivity (DTs) varied according to visual condition. No differences between orientations were found, except when the orientation was close to horizontality (lower than 30º).
In order to verify if the oblique effect inluences the perception of vertical disparities in a 3D visual condition,
we calculated vertical disparities between lines for all
orientations in the 3D condition (Figure 5). The segment
∇v represents the size of vertical disparities in cardinal (0º) [left panel] and oblique orientations (approximately 60º) [right panel]. From this vertical disparity, we computed the
distance in depth (vertical separation) for all orientations by ∇v= cos (θ) POE, where ∇v is the vertical disparity, θ
is the orientation of the lines, and POE = 20 mm (standard value) for the 3D case. The values of the vertical disparities
for each orientation are presented in Table 3. Notice that
DT is greater when vertical disparity is greater, but only if segments form an angle lower than 30º.
Figure 6 shows vertical disparities and Weber fraction
(∆I/I) for the 3D condition and reveals a common trend between the lines, but only if the orientation is lower
than 45º (Rxy = 0.83). As a result of the comparison, we can conclude that the data it well only if vertical
disparities are greater than horizontal ones.
Discussion
With the aim of studying the oblique effect, we conducted one experiment in which the participant was asked to compare the separation of two lines in the frontoparallel (2D) and median planes (3D). We designed 14 tests by combining 2 visual conditions and 7 orientations. The results showed that, in both cases (2D and 3D separations), if the two lines were presented obliquely, visual acuity (2D VA) and stereoacuity (3D stereo VA) varied inversely, namely, overestimation in the 2D case and underestimation in the 3D. In this last case, such variation was proportional to the cos (θ). Additionally, as the inclination of the lines increases, the relative separation between them decreases, which promotes a diminishing of vertical disparities. Therefore, for orientations lower than 45º, the effect of vertical disparity progressively diminishes.
One evidence for vertical disparities as the main
feature to be processed in the case of inclined lines, i.e., in favour of the oblique effect, are the similarities with the so-called induced-effect (Ogle, 1950), in which two halves of a stereogram are identical, except that one is magniied vertically with respect to the other. According to Ogle, with such stereogram the observer stereoscopically perceives the image as a slanted surface rotated on its vertical axis. It is also possible to promote the same impression of a slanted surface by manipulating horizontal disparities, namely, by magnifying one half of the stereogram horizontally. This
is the so-called geometrical effect (Ogle, 1950). However, an important difference between those two effects is that
the depth sign of a given vertical disparity depends on the
quadrant around the ixation point, while the depth sign of
a given horizontal disparity is independent of the quadrants Figure 4. Differential threshold for the 2D and 3D visual
conditions as a function of orientation of the lines.
(Westheimer, 1984; Westheimer & Pettet, 1992).
It is widely accepted that the role of the vertical disparity is essentially different from that of the horizontal disparity. Indeed, vertical disparities are greater at larger eccentricities (Ogle, 1955); they do not have a consistent local sign (Matthews, Meng, Xu, & Qian, 2003); their effect can be demonstrated with large stimuli (Howard & Kaneko, 1994); and vertical disparities appear to be
averaged over greater areas than horizontal disparities
(Kaneko & Howard, 1997). That is why most authors
think that vertical disparities act globally while horizontal
disparities act locally (Howard & Rogers, 1995).
In the last decades, a great deal of theories on vertical disparity have been proposed after that by Ogle (1950), such as those by Koenderink and van Doorn, (1976), Arditi, Kaufman and Movshon (1981), Mayhew and Longuet-Higgins (1982), Rogers and Bradshaw (1993), Howard and Kaneko (1994), Backus, Banks, van Ee, and Crowell (1999), and Garding, Porrill, Mayhew and Frisby (1995). More recently, Matthews et al. (2003) proposed a theory for depth perception from vertical disparity based on concepts of
the oriented binocular receptive ields of the visual cortical
cells developed by Freeman and collaborators (Anzai, Ohzawa, & Freeman, 1999a, 1999b; DeAngelis, Ohzawa, & Freeman, 1991; Ohzawa, DeAngelis, & Freeman, 1990, 1996, 1997) and in principles of the radial bias of
the preferred-orientation distribution in the cortex (Bauer
& Dow, 1989; Vidyasagar & Henry, 1990). This theory naturally integrates the measurement and the interpretation of vertical disparity, explains the induced effect and
local depth effects of vertical disparities, and suggests
a uniied framework for understanding the relationship
between vertical and horizontal disparities. They have
also psychophysically conirmed two key predictions of the theory by using stimuli oriented at 45º. One of them has to do with the enhancement and cancellation between
horizontal and vertical disparities, and the other one shows the dependence of the orientation on the vertical disparity.
Our results agree with this theory and give support to
the radial bias of the preferred-orientation distribution in
the cortex and beyond V1. And, more important, our data conirm the prediction of this model, which associates the
effects of the vertical disparities to the orientation of the
stimuli. We have certainly showed that, irst, sensitivity is maximal (i.e., DT is lower) when vertical disparities are lower (lines oriented upper than 45º). Second, the sensitivity is minimal for greater vertical disparities (lines oriented at 0º). Third, that as vertical disparities diminish (until 45º), the stereoscopic sensitivity is enhanced. Fourth, that vertical disparity can exhibit a local effect,
besides the well-known global one. Nevertheless, not only the ending point of the lines has a relevant role
in our experiment, but also the orientation of the lines. Indeed, one stereogram composed by lines oriented at 0º and another composed by lines oriented at 90º can have the same ending point (near the ixation point, in the center of the stereograms). However, the difference
in the orientation of the lines produce the opposite
effect, i.e., the maximal or the minimal sensitivity. This
Orientation 0º 15º 30º 45º 60º 75º 90º
Vertical disparity (mm) 20.00 19.32 17.32 14.14 10.00 5.18 0.00
Horizontal disparity (mm) 0.00 5.18 10.00 14.14 17.32 19.32 20.00
Ratio (VD/HD) ∞ 3.73 1.73 1.00 0.58 0.27 0.00
Figure 5. Sketch illustrating the calculation of the vertical disparities in cardinal (0º) [left panel] and oblique (60º) [right panel] orientations.
Table 3. Vertical disparities for each segment orientation.
suggests that the global effect of the vertical disparity is
more powerful than the local effect. We expect to study, in the future, the conlict between the sign of the depth
for the origin and ending points of the line, that is to say, how these points cancel or enhance depth perception in
stereograms with vertical disparities.
At last, we would like to highlight two ideas. One
refers to the site for processing vertical disparities. The
model proposed by Matthews et al. (2003) is based on the properties of the receptive ields associated to cells in V1. However, as stated by the authors, it implies that
binocular depth perception necessarily takes place in V1. Subsequent processing beyond V1, probably in V2
and V3 feed-forward circuits, could contribute to extract
vertical disparities and, after such processing, feedback
neural pathways would return information to V1 to
generate depth perception. The second idea is related to
the assumption of the radial orientation bias of the model of Matthews et al. (2003). Physiological differences in the number of cells processing cardinal orientations with respect to the oblique ones have been found in the cortex of cats (Vidyasagar & Henry, 1990) and monkeys (Bauer & Dow, 1989). However, only psychophysical evidence is available in the case of humans (the oblique effect)
and our study provides an additional support to this
approach. We think that the oblique effect in stereoacuity can be best explained by the model of Matthews et al. (2003), and that the absence of oblique effect in the case of the acuity for 2D stimuli is due to the lack of vertical
disparities in such a condition.
Acknowledgements
This research was supported by grant SEJ2006-15095/ PSIC from the Spanish Ministry of Science and Technology.
References
Andrews, D.P. (1967). Perception of contour orientation in the central fovea. I. Short lines. Vision Research, 7, 975–997.
Anzai, A., Ohzawa, I., & Freeman, R.D. (1999a). Neural mechanisms for processing binocular information: I. Simple cells. Journal of Neurophysiology, 82, 891–908.
Anzai, A., Ohzawa, I., & Freeman, R.D. (1999b). Neural mechanisms for processing binocular information: II. Complex cells. Journal of Neurophysiology, 82, 909–924.
Appelle, S. (1972). Perception and discrimination as a function of orientation: The “oblique effect” in man and animals. Psychological Bulletin, 78, 266–278.
Arditi, A., Kaufman, L., & Movshon, J.A. (1981). A simple explanation
of the induced size effect. Vision Research, 21, 755–764. Attneave, F., & Olson, R.K. (1967). Discriminability of stimuli varying
in physical and retinal orientation. Journal of Experimental Psychology, 74, 149–157.
Backus, B.T., Banks, M.S., van Ee, R., & Crowell, J.A. (1999).
Horizontal and vertical disparity, eye position, and stereoscopic slant perception. Vision Research, 39, 1143–1170.
Bauer, J.A., Owens, D.A., Thomas, J., & Held, R. (1979). Monkeys
show an oblique effect. Perception, 8, 247–253.
Bauer, R., & Dow, B.M. (1989). Complementary global maps for orientation coding in upper and lower layers of the monkey’s foveal striate cortex. Experimental Brain Research, 76, 503–509. Bouma, H., & Andriessen, J.J. (1968). Perceived orientation of isolated
line segment. Vision Research, 8, 493–507.
Bowker, D.O., & Mandler, M.B. (1981). Binocular licker appears faster than monocular licker. Journal of the Optical Society of America, 71, 496–498.
Campbell, F.W., & Kulikowski, J.J. (1966). Orientational selectivity of the human visual system. Journal of Physiology, 187, 437–445. Coppola, D.M., White, L.E., Fitzpatrick, D., & Purves, D. (1998).
Unequal representation of cardinal and oblique contours in ferret
visual cortex. Proceedings of the National Academy of Sciences, U.S.A., 95, 2621–2623.
Davidoff, J.B. (1974). An observation concerning the preferred perception
of the visual horizontal and vertical. Perception, 3, 47–48. DeAngelis, G.C., Ohzawa, I., & Freeman, R.D. (1991). Depth is
encoded in the visual cortex by a specialized receptive ield
structure. Nature, 352, 156–159.
DeValois, R. L., & DeValois, K. K. (1988). Spatial vision. Oxford University Press, New York.
DeValois, R.L., Yund, E.W., & Hepler, N. (1982). The orientation and direction selectivity of cells in macaque visual cortex. Vision Research, 22, 531–544.
Emsley, H.H. (1925). Irregular astigmatism of the eye: Effects of
correcting lenses. Transactions of the Optical Society, 27, 28–41. Essock, E.A. (1990). The inluence of stimulus length on the oblique
effect of contrast sensitivity. Vision Research, 30, 1243–1246. Garding, J., Porrill, J., Mayhew, J.E.W., & Frisby, J.P. (1995).
Stereopsis, vertical disparity and relief transformations. Vision Research, 35, 703–722.
Heeley, D.W., & Timney, B. (1988). Meridional anisotropies of orientation discrimination for sine wave gratings. Vision Research, 28, 337–344.
Higgins, G.C., & Stultz, K. (1948). Visual acuity as measured with various orientations of a parallel-line test object. Journal of the Optical Society of America, 38, 756–758.
Horn, G., & Hill, R.M. (1969). Modiications of receptive ields of cells in the visual cortex occurring spontaneously and associated
with bodily tilt. Nature, 221, 186–188.
Howard, I.P. (1982). Human visual orientation. Chichester, Sussex:
John Wiley.
Howard, I.P., & Kaneko, H. (1994). Relative shear disparity and the
perception of surface inclination. Vision Research, 34, 2505–2517. Howard, I.P., & Rogers, B.J. (1995). Binocular vision and stereopsis.
New York, NY: Oxford University Press.
Howard, I.P., & Rogers, B.J. (2002). Seeing in depth: Depth perception
(vol. 2). Toronto: I. Porteus.
Hubel, D.H., & Wiesel, T.N. (1959). Receptive ields of single neurons in the cat’s striate cortex. Journal of General Physiology, 39, 651–673. Hubel, D.H., & Wiesel, T.N. (1977). Functional architecture of
macaque monkey visual cortex. Proceedings of the Royal Society of London B, 198, 1–59.
Jastrow, J. (1893). On the judgment of angles and positions of lines. American Journal of Psychology, 5, 214-248.
Kaneko, H., & Howard, I.P. (1997). Spatial limitation of vertical-size
disparity processing. Vision Research, 37, 2871–2878. Keil, M.K., & Cristobal, G. (2000). Separating the chaff from the
wheat: Possible origins of the oblique effect. Journal of the Optical Society of America A, 17(4), 697–710.
Kennedy, H., Martin, K., Orban, G.A., & Whitteridge, D. (1985). Receptive ield properties of neurons in visual area 1 and visual
area 2 in the baboon. Neuroscience, 14, 405–415.
Koenderink, J.J., & van Doorn, A.J. (1976). Geometry of binocular vision and a model for stereopsis. Biological Cybernetics, 21, 29–35. Li, B., Peterson, M.R., & Freeman, R.D. (2003). The Oblique Effect:
A neural basis in the visual cortex.Journal of Neurophysiology, 90, 204–217.
Luria, S. M. (1963). The effect of body-position on meridional
variations in scotopic acuity. American Journal of Psychology, 76, 598–606.
Mach, E. (1861). Über das Sehen von Lagen und Winkeln durch
die Bewegung des Auges. Sitzungsberichte der Kaiserlichen Akademie der Wissenschaften, 43, 215–224.
Maffei, L., & Campbell, F.W. (1970). Neurophysiological localization of the vertical and horizontal visual co-ordinates in man. Science, 167, 386–387.
Mansield, R.J.W., & Ronner, S.F. (1978). Orientation anisotropy in monkey visual cortex. Brain Research, 149, 229–234.
theory of depth perception from vertical disparity. Research 43, 85–99.
Mayhew, J.E.W., & Longuet-Higgins, H.C. (1982). A computational model of binocular depth perception. Nature, 297, 376–379. Nundy, S., Lotto, B., Coppola, D., Shimpi, A.; & Purves, D. (2000).
Why are angles misperceived? PNAS, 97, 5592–5597.
Ogle, K.N. (1950). Researches in binocular vision. Philadelphia, PA:
W. B. Saunders.
Ogle, K.N. (1955). Stereopsis and vertical disparity. AMA Archives of Ophthalmology, 53, 495–504.
Ohzawa, I., DeAngelis, G.C., & Freeman, R.D. (1990). Stereoscopic depth discrimination in the visual cortex:
Neurons ideally suited as disparity detectors. Science, 249,
1037–1041.
Ohzawa, I., DeAngelis, G.C., & Freeman, R.D. (1996). Encoding of binocular disparity by simple cells in the cat’s visual cortex. Journal of Neurophysiology, 75, 1779–1805.
Ohzawa, I., DeAngelis, G.C., & Freeman, R.D. (1997). Encoding of binocular disparity by complex cells in the cat’s visual cortex. Journal of Neurophysiology, 77, 2879–2909.
Pettigrew, J.D, Nikara, T., & Bishop, P.O. (1968). Binocular interaction
on single units in cat striate cortex: simultaneous stimulation by single moving slit with receptive ields in correspondence. Experimental Brain Research, 6, 391–410.
Rogers, B.J., & Bradshaw, M.F. (1993). Vertical disparities, differential
perspectives and binocular stereopsis. Nature, 361, 253–255. Vidyasagar, T.R., & Henry, G.H. (1990). Relationship between
preferred orientation and ordinal position in neurons of cat
striate cortex. Visual Neuroscience, 5, 565–569.
Westheimer, G. (1984). Sensitivity for vertical retinal image
differences. Nature, 307, 632–634.
Westheimer, G. (2005). Anisotropies in peripheral Vernier acuity.
Spatial Vision, 18, 159–167.
Westheimer, G., & Beard, B.L. (1998). Orientation dependency for foveal line stimuli: Detection and intensity discrimination, resolution, orientation discrimination and Vernier acuity. Vision Research, 38, 1097–1103.Westheimer, G., & Pettet, M.W. (1992). Detection and processing of vertical disparity by the human observer. Proceedings of the Royal Society of London B, 250, 243–247.

![Figure 5. Sketch illustrating the calculation of the vertical disparities in cardinal (0º) [left panel] and oblique (60º) [right panel] orientations.](https://thumb-eu.123doks.com/thumbv2/123dok_br/19011016.467444/7.892.103.437.106.395/figure-sketch-illustrating-calculation-vertical-disparities-cardinal-orientations.webp)
