Article
Printed in Brazil - ©2017 Sociedade Brasileira de Química 0103 - 5053 $6.00+0.00
*e-mail: [email protected]; [email protected]
New 9-Aminoacridine Derivative: Synthesis
,
Study and Potential Application as
pH Indicator in Organic Solvents
Pedro H. F. Stroppa,* Nícolas Glanzmann, Lucas M. Duarte, Renata T. Sato,
Marcone A. L. de Oliveira* and Adilson D. da Silva
Departamento de Química, Instituto de Ciências Exatas (ICE), Universidade Federal de Juiz de Fora, Campus Universitário, 36036-900 Juiz de Fora-MG, Brazil
In this work, we describe the synthesis of a novel 9-aminoacridine derivative that presents surprisingly different colors when exposed to neutral, acidic or basic mediums with potential application as pH indicator in organic solvents. Furthermore, pKa and molar absorptivity values were determined and theoretical studies supported by density functional theory (DFT) calculations were performed to elucidate the different structures of this compound.
Keywords: 9-aminoacridine derivative, pH indicator, organic medium
Introduction
9-Aminoacridine (9-AA) is a polycyclic heteroaromatic compound with three fused rings that can be used as
specific fluorescent.1,2 Its derivatives, which also have
fluorescence properties and are typically colored, have
a wide range of applications such as biological activity3
against neurodegenerative diseases and protozoal
parasites.4 The anticancer effect of nitro-9-aminoacridine
derivatives is reported in the literature.5,6 The 9-AA is also
described to be a suitable matrix for the matrix assisted laser desorption/ionization (MALDI) and can even be
used as indicator of transmembrane pH difference.7-9 A
pH indicator highlights changes in the hydrogenionic potential and can be used to determine chemical processes involving acids and bases. More complex methods of quantifying acidity require expensive instrumentation,
what makes the usage of pH indicators still important.10
A relevant application of pH indicators concerns the monitoring of biochemical processes through color changes at visible wavelengths representing protonation
and deprotonation of species.11 Several dyes have been
used as pH indicators by the reversible action of acid
and base forms.12
The pKa value is an important physicochemical parameter to predict the ionization state of a substance for the measurements of pH-dependent molecular properties (solubility and lipophilicity, for example)
and in applications such as liquid chromatography and capillary electrophoresis for the separation of ionizable
compounds.13,14 There are several methods to determine
pKa values, such as potentiometric titration,15
ultraviolet-visible (UV-Vis) absorption spectroscopy,16 calorimetry,17
nuclear magnetic resonance (NMR) spectroscopy,18 and
capillary electrophoresis.19 These are useful techniques
for the determination of equilibrium constants due to its accuracy and reproducibility.
In this work, it was synthesized the compound 2,4,5,7-tetranitro-9-aminoacridine (TNA), introducing four nitro groups in the aromatic rings of 9-AA (Figure 1), and the new derivative presented different colorations when exposed to neutral, acidic or basic mediums. Moreover, we performed a potentiometric titration to determine its pKa values in different mediums and we also confirmed the structures present in each medium through density functional theory (DFT) calculations.
Experimental
Materials
Physical methods and techniques
Shimadzu UV-1800 spectrophotometer with 1 cm path length quartz cell was used to obtain the UV-Vis spectra and for absorption measurements. Digimed D-22 pHmeter (São Paulo, Brazil) fitted with combination Ag/AgCl pH
electrode. 1H and 13C NMR spectra were recorded on
Bruker Avance III HD 500 (Germany). The mass of the molecular ion was identified through analysis by matrix assisted laser desorption/ionization - time of flight mass spectrometer (MALDI-TOF MS) using a pulsed nitrogen
ultraviolet laser (λ = 337 nm) of an AXIMA Performance
MALDI-TOF MS (Shimadzu Biotech, Japan).
Synthesis of TNA
The synthesis procedure described herein to obtain the 2,4,5,7-tetranitro-9-aminoacridine (Scheme 1) was recently
published by our research group.20 In a round-bottom flask,
0.669 g of 9-aminoacridine hydrochloride monohydrate was added and the flask was submitted to an ice bath.
Then, 4.5 mL of concentrated H2SO4 and 0.47 mL of
HNO3 65% were added dropwise and the mixture was left
stirring for 30 minutes. After that, the ice bath was removed and the mixture was heated at 90 °C for 30 minutes. The product crashed out as a yellow solid. Following that, the precipitate was dissolved in methanol and neutralized
with a NH4OH 1.0 mol L-1 solution reaching pH 7 and,
in sequence, the product was isolated through a vacuum filtration, washed with cold water and dried in a stove. The TNA was obtained as an orange solid with 87%
yield. 1H NMR (500 MHz, DMSO-d
6) d 9.03 (d, 2H,
J 2.3 Hz, CH), 9.73 (d, 2H, J 2.3 Hz, CH), 10.02 (s, 2H,
NH2); 13C NMR (125 MHz, DMSO-d6) d 113.5, 120.5,
125.2, 140.0, 143.4, 147.3, 157.2; IR (ATR) ν / cm-1 3371,
3283, 3236, 3094, 1666, 1617, 1503, 1339, 1092, 730.
MALDI-TOF MS m/z, calculated for C13H7N6O8 [M + H]+
375.0325, found 375.0326. The remaining spectra and other characterizations can be found in the Supplementary Information.
Computational methods
Quantum mechanical calculations by DFT using the
Gaussian 09 program Rev. D.01 were performed.21 B3LYP
hybrid functional22 and the 6-311+G(2d) basis set were
used. Firstly, the geometries of protonated, neutral and deprotonated TNA were optimized at B3LYP/6-311+G(2d) level of theory in methanolic and ethanolic medium.
In this work, the polarized continuum model (PCM),23
a self-consistent reaction field method, was used to investigate the solvent effect. With the optimized structures, in methanol and ethanol, the electronic spectra for the three TNA species, using the time-dependent density functional theory (TD-DFT) method, were predicted.
Results and Discussion
UV-Vis spectra
The TNA compound presents a variation in its coloration due to changes in the hydrogenionic concentration, which produces an alteration in the chemical structure of the molecule according with the equilibrium described in Figure 2. This is an essential feature in pH indicator compounds. In acidic medium (pH < 4), the compound presents itself in a yellow coloration (protonated TNA), while in neutral medium (pH ca. 7), the coloration changes to orange, and in basic medium (pH > 10), the solution becomes red (deprotonated TNA). This color gradient can be observed in Figure 2.
This color palette was characterized using the UV-Vis technique applied to each of the species in methanol, as well as the precursor 9-AA in a wavelength range between 200 and 800 nm (Figure 3). The UV-Vis spectra
Figure 1. Structure of TNA compound.
for the three species of TNA in ethanol can be found in the Supplementary Information.
A bathochromic shift can be observed when migrating from the protonated to the neutral and, then, to the deprotonated species with maximum absorption values in 368, 416 and 500 nm, respectively (Figure 3a). In Figure 3b, it can also be observed a bathochromic shift between the maximum absorption of 9-AA (400 nm) and the maximum absorption for the neutral TNA (416 nm).
Absorptivity determination procedure
The absorptivity and molar absorptivity (ε) give the
probability that the analyte will absorb a photon of given
Figure 2. Color gradient and equilibrium for the TNA species (methanolic solutions).
Figure 3. UV-Vis spectra obtained for (a) the three TNA species, basic,
acidic and neutral mediums; (b) the 9-AA and the neutral TNA.
energy.24,25 The most common technique to determine ε are
UV-Vis spectroscopic methods, due to their accuracy and
simplicity.26 In UV-Vis spectroscopy, Beer’s law, which
establishes a linear relationship between absorbance and concentration, has great importance.
To determine ε, solutions of TNA in methanol/ethanol
(with pH adjusted to 12 using NH4OH 30%, neutral pH or
pH adjusted to 1 using HCl 37%) were prepared varying the
concentration between 1.18 × 10⁻⁵ and 5.90 × 10⁻⁵ mol L-1,
range within which Beer’s law applies. The analyses were performed in authentic triplicates. Figure 4 shows the linear regression performed to determine the molar absorptivity for the deprotonated TNA in methanol and Table 1 shows the linear regression data. The values for the remaining assays can be found in the Supplementary Information.
All species showed high ε values that are desirable in
quantitative analysis because they show a higher analytical sensibility.26
Potentiometric titration procedure
Potentiometric titrations involve the potential or pH measurements as function of titrant known added volumes. The simplest method to find the end point is to locate the inflection point on the titration curve. Other methods are plotting the first derivate (∆pH/∆V), which presents a separate
peak for each end point, or second derivate (∆2pH/∆2V)
of the curve, in which the end point is indicated by its
intersection with the volume axis.25
About 50 mg of TNA was dissolved in 125 mL of methanol saturated with NaCl, in order to control ionic
strength (methanol ionic strength 235.3 mmol L-1).28,29
The mixture was left for 20 min in a sonicator at room temperature to accelerate the dissolution process. Then, the solution had its pH value adjusted to nearly 1, with
a 0.5 mol L-1 methanolic HCl solution and after that, the
sample was titrated with a 0.0465 mol L-1 standardized
methanolic NaOH solution to obtain the inflection points
for TNA in methanol. The analyses were performed in authentic triplicates. Figure 5a shows one of the curves obtained. The same procedure was repeated to obtain the titration curve for TNA dissolved in ethanol (ethanol ionic
strength 9.4 mmol L-1, Figure 5b).28,29
With aid from the first and second derivatives of the curve it was possible to determine the inflection point and
obtain the values for the pKa1 and pKa2 in methanol as
the means of the data from the three different experiments using a 95% confidence interval for the measurement
uncertainty. The resultant pKa1 was 4.72 ± 0.43 and pKa2
was 8.37 ± 0.77. The inflection point for the ethanol titration was obtained, as described previously for the methanol
titration, and a pKa1 value of 4.83 ± 1.07 and a pKa2 value
of 11.33 ± 0.21 were obtained.
According with the titration curves represented in Figure 5, it can be observed that the second inflection is softer than the first one for both solvents. However, the visual color change is more intense in the orange to red transition than in the yellow to orange one. Observing the titration curves and the difference between the pKa values obtained it is possible to conclude that the influence of the solvent is of vital importance. The dissociation or autoprotolysis constant for a solvent, which relates the concentration of the protonated solvent, to that of the
deprotonated solvent, should be considered.25 This may
explain different inflection points for different solvents.
Although the aim of this work was to study the TNA behavior in methanolic and ethanolic solutions, the solubility of the neutral TNA in other solvents, such as polar protic, polar aprotic, and non-polar solvents, was also tested (Supplementary Information).
Theoretical studies
To gain a better understanding of the different structures of TNA in different mediums and to obtain deeper insights about electronic transitions, color of the samples in different pH and the TNA protonation and deprotonation, DFT calculations were performed bringing significant contributions.
The optimized geometries in ethanol for protonated, neutral and deprotonated TNA as well as the highest occupied molecular orbital/lowest unoccupied molecular orbital (HOMO/LUMO) are shown in Figure 6.
It is interesting to highlight the variation in the C−NH2
bond length as protonation and deprotonation occurs. In
neutral medium the C−NH2 bond length is 1.32828 Å
and after protonation in N10 (see Scheme 1) this same bond length decreases to 1.31167 Å since this nitrogen becomes more deficient in electrons and starts to exercise an electron-withdrawing inductive effect over the amino
group, resulting in a slight C−NH2 bond length shortening.
The more accentuated shortening occurs when the amino
Table 1. Data from the linear regression assays
Solvent Wavelength / nm Absorptivity / (L mol-1 cm-1) R-squared
Protonated TNA ethanol 368 16495.9 ± 199.8 0.998
methanol 363 15853.9 ± 169.6 0.998
Neutral TNA ethanol 416 12300.3 ± 74.4 0.999
methanol 410 13263.3 ± 90.3 0.999
Deprotonated TNA ethanol 468 16151.6 ± 104.9 0.999
methanol 482 16791.3 ± 85.3 0.999
9-AAa − − 16300 −
a9-AA: value obtained from the literature.27
group is deprotonated in basic medium, making the carbon-nitrogen bond acquire a double bond character
(C=NH–), as shown in Figure 6. The C−N bond length
decreases from 1.32828 to 1.28605 Å.
The UV-Vis absorption spectrum of a compound is the result of the electronic transition between occupied molecular orbitals and virtual orbitals. For the three species evaluated in this work, the electronic transition data calculated by B3LYP/6-311+G(2d) and experimental bands in the visible region are shown in Table 2.
Considering the main calculated transitions (high oscillator strength) in the visible region and analyzing the bathochromic shift, where the values found were 405, 437 and 527 nm for the protonated, neutral, and deprotonated TNA, respectively, it was possible to note the same behavior of the experimental data (see Figure 3). This feature can be
correlated with an increase in the π-electron density of the
molecule while the deprotonating process occurs, leading to a decrease in the HOMO-LUMO gap, with values equal to 3.06, 2.83, and 2.35 eV for the protonated, neutral, and deprotonated TNA, respectively, and, consequently, a
bathochromic shift.30
For the protonated TNA, only one wavelength was calculated presenting high oscillator strength and being assigned to an electronic transition between HOMO-LUMO orbitals. In neutral TNA, two wavelengths were calculated; however, the transition between HOMO-LUMO + 1 obtained higher oscillator strength than the HOMO-LUMO transition, being the main spectroscopic event in the visible region. Four electronic transitions were identified through calculations for deprotonated TNA, given that 527 nm is related to the HOMO-LUMO transition and is the most important since it has the highest oscillator strength. All calculated wavelengths for its respective species are within the range of the experimental spectral band. The energy for all transitions involving the molecular orbitals are also included in Table 2.
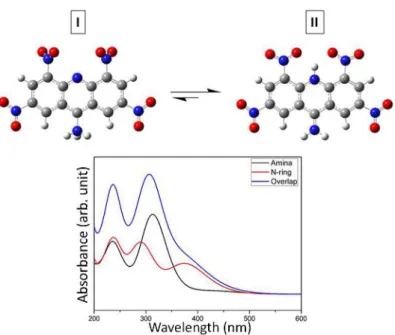
In acidic medium the TNA is protonated in the ring nitrogen (N10) rather than in the amino group, which can be elucidated comparing the theoretical electronic spectrum of each protonated species with the experimental one for the protonated TNA. Figure 7 shows the optimized structures for the TNA protonated in the amino group (I) and in N10 (II) as well as the theoretical spectra.
Figure 6. Optimized structures in ethanol for protonated (I), neutral (II) and deprotonated (III) TNA and their HOMO/LUMO molecular orbitals. The
arrow with color gradient is related to the observed color in experimental preparation as shown in Figure 2.
Table 2. Experimental and theoretical electronic transition data in the visible region for TNA in ethanol
MOt λExp / λmax / nm λCalc / nm OS ∆E / eV
Protonated TNA HOMO → LUMO 400-450 / 400 405 0.1205a 3.06
Neutral TNA HOMO → LUMO 400-510 / 416 461 0.0495 2.69
HOMO → LUMO + 1 437 0.4672a 2.83
Deprotonated TNA HOMO → LUMO 400-565 / 500 527 0.5988a 2.35
HOMO → LUMO + 1 514 0.0666 2.41
HOMO → LUMO + 3 480 0.0522 2.58
HOMO → LUMO + 2 441 0.0116 2.81
aTransition with high oscillator strength. MO
The simulated spectrum of the optimized molecule I, represented by the black line, showed no spectral band in visible region and only one electronic transition was identified at 431 nm with very weak oscillator strength (0.0481). In contrast, the spectrum of the optimized molecule II, represented by the red line, presented a broadband from 338 to 460 nm with a transition between HOMO-LUMO molecular orbitals at 405 nm, presenting high oscillator strength (0.1205, see Table 2). Evaluating the visible region it is possible to note that the blue line is slightly higher than the red one, which indicates that there is a possibility of the protonation in amino group happening.
The theoretical studies in methanol showed similar results to the ones in ethanol and the data can be found in the Supplementary Information.
Conclusions
In summary, we describe the synthesis of a novel 9-aminoacridine derivative that presents different colors when exposed to acidic medium (pH < 4, yellow), neutral medium (pH ca. 7, orange) and basic medium (pH > 10, red). The TNA compound presents a variation in its coloration due to changes in the hydrogenionic concentration, which produces an alteration in the chemical structure of the molecule. Further studies were performed by means of potentiometric titration, molar absorptivity determination and theoretical studies supported by DFT calculations. This class of compounds (9-AA derivatives) could contribute to the development of a novel pH indicator in organic solvents. Additional studies will be conducted in order to evaluate
the performance of the novel compound as a pH indicator for titrations in organic mediums.
Supplementary Information
Supplementary data (NMR, infrared and UV-Vis spectra, linear regression curves, theoretical calculations and solubility tests) are available free of charge at http://jbcs.sbq.org.br as PDF file.
Acknowledgments
The authors wish to thank CNPq, CAPES and FAPEMIG for financial support, as well as the Núcleo de Estudos em Química Computacional (UFJF) for computational facilities and the Physics Department (UFJF) for the MALDI-MS analysis.
References
1. Nishikiori, H.; Tanaka, N.; Minami, Y.; Katsuki, A.; Fujii, T.; J. Photochem. Photobiol., A 2010, 212, 62.
2. Jesionowski, T.; Przybylska, A.; Kurc, B.; Ciesielczyk, F.; Dyes Pigm. 2011, 88, 116.
3. Wainwright, M.; Dyes Pigm. 2008, 76, 582.
4. Sebestik, J.; Hlavacek, J.; Stibor, I.; Curr. Protein Pept. Sci. 2007, 8, 471.
5. Narayanan, R.; Tiwari, P.; Inoa, D.; Ashok, B. T.; Life Sci. 2005, 77, 2312.
6. Malachowska-Ugarte, M.; Cholewinski, G.; Dzierzbicka, K.; Trzonkowski, P.; Eur. J. Med. Chem. 2012, 54, 197.
7. Casadio, R.; Melandri, B.; J. Bioenerg. Biomembr. 1977, 9, 17. 8. Vermillion-Salsbury, R. L.; Hercules, D. M.; Rapid Commun.
Mass Spectrom. 2002, 16, 1575.
9. Soltzberg, L. J.; Hagar, A.; Kridaratikorn, S.; Mattson, A.; Newman, R.; J. Am. Soc. Mass. Spectrom. 2007, 18, 2001. 10. Brown, J. D.; Bell, N.; Li, V.; Cantrell, K.; Anal. Biochem. 2014,
462, 29.
11. Zhang, Z.; Achilefu, S.; Chem. Commun. 2005, 47, 5887. 12. Son, Y.-A.; Kim, S.-H.; Dyes Pigm. 2005, 64, 153.
13. Babić, S.; Horvat, A. J. M.; Mutavdžić Pavlović, D.; Kaštelan-Macan, M.; TrAC, Trends Anal. Chem. 2007, 26, 1043. 14. Völgyi, G.; Ruiz, R.; Box, K.; Comer, J.; Bosch, E.;
Takács-Novák, K.; Anal. Chim. Acta 2007, 583, 418.
15. Martínez, V.; Maguregui, M. I.; Jiménez, R. M.; Alonso, R. M.; J. Pharm. Biomed. Anal. 2000, 23, 459.
16. Blanco, S. E.; Almandoz, M. C.; Ferretti, F. H.; Spectrochim. Acta, Part A 2005, 61, 93.
17. Christensen, J. J.; Ruckman, J.; Eatough, D. J.; Izatt, R. M.; Thermochim. Acta 1972, 3, 203.
18. Kimberly, M. M.; Goldstein, J. H.; Anal. Chem. 1981, 53, 789. 19. Cleveland, J. A.; Benko, M. H.; Gluck, S. J.; Walbroehl, Y. M.;
J. Chromatogr. A 1993, 652, 301.
20. Stroppa, P. H. F.; Martins, J. S.; Quirino, W. G.; Silva, A. D.; INPI, BR 10 2016 026223-22016.
21. Frisch, M. J.; Trucks, G. W.; Schlegel, H. B.; Scuseria, G. E.; Robb, M. A.; Cheeseman, J. R.; Scalmani, G.; Barone, V.; Mennucci, B.; Petersson, G. A.; Nakatsuji, H.; Caricato, M.; Li, X.; Hratchian, H. P.; Izmaylov, A. F.; Bloino, J.; Zheng, G.; Sonnenberg, J. L.; Hada, M.; Ehara, M.; Toyota, K.; Fukuda, R.; Hasegawa, J.; Ishida, M.; Nakajima, T.; Honda, Y.; Kitao,
O.; Nakai, H.; Vreven, T.; Montgomery, J. A.; Peralta Jr., J. E.; Ogliaro, F.; Bearpark, M.; Heyd, J. J.; Brothers, E.; Kudin, K. N.; Staroverov, V. N.; Kobayashi, R.; Normand, J.; Raghavachari, K.; Rendell, A.; Burant, J. C.; Iyengar, S. S.; Tomasi, J.; Cossi, M.; Rega, N.; Millam, J. M.; Klene, M.; Knox, J. E.; Cross, J. B.; Bakken, V.; Adamo, C.; Jaramillo, J.; Gomperts, R.; Stratmann, R. E.; Yazyev, O.; Austin, A. J.; Cammi, R.; Pomelli, C.; Ochterski, J. W.; Martin, R. L.; Morokuma, K.; Zakrzewski, V. G.; Voth, G. A.; Salvador, P.; Dannenberg, J. J.; Dapprich, S.; Daniels, A. D.; Farkas, Ö.; Foresman, J. B.; Ortiz, J. V.; Cioslowski, J.; Fox, D. J.; Gaussian 09, Revision A.01; Gaussian, Inc.: Wallingford CT, United States, 2009. 22. Lee, C.; Yang, W.; Parr, R. G.; Phys. Rev. B 1988, 37, 785. 23. Cammi, R.; Tomasi, J.; J. Comput. Chem. 1995, 16, 1449. 24. Skoog, D. A.; West, D. M.; Holler, F. J.; Fundamentos de
Química Analítica, vol. 2; Reverté: Barcelona, Spain, 1997. 25. Harvey, D.; Modern Analytical Chemistry, vol. 1; McGraw-Hill:
New York, United States, 2000.
26. Blanco, S. E.; Ferretti, F. H.; Talanta 1998, 45, 1103. 27. Artyukhov, V. Y.; Kopylova, T.; Samsonova, L.; Selivanov, N.;
Plotnikov, V.; Sazhnikov, V.; Khlebunov, A.; Mayer, G.; Alfimov, M.; Russ. Phys. J. 2008, 51, 1097.
28. Pinho, S. P.; Macedo, E. A.; J. Chem. Eng. Data 2005, 50, 29. 29. Pinho, S. P.; Macedo, E. A.; Fluid Phase Equilib. 1996, 116,
209.
30. El-Shishtawy, R.; Elroby, S.; Asiri, A.; Müllen, K.; Int. J. Mol. Sci.2016, 17, 487.
Submitted: March 24, 2017