Genetic parameters for milk, fat and protein yields in Murrah buffaloes
(
Bubalus bubalis
Artiodactyla, Bovidae)
Rusbel Raúl Aspilcueta-Borquis
1, Roberta Cristina Sesana
1, Milthon Honorio Munoz Berrocal
2,
Leonardo de Oliveira Seno
1, Annaiza Braga Bignardi
1, Lenira El Faro
3,
Lucia Galvão de Albuquerque
1, Gregório Miguel Ferreira de Camargo
1and Humberto Tonhati
11
Faculdade Ciências Agrárias e Veterinárias, Universidade Estadual Paulista ‘Júlio de Mesquita Filho’,
Jaboticabal, SP, Brazil.
2
Universidad Nacional Agraria de la Selva, Tingo Maria, Perú.
3
Agência Paulista de Tecnologia dos Agronegócios, Ribeirão Preto, SP, Brazil.
Abstract
The objective of the present study was to estimate genetic parameters for test-day milk, fat and protein yields and 305-day-yields in Murrah buffaloes. 4,757 complete lactations of Murrah buffaloes were analyzed. Co-variance com-ponents were estimated by the restricted maximum likelihood method. The models included additive direct genetic and permanent environmental effects as random effects, and the fixed effects of contemporary group, milking num-ber and age of the cow at calving as linear and quadratic covariables. Contemporary groups were defined by herd-year-month of test for test-day yields and by herd-year-season of calving for 305-day yields. The heritability es-timates obtained by two-trait analysis ranged from 0.15 to 0.24 for milk, 0.16 to 0.23 for protein and 0.13 to 0.22 for fat, yields. Genetic and phenotypic correlations were all positive. The observed population additive genetic variation indicated that selection might be an effective tool in changing population means in milk, fat and protein yields.
Key words:test-day model, accumulated productions, heritability, genetic correlations. Received: December 22, 2008; Accepted: October 7, 2009.
Milk, fat and protein yields are constantly monitored traits in herds integrating milk test programs. Test-day milk yield (TDM), defined as the total yield of a cow over a pe-riod of 24 h, replaces milk yield at 305 days of lactation (M305), as calculated by using formulas and extension fac-tors (Tonhatiet al.2004). In addition, the application of
TDM to the genetic evaluation of animals enables quantify-ing specific factors on each test-day that vary not only from animal to animal but also between the test-days themselves. It permits more reliable heritability estimates and a more accurate selection of the best individuals for future use in reproduction.
Several investigators have emphasized that environ-mental effects affecting certain test-days or lactation phases, such as management group, test-date, milking num-ber, the herd itself, shape of the lactation curve, number of lactation days, preferential treatment of certain groups of cows and the specific effects of each cow on the test-day, which so far have been ignored in traditional models, can be
adjusted by test-day models (Meyeret al., 1989; Ptak and
Schaeffer, 1993; Jamrozik and Schaeffer, 1997). Some of the advantages of test-day models (TDM) include the abil-ity to account for the environmental effects of each test-day, the ability to model the trajectory of the lactation for individual genotype or groups of animals, and the possibil-ity of genetic evaluation with a view to production persis-tency. (Jensen, 2001).
However, in order to choose which criteria should be adopted for genetic evaluation, accurate estimates of ge-netic variability and gege-netic correlation with P305 are im-portant. Studies of Holstein and Gyr cattle and Murrah buffaloes have shown that genetic correlations between TDM and P305 are higher during the mid-lactation period when compared to the beginning and end of lactation (Le-dicet al., 2002; Ferreiraet al., 2003 and Hurtado-Lugoet al., 2006).
There are little data on genetic parameters of milk yield and components during lactation in dairy buffaloes. Thus, the objective of the present study was to evaluate the possible application of TDM and its components in genetic evaluation of buffaloes, in the place of the traditional P305 model.
www.sbg.org.br
Send correspondence to Humberto Tonhati. Departamento de Zoo-tecnia, Faculdade de Ciencias Agrarias e Veterinarias, Univer-sidade Estadual Paulista `Júlio de Mesquita Filho’, Jaboticabal, Via de Aceso Prof. Paulo Donato Castellane s/n, 14884-900 Jabo-ticabal, SP, Brazil. E-mail: [email protected].
In the present study, 4,757 complete lactations of Murrah buffaloes, aged from 2 to 15 years, the daughters of 187 sires, and with calving records of the period 1985 to 2005, were analyzed. The animals belonged to 13 herds participating in the Buffalo Milk Test Program of the Ani-mal Science Department of FCAV/UNESP, Jaboticabal, SP, Brazil.
Lactation recording was begun from the fifth day of lactation and truncated at the 305th. The first test was
car-ried out up to 45 days after calving. Contemporary groups were defined according to herd-year-month of test, and consisted of 168 classes, with each group comprising at least four animals. A pedigree file containing 11,760 ani-mals was used for all analyses.
(Co)variance components were estimated for milk, fat and protein yields, by finite dimensional test-day models dividing the lactation period into 9 time points (9 test days) as distinct traits, and using single- and two-trait analyses. (Co)variance components were estimated by the restricted maximum likelihood (REML) method using the MTDFREML statistical package (Boldmanet al., 1995).
The animal model can be represented as:
y=Xß +Za+Wp+e,
where:yis the vector of observations (milk, fat and protein
yield), andX,ZandWare incidence matrices relating y to
ß,aandp, the vectors of fixed effects (contemporary group
and the cow’s age as linear and quadratic effects) and addi-tive genetic and permanent environmental random effects, respectively, and e is the vector of residual effects. This model comprises the following assumptions:
E a p e i i i é ë ê ê ê ù û ú ú ú =0; V a a p p e e A A A
a a a
a 1 2 1 2 1 2 2
1 1 2 0 0 0 0
é ë ê ê ê ê ê ê ê ù û ú ú ú ú ú ú ú = s s s
2 1 2 1
1 1 2
2 1 2
2
2
2
0 0 0 0
0 0 0 0
0 0 0 0
0 0 0 0
a a a
p p p
p p p
A I I I I I s s s s s
se e e
e e e
I
I I
1 1 2
2 1 2
2
2
0 0 0 0
s s s é ë ê ê ê ê ê ê ê ù û ú ú ú ú ú ú ú
whereAis the relationship matrix,Iis an identity matrix,
sa i
2 ,s
pi
2 ands
ei
2 are additive genetic, permanent
environ-mental and residual variances for traiti(i= 1, 2),
respec-tively, andsa a
1 2,sp p1 2 andse e1 2 are additive genetic, per-manent environmental and residual covariances between traits 1 and 2, respectively.
Expected genetic gain and correlated response to se-lection were obtained using estimates of heritability (h2),
genetic correlations and phenotypic standard deviations. Selection of the best 5% males was examined, correspond-ing to a selection intensity factor of 2.06 (Lush, 1964). Fe-males were randomly replaced in the herd, with selection intensity equal to zero. Thus, the mean selection intensity factor for all traits was 1.03. Expected direct and correlated responses to selection and the relative response efficiency were calculated by the usual selection index formulas, con-sidering a progeny test with number of daughters per sire varying from 5 to 100.
Test-day milk-yield means revealed a typical lacta-tion curve for Murrah buffaloes, starting with 8.12 kg and followed by a short increase until reaching the peak on the second test-day (8.61 kg), with a subsequent decrease until the end of lactation (Table 1). The P305 mean observed in
Table 1- Number of observations (N), observed means (kg), standard deviation (SD, kg) and coefficients of variation (CV) for monthly test-day milk, fat and protein yields (TDM1 to TDM9) and cumulative 305-day milk, fat and protein yields (P305) in Murrah buffaloes.
Yield
Milk Fat Protein
Trait N Mean±SD CV% N Mean±SD CV% N Mean±SD CV%
TDM1 6153 8.12±3.14 36.49 825 0.44±0.16 36.49 821 0.32±0.11 33.90
TDM2 6175 8.61±3.17 34.95 936 0.47±0.16 33.23 936 0.32±0.10 31.27
TDM3 6032 8.30±3.10 35.49 885 0.46±0.15 33.34 885 0.30±0.10 32.94
TDM4 5862 7.74±2.92 35.88 888 0.46±0.17 36.10 887 0.29±0.10 36.54
TDM5 5580 7.17±2.72 36.65 885 0.44±0.15 34.04 885 0.27±0.10 36.61
TDM6 5211 6.56±2.55 37.50 784 0.42±0.16 36.32 784 0.25±0.11 43.91
TDM7 4816 5.94±2.30 37.91 710 0.39±0.14 36.62 709 0.23±0.09 39.91
TDM8 4075 5.43±2.17 39.25 593 0.40±0.15 37.76 593 0.23±0.09 40.12
TDM9 3710 4.76±1.96 39.83 502 0.39±0.15 37.95 502 0.22±0.09 40.87
this study (1,813.5±697.40 kg) was higher than that ob-tained by Tonhatiet al.(2000a, b) and Ramoset al.(2006) of 1,259.47 kg, 1,496.00 kg and 1,650± 687 kg, respec-tively. However, ours is similar to those reported by Ma-lhadoet al.(2007), 1,863.5±677 kg, for this breed in Brazil
and Shabadeet al. (1993) for Murrah buffaloes in India
(1,892.21 kg).
In fat and protein yield curves, the trend was similar to that observed for monthly milk yields, with higher means in early lactation, thereby suggesting a positive association between milk and its constituents. These trends are similar to those reported in the literature (Swalve, 1995) for milk, fat and protein yields in Holstein cows. Cumulative
305-day fat and protein yields were lower than those re-ported by Rosati and Van Vleck (2002), 196.9±45.6 kg and 104.7±21.7 kg, respectively, for Mediterranean buffa-loes in Italy.
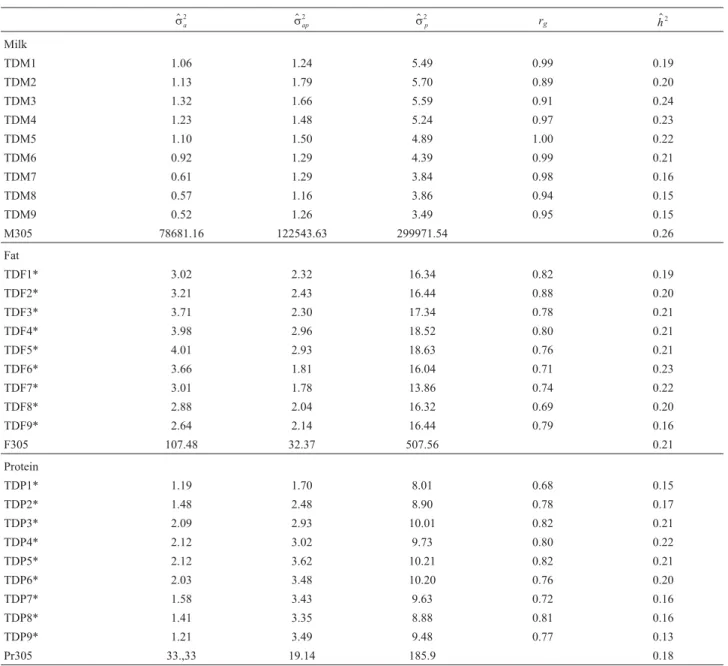
Additive genetic, permanent environmental and phenotypic variances estimates for test-day milk (TDM), fat (TDF) and protein yield (TDP) and cumulative 305-day milk (M305), fat (F305) and protein yields (PR305) ob-tained by two-trait analysis are shown in Table 2. Genetic variance estimates for TDM increased from the first (1.06 kg2) to the third (1.32 kg2) month, declining thereon
until the end of lactation (0.52 kg2). The highest estimates
were obtained for the third and fourth months of lactation.
Table 2- Estimates of additive genetic (s$a2), permanent environmental (s$
ap
2) and (s$
p
2) phenotypic variance (kg2), estimates of heritability (h$2), and genetic
correlations (rg), for milk, fat and protein yields obtained by two-trait analysis.
$
sa2 s$
ap
2 s$
p
2
rg h$2
Milk
TDM1 1.06 1.24 5.49 0.99 0.19
TDM2 1.13 1.79 5.70 0.89 0.20
TDM3 1.32 1.66 5.59 0.91 0.24
TDM4 1.23 1.48 5.24 0.97 0.23
TDM5 1.10 1.50 4.89 1.00 0.22
TDM6 0.92 1.29 4.39 0.99 0.21
TDM7 0.61 1.29 3.84 0.98 0.16
TDM8 0.57 1.16 3.86 0.94 0.15
TDM9 0.52 1.26 3.49 0.95 0.15
M305 78681.16 122543.63 299971.54 0.26
Fat
TDF1* 3.02 2.32 16.34 0.82 0.19
TDF2* 3.21 2.43 16.44 0.88 0.20
TDF3* 3.71 2.30 17.34 0.78 0.21
TDF4* 3.98 2.96 18.52 0.80 0.21
TDF5* 4.01 2.93 18.63 0.76 0.21
TDF6* 3.66 1.81 16.04 0.71 0.23
TDF7* 3.01 1.78 13.86 0.74 0.22
TDF8* 2.88 2.04 16.32 0.69 0.20
TDF9* 2.64 2.14 16.44 0.79 0.16
F305 107.48 32.37 507.56 0.21
Protein
TDP1* 1.19 1.70 8.01 0.68 0.15
TDP2* 1.48 2.48 8.90 0.78 0.17
TDP3* 2.09 2.93 10.01 0.82 0.21
TDP4* 2.12 3.02 9.73 0.80 0.22
TDP5* 2.12 3.62 10.21 0.82 0.21
TDP6* 2.03 3.48 10.20 0.76 0.20
TDP7* 1.58 3.43 9.63 0.72 0.16
TDP8* 1.41 3.35 8.88 0.81 0.16
TDP9* 1.21 3.49 9.48 0.77 0.13
Pr305 33.,33 19.14 185.9 0.18
These results are similar to those reported for buffaloes by Hurtado-Lugoet al.(2006), who observed higher genetic
additive variance around the fifth month. In general, higher genetic variance has been estimated around the fourth or fifth months of lactation for dairy cattle in Brazil (Ferreira
et al., 2003; Rodrigueset al., 2005). Permanent
environ-mental variance was higher around the first half of lacta-tion. Phenotypic variance estimates showed the same trend
of the additive genetic, increasing from the first to the third month of lactation with a posterior decrease (Table 3). The highest estimates of residual variance for milk were ob-served in the third and fourth months of lactation.
TDM heritability was higher in the third and fourth months of lactation due to higher genetic and lower residual variance (Table 2). Similar results have been reported by Jamrozik and Schaeffer (1997), Lidauer and Mäntysaari
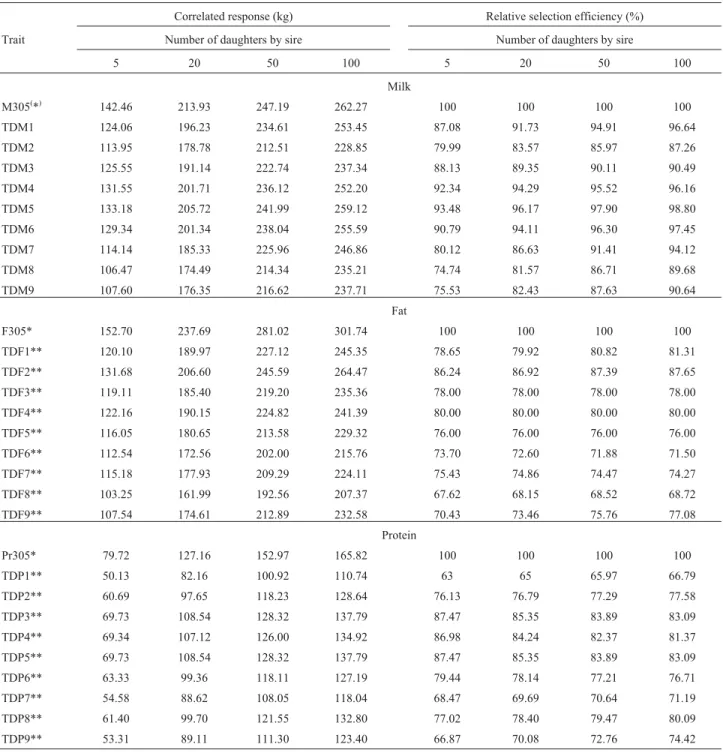
Table 3- Expected direct response to selection for 305-days milk (M305), fat (F305) and protein (Pr305) yields, and respective correlated responses and
relative selection efficiency selecting for test-day yields (milk, fat and protein).
Correlated response (kg) Relative selection efficiency (%)
Trait Number of daughters by sire Number of daughters by sire
5 20 50 100 5 20 50 100
Milk
M305(*) 142.46 213.93 247.19 262.27 100 100 100 100
TDM1 124.06 196.23 234.61 253.45 87.08 91.73 94.91 96.64
TDM2 113.95 178.78 212.51 228.85 79.99 83.57 85.97 87.26
TDM3 125.55 191.14 222.74 237.34 88.13 89.35 90.11 90.49
TDM4 131.55 201.71 236.12 252.20 92.34 94.29 95.52 96.16
TDM5 133.18 205.72 241.99 259.12 93.48 96.17 97.90 98.80
TDM6 129.34 201.34 238.04 255.59 90.79 94.11 96.30 97.45
TDM7 114.14 185.33 225.96 246.86 80.12 86.63 91.41 94.12
TDM8 106.47 174.49 214.34 235.21 74.74 81.57 86.71 89.68
TDM9 107.60 176.35 216.62 237.71 75.53 82.43 87.63 90.64
Fat
F305* 152.70 237.69 281.02 301.74 100 100 100 100
TDF1** 120.10 189.97 227.12 245.35 78.65 79.92 80.82 81.31
TDF2** 131.68 206.60 245.59 264.47 86.24 86.92 87.39 87.65
TDF3** 119.11 185.40 219.20 235.36 78.00 78.00 78.00 78.00
TDF4** 122.16 190.15 224.82 241.39 80.00 80.00 80.00 80.00
TDF5** 116.05 180.65 213.58 229.32 76.00 76.00 76.00 76.00
TDF6** 112.54 172.56 202.00 215.76 73.70 72.60 71.88 71.50
TDF7** 115.18 177.93 209.29 224.11 75.43 74.86 74.47 74.27
TDF8** 103.25 161.99 192.56 207.37 67.62 68.15 68.52 68.72
TDF9** 107.54 174.61 212.89 232.58 70.43 73.46 75.76 77.08
Protein
Pr305* 79.72 127.16 152.97 165.82 100 100 100 100
TDP1** 50.13 82.16 100.92 110.74 63 65 65.97 66.79
TDP2** 60.69 97.65 118.23 128.64 76.13 76.79 77.29 77.58
TDP3** 69.73 108.54 128.32 137.79 87.47 85.35 83.89 83.09
TDP4** 69.34 107.12 126.00 134.92 86.98 84.24 82.37 81.37
TDP5** 69.73 108.54 128.32 137.79 87.47 85.35 83.89 83.09
TDP6** 63.33 99.36 118.11 127.19 79.44 78.14 77.21 76.71
TDP7** 54.58 88.62 108.05 118.04 68.47 69.69 70.64 71.19
TDP8** 61.40 99.70 121.55 132.80 77.02 78.40 79.47 80.09
TDP9** 53.31 89.11 111.30 123.40 66.87 70.08 72.76 74.42
*Expected direct genetic gain.
(1999) and Silvestreet al.(2005) in dairy cattle. These
au-thors also suggested that selection for milk yield should be at the fourth or fifth month of lactation. Selection could be anticipated by promoting a reduction in the generation in-terval. In the present study, heritability for milk yield (0.12 to 0.24) was higher than that reported by Hurtado-Lugoet al.(2006) for Murrah buffaloes in Colombia (0.01 to 0.20).
For test-day fat yields (TDF), genetic variance in-creased from the first (3.02 x 10⁻³kg2) to the fifth month
(4.01 x 10⁻³kg2), and then declined until the end of lactation
(2.64 x 10⁻³kg2). For dairy cattle, Swalve (1995) reported
higher genetic variance at the beginning of lactation, with a subsequent oscillation throughout lactation. For permanent environmental variance (Table 2), there was an increase from the start to the fifth month of lactation, declining thereafter until the seventh month, thereupon increasing again during the last two months.
The estimated heritabilities (Table 2) for fat yields were moderate, the highest estimates being obtained for the sixth month of lactation (0.23). Studies with dairy cattle re-ported the same trend (Gengleret al., 1997; Lidauer and Mäntysaari, 1999)
For test-day protein yields (TDP), genetic variance, as a whole, increased from the beginning (1.19 x 10⁻³kg2)
to the fourth and fifth months (2.12 x 10⁻³kg2), thereupon
decreasing until the end of lactation (1.21 x 10⁻³ kg2). A
similar trend was reported by Swalve (1995). On the other hand, Silvestreet al.(2005) observed higher variances at
the beginning of lactation, with a decrease till the fourth month and an increase thereafter. In the present study, the highest estimates of heritability were obtained in the fourth month of lactation (0.22), similar to that reported by Swalve (1995) and Lidauer and Mäntysaari (1999). How-ever, Gengleret al.(1997) and Silvestreet al.(2005) found
higher heritabilities for protein production in the ninth and seventh months of lactation, respectively.
The estimatives of selection efficiency and the direct response for accumulated yields (M305, F305 e Pr305), as well as the correlated response between accumulated and test-day yield (TDM, TDF e TDP), are presented in Table 3. It is possible to see that the direct responses to accumulated yields are higher than all the correlated answers in the three traits analyzed, thereby indicating that the use of accumu-lated responses as selection criteria could be a more effi-cient form of obtaining genetic gain.
The highest values for correlated response were ob-served among the yields in the second and sixth months of control for the traits analyzed. It is probable that these val-ues were the outcome of the simultaneously high degree of heritability, as well as the high genetic correlation with the accumulated yields. The correlated response, according to the number of daughters per sire, can also be seen. As could be summarized, the greater the number of daughters per sire, the higher the estimate for correlated response. How-ever, it is interesting to conceive that in present day dairy
bubaline breeding, and with the small numbers of herds which compose the milk control program, a sire could take so long in generating 100 lactating daughters.
To appropriately use these studied traits, it is neces-sary to elaborate selection criteria based on an economic in-dex evaluating the profitability of each trait for the breeder, and also indicate how selection must be done according to both the market and production.
The relative efficiency of selection for TDMs is greater at TDM5 and TDM6, which are the closest to M305. These results are similar to those described by Hur-tado-Lugoet al.(2006) for Murrah buffaloes and Ferreiraet al.(2003) for Holstein cows. However, in Gyr cattle, Ledic et al., (2002), reported higher relative selection efficiency
for TDM2, TDM3 and TDM4.
The highest correlated responses for 305-day fat yield, when using TDF yields as selection criteria, were ob-tained when TDF2 was adopted. In contrast, for 305-day protein yields, the highest correlated responses were ob-served on using TDP3, TDP4 and TDP5. Taken as a whole, the correlated genetic gain was higher for milk than for fat and protein yields.
Estimates of genetic correlation (Table 4) for TDM ranged from 0.54 to 1.00, with 64% of the correlations higher than 0.90, mainly between adjacent records. Melo (2005) reported estimates ranging from 0.64 to 1.00 in dairy cattle.
Lower genetic correlations were observed between TDM1 and the last two test-days, probably due to the low lactation persistency in buffaloes. All phenotypic correla-tions were positive, these ranging from 0.21 (between TDM1 and TDM9) to 0.69 (between TDM4 and TDM5). Phenotypic correlations gradually decreased with the in-creasing distance between test-days, reaching 89% lower than 0.60.
Estimates of genetic correlation ranged from 0.46 to 0.99 for TDF and from 0.47 to 0.94 for TDP. Most of the es-timates were high, almost reaching one. In addition, higher estimates were obtained when test-day yields were closer together. Lower genetic correlations were observed be-tween test-day yields during the first half of lactation and the production of the ninth test-day. A possible explanation could be that lactation in buffaloes tends to be of shorter du-ration and less persistent than in dairy cattle. Gengleret al.
(1997) and Silvestreet al.(2005), on estimating genetic
pa-rameters in dairy cows, also observed high genetic correla-tions between adjacent test-days and low correlacorrela-tions between those distant.
The phenotypic correlations for TDF were positive and ranged from 0.36 (between TDF1 and TDF9) to 0.76 (between TDF1 and TDF2), and for TDP the range was from 0.35 to 0.71. Similar results were reported by Gengler
et al.(1997) and Silvestreet al.(2005) for dairy cattle.
corre-lations were observed between milk and fat yields and be-tween fat and protein yields when compared to that between milk and protein yields. Overall, all the estimates were positive, thereby inferring desirable association be-tween milk and its constituents. Similar results were ob-tained for phenotypic correlations.
In conclusion, the higher estimates for genetic vari-ance in the first four test-days suggested that these test-day yields could be used as a selection criterion, reducing the generation interval. A greater response to selection for cu-mulative 305-day milk, fat and protein yields might be ob-tained by direct selection for these traits. The use of milk, fat and protein yields on any test-day as selection criteria will result in a correlated response for all other test days, as well as for 305-day yields. A higher correlated response for
305-day yields might be obtained when using mid-lactation (3rd to 6th test day) records as selection criteria.
Acknowledgments
The authors wish to thank the buffalo breeders of the milk-test program who provided the data for study, as well as the Conselho Nacional de Desenvolvimento Científico e Tecnológico (CNPq) and to the Fundação de Apoio à Pes-quisa do Estado de São Paulo (FAPESP) for financial sup-port.
References
Boldman KG, Kriese LA, Van Vleck LD and Kachman SD (1995) A Manual for use MTDFREML. Department of Agricul-ture/Agricultural Research Service, Lincoln, 120 pp. Ferreira WJ, Teixeira NM, Euclydes RF, Verneque RS, Lópes
OS, Torres RA, Wenceslau AA, Da Silva MV and Magalhães MN (2003) Avaliação genética de bovinos da raça holandesa usando a produção de leite no do controle. Rev Bras Zootec 32:295-303 (Abstract in English). Gengler N, Tijani A, Wiggans GR and Philpot JC (1997)
Estima-tion of (co)variance components of test day yields for U.S. Holsteins. In: Proceeding InterbullMeeting, August 28-29. Viena, Austria, Bulletin n 16, pp 53-59.
Jamrozik J and Schaeffer LR (1997) Estimates of genetic parame-ters for a test-day model with random regressions for yield traits of first lactation Holsteins. J Dairy Sci 80:762-770. Jensen J (2001) Genetic evaluation of dairy cattle using test-day
model. J Dairy Sci 84:2803-2812.
Ledic IL, Tonhati H, Verneque RS, El Faro L, Martinez ML, Costa CL, Pereira CJ, Fernandes OL and Albuquerque GL (2002) Estimativas de parâmetros genéticos. fenotípicos e ambientes para as produções de leite no dia do controle e em 305 dias de lactação de vacas da raça Gir. Rev Bras Zootec 31:1953-1963 (Abstract in English).
Lidauer M and Mäntysaari EA (1999) Multiple trait reduced rank random regression test-day model for production traits. In: Proceeding Interbull Meeting, August 26-27. Zurich, Swit-zerland, Bulletin n 22, pp 74-80.
Lush JL (1964) Como a seleção muda uma população - Expressão dos resultados. In: Sedegra Sociedade Editora e Gráfica Ltda (ed) Melhoramento Genético dos Animais Domésticos. USAID, Rio de Janeiro, pp 186-217.
Malhado CH, Ramos A, Carneiro P, Souza J and Piccinin A (2007) Parâmetros e tendências da produção de leite em bubalinos da raça Murrah no Brasil. Rev Bras Zootec 37:376-379 (Abstract in English).
Melo CMR (2005) Parâmetros genéticos para as produções de leite no dia do controle e da primeira lactação de vacas da raça Holandesa. Rev Bras Zootec 34:796-806 (Abstract in English).
Meyer K, Graser H and Hammond K (1989) Estimates of genetic parameters for first lactation test day production of Austra-lian black and white cows. Livestock Prod Sci 21:177-199. Ptak E and Schaeffer LR (1993) Use of test day yields for genetic
evaluation of dairy sires and cows. Livestock Prod Sci 34:23-34.
Ramos AA, Malhado CHM, Carneiro PLS, Gonçalves HC and Azevedo DMM (2006) Caracterização fenotípica e genética Table 4- Heritability (diagonal), genetic correlations (above the diagonal)
and phenotypic correlations (below the diagonal) estimated by two-trait-analysis for milk, fat and protein test-day yields.
Milk
1 2 3 4 5 6 7 8 9
1 0.18 0.96 0.97 0.91 0.86 0.78 0.79 0.66 0.54
2 0.55 0.20 0.98 0.93 0.87 0.89 0.82 0.60 0.84
3 0.51 0.64 0.24 0.94 0.95 0.94 0.90 0.69 0.89
4 0.48 0.59 0.66 0.23 0.91 0.98 0.97 0.85 0.90
Milk 5 0.42 0.53 0.58 0.69 0.22 0.98 0.94 0.95 0.94
6 0.36 0.46 0.51 0.52 0.64 0.19 0.99 0.96 0.94
7 0.26 0.39 0.46 0.48 0.52 0.56 0.15 0.99 1.00
8 0.25 0.30 0.36 0.39 0.43 0.44 0.52 0.13 0.98
9 0.21 0.27 0.29 0.31 0.33 0.34 0.40 0.46 0.13
Fat
1 0.18 0.96 0.86 0.75 0.68 0.55 0.48 0.49 0.46
2 0.76 0.19 0.95 0.86 0.76 0.69 0.63 0.56 0.54
3 0.71 0.71 0.21 0.96 0.89 0.80 0.74 0.67 0.54
4 0.63 0.65 0.68 0.21 0.97 0.89 0.83 0.76 0.65
Fat 5 0.48 0.59 0.62 0.68 0.21 0.96 0.91 0.87 0.81
6 0.52 0.54 0.55 0.61 0.67 0.23 0.99 0.90 0.83
7 0.57 0.48 0.51 0.56 0.62 0.64 0.22 0.96 0.89
8 0.43 0.46 0.48 0.50 0.54 0.59 0.68 0.18 0.93
9 0.36 0.41 0.43 0.46 0.49 0.57 0.61 0.67 0.15
Protein
1 0.16 0.93 0.86 0.78 0.71 0.68 0.59 0.52 0.47
2 0.71 0.18 0.94 0.86 0.82 0.74 0.67 0.59 0.53
3 0.67 0.69 0.21 0.92 0.85 0.79 0.71 0.65 0.58
4 0.62 0.64 0.68 0.22 0.90 0.86 0.78 0.70 0.64
Protein 5 0.59 0.60 0.62 0.69 0.21 0.92 0.85 0.80 0.72
6 0.51 0.55 0.57 0.63 0.67 0.20 0.91 0.82 0.79
7 0.46 0.49 0.51 0.56 0.61 0.66 0.15 0.91 0.84
8 0.40 0.43 0.44 0.51 0.56 0.59 0.67 0.15 0.92
da produção de leite e do intervalo entre partos em bubalinos da Raça Murrah. Pesq Agropec Bras 41:1261-1267 (Ab-stract in English).
Rodrigues CLM, Packer IU, Costa CN and Machado PF (2005) Parâmetros genéticos para as produções de leite no dia do controle e da primeira lactação de vacas da raça Holandesa. Rev Bras Zootec 34:796-806 (Abstract in English). Rosati A and Van Vleck LD (2002) Estimation of genetic
parame-ters for milk. fat. protein and mozzarella cheese production in Italian river buffalo population. Livestock Prod Sci 74:185-190.
Shabade NS, Jagtap DZ and Belhe ND (1993) Factors affecting production and production efficiency traits of first lactation in Murrah buffaloes. Indian J Anim Sci 63:1212-1213. Silvestre AM, Petin-Batista F and Colaço J (2005) Genetic
param-eter estimates of Portuguese dairy cows for milk. fat and pro-tein using a spline test-day model. J Dairy Sci 88:1225-1230.
Swalve HH (1995) The effect of test day models on the estimation of genetic parameters and breeding values for dairy yield traits. J Dairy Sci 78:929-938.
Tonhati H, Muñoz MFC, Oliveira JÁ, Duarte JMC, Furtado TP and Tseimazides SP (2000a) Parâmetros genéticos para a
produção de leite. Gordura e proteína em bubalinos. Rev Bras Zootec 29:2051-2056 (Abstract in English).
Tonhati H, Vasconcellos FB and Albuquerque LG (2000b) Ge-netic aspects of productive and reproductive traits in a Mur-rah buffalo herd in São Paulo, Brazil. J Anim Breed Genet 117:331-336.
Tonhati H, Muñoz MFC, Duarte JMC, Reichert RH, Oliveira JÁ and Lima ALF (2004) Estimates of correction factors for lactation length and genetic parameters for milk yield in buf-faloes. Arq Bras Med Vet Zootec 56:251-257.
Internet Resource
Hurtado-Lugo N, Cerón-Muñoz M and Gutiérrez-Valencia A (2006) Estimación de parámetros genéticos para la produc-ción de leche en el día de control en búfalos de la Costa Atlántica Colombia. Livestock Research for Rural
Develop-ment 18(3) (Abstract in English).
www.cipav.org.co/lrrd/lrrd18/3/hurt18039.htm.
Associate Editor: Pedro Franklin Barbosa