Received September 10, 2009 and accepted April 22, 2010. Corresponding author: jaime.cobuci@ufrgs.br
Genetic parameters for production traits in primiparous Holstein cows
estimated by random regression models
Igor de Oliveira Biassus1, Jaime Araújo Cobuci1, Claudio Napolis Costa2, Paulo Roberto Nogara Rorato3, José Braccini Neto1, Leandro Lunardini Cardoso1
1UFRGS, Porto Alegre, RS.
2Embrapa Gado de leite, Juiz de Fora, MG. 3UFSM, Santa Maria, RS.
ABSTRACT - The objective of this study was to estimate genetic parameters for milk, fat and protein yields of Holstein cows using 56,508; 35,091 and 8,326 test-day milk records from 7,015, 4,476 and 1,114 cows, calves of 359, 246 and 90 bulls, respectively. The additive genetic and permanent environmental effects were estimated using REML. Random regression models with Legendre polynomials from order 3 to 6 were used. Residual variances were considered homogeneous over the lactation period. The estimates of variance components showed similar trends, with an increase of the polynomial order for each trait. The heritability estimates ranged from 0.14 to 0.31; 0.03 to 0.21 and 0.09 to 0.33 for milk, fat and protein yield, respectively. Genetic correlations among milk, fat and protein yields ranged from 0.02 to 1.00; 0.34 to 1.00 and 0.42 to 1.00, respectively. Models with higher order Legendre polynomials are the best suited to adjust test-day data for the three production traits studied.
Key Words: fat yield, herdability, milk yield, protein yield, test-day
Parâmetros genéticos para características produtivas de vacas primíparas
da raça Holandesa estimados por modelos de regressão aleatória
RESUMO - Esta pesquisa foi realizada com o objetivo de estimar parâmetros genéticos para as produções de leite, gordura e proteína do leite de vacas da raça Holandesa usando, respectivamente, 56.508, 35.091 e 8.326 registros leiteiros no dia do controle de 7.015, 4.476 e 1.114 vacas, filhas de 359, 246 e 90 touros. Os efeitos genético aditivo e de ambiente permanente foram estimados por REML. Utilizaram-se modelos de regressão aleatória com polinômios de Legendre de ordem 3 a 6. As variâncias residuais foram consideradas homogêneas ao longo da lactação. As estimativas dos componentes de variância apresentaram tendências semelhantes com o aumento da ordem do polinômio em cada característica. As estimativas de herdabilidade variaram, respectivamente, de 0,14 a 0,31; 0,03 a 0,21; e 0,09 a 0,33 para as produções de leite, de gordura e de proteína. As correlações genéticas entre produções de leite, gordura e proteína do leite variaram de 0,02 a 1,00; 0,34 a 1,00 e 0,42 a 1,00, respectivamente. Os modelos com polinômio de Legendre de maior ordem são os mais adequados para ajuste da produção no dia do controle das três características produtivas.
Palavras-chave: dia do controle, herdabilidade, produção de gordura, produção de leite, produção de proteína www.sbz.org.br
Introduction
Recently, methods used for genetic evaluations of yield traits (milk, fat and protein) in dairy cattle, using accumulated production in 305 days, has been based on test-day yield. Random regression models have therefore been preferred over repeatability and multitrait models.
These models, when combined with production on the test-day, are used to consider environmental effects specific to each daily milk control (Jamrozik et al., 1997), providing greater accuracy in genetic evaluation of animals (Dionello et al., 2006), among other advantages. Thus, they
have been recognized as the most appropriate alternative for adjusting repeated records taken over the production life of the animals.
The use of such models requires the choice of a mathematical function - which can be orthogonal, parametric or of covariance - to describe the fixed and random effects. Among these functions, the Legendre orthogonal polynomials are the most suitable in procedures for estimating genetic parameters for yield traits in dairy cattle (Liu et al., 2006).
of random effects (genetic and non genetic) which act on milk yield (Costa et al., 2005; Cobuci et al., 2006; Araujo et al., 2006). However, for test day fat and protein yields, no study has been published.
The objective of this study was to estimate the covariance components and genetic parameters for test-day milk, fat and protein yields of primiparous Holstein cows, using random regression models by order 3 to 6 Legendre polynomials, to elect the most suitable models to use in genetic evaluations of these traits.
Material and Methods
The test-day production records were provided by the Serviço de Controle Leiteiro e Genealógico da Associação dos Criadores de Gado Holandês de Minas Gerais (ACGH-MG). The initial data file contained 827,266 yield records from the first to the eleventh lactation, collected from 1989 to 2008, distributed as follows: 823,221 records of milk yield of 51,702 cows, 648,433 records of fat yield of 50,949 cows and 353,470 records of protein yield of 35,381 cows.
Records of cows at less than 20 and more than 48 months of age at parturition were eliminated, as well as of those with daily milk, fat, or protein production lower than 10.6 kg, 295 g, and 306 g, and greater than 36.4 kg, 1,246 g, and 1,136 g, respectively. Records from Holstein cows with more than 6 records per lactation collected between day 6 and 305 after calving remained in the study. These cows were from sires with at least two daughters in at least three herds, from contemporary groups with more than 4 observations.
After editing, three new databases, corresponding to milk, fat and protein production records, were defined (Table 1). Peaks of milk, fat and protein yields occurred on about 60, 50 and 80 days in milk, respectively (Figure 1).
Four classes of cow age at calving (20 to 25, 26 to 27, 28 to 30, or 31 to 48 months) and four calving seasons (January to March, April to June, July to September, or October to December) were definied. These classes together
Base 1 (milk) Base 2 (fat) Base 3 (protein)
Number of records 56,508 3,091 8,326
Number of cows 7,015 4,476 1,114
Year of birth From 1993 to 2005 From 1993 to 2005 From 1996 to 2005
Year of calving From 1997 to 2007 From 1997 to 2007 From 1999 to 2007
Year of test From 1997 to 2008 From 1997 to 2008 From 1999 to 2008
Number of herds 2 1 1 1 5 4 5 1
Mean age of cow at calving (months) 27.98 28.2 27.8
Average daily yield 23.64 kg 754 g 725 g
Table 1 - Description of the database
yielded 16 classes of cow calving age-season, which were included in the random regression model as fixed effects. The contemporary groups were defined by grouping the variables herd, year, and month of milk record.
The random regression model used to fit yield records was:
,
in which: yijk = yield (milk, fat or protein) from cow k on any lactation day t within the classes i (herd-year-month of test) and j (calving age-season); HYMi = fixed effect herd-year-month of testing; βjm = vector of fixed regression coefficients of test-day yield that describes the regression fixed in calving age-season classes; akm and pkm= vectors of random regression coefficients that describe, respectively, additive genetic effects and permanent environmental effects on cow yield k; eijk = random residual effect associated with yijk; Zkm = covariate specific vector representing Legendre polynomial, in which m = the n-th parameter of Legendre polynomials of the 3rd, 4th, 5th or 6th orders.
The models were named M3, M4, M5 and M6 when Legendre polynomials of the 3rd, 4th, 5th, or 6th order were applied for modeling random production curves (genetic and permanent environment effects), as well as for modeling fixed production curves (average) of cows in different age classes-calving season.
The four models were compared according to the quality of fit of the production records of the three traits using the following criteria: the sum of the residual variance in lactation (SVR), value of -2log of maximum function likelihood (ML), Akaike information criterion (AIC) (Akaike, 1973), and the Bayesian information criterion (BIC) (Schwarz, 1978).
Figure 1 - Milk, fat and protein yields during lactation.
Results and Discussion
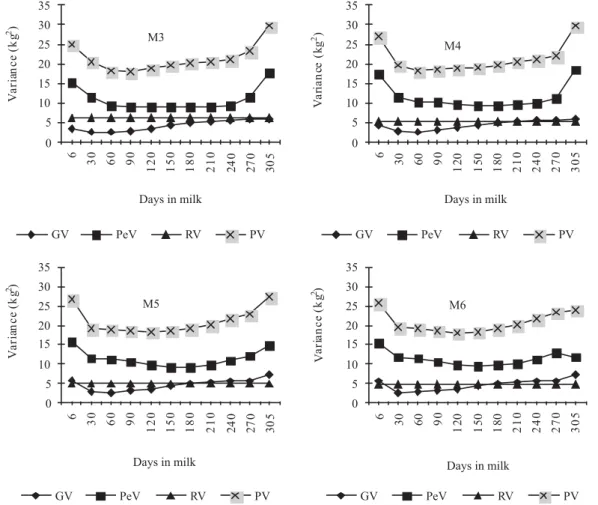
Variance estimates for test-day milk yield by models M3, M4, M5 and M6 (Figure 2) ranged, respectively, from 2.60 to 5.83; from 2.68 to 5.84; from 2. 74 to 7.46, and from 2.78 to 7.53 kg2 for the additive genetic variance; from 8.97 to 17.63; from 9.38 to 18.40; from 9.28 to 15.70, and from 9.38 15.49 kg2 for the permanent environment variance, and from 17.69 to 29.58; from 17.42 to 29.6; from 16.96 to 28.1 and from 16.88 to 27.74 kg2 for phenotype variance. The residual variance estimated by the models M3, M4, M5 and M6 were 6.12; 5.36; 4.94 and 4.72 kg2, respectively.
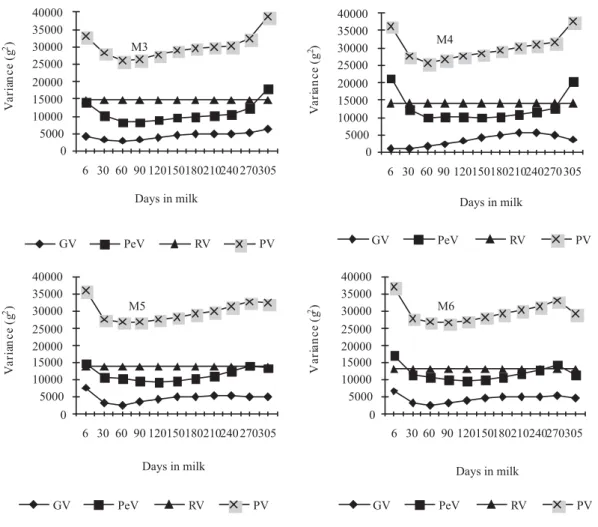
Variance estimates for test-day fat yield by models M3, M4, M5 and M6 (Figure 3) ranged, respectively, from 3,127.55
to 6,298.62; from 994.69 to 5,562.24, from 2,774.17 to 7,602.24, and from 2,832.36 to 6,703.12 g2 for the additive genetic variance; from 8,297.32 to 17,836.82; from 10,155.58 to 21,487.58; from 9,375.16 to 14,826.11, and from 9,901.14 to 17,048.79 g, for the permanent environmental variance, and from 26,084.87 to 38,795.44; from 25,150.27 to 41,049.82; from 25,769.33 to 36,048.35 and from 25,983.5 to 37,001.91 g2 for phenotype variance. The residual variance estimated by the models M3, M4, M5 and M6 were 14,660; 14,000; 13,620 and 13,250 g2, respectively.
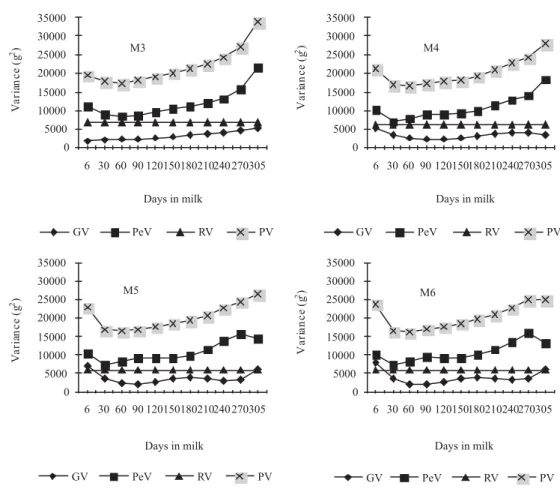
Variance estimates for test-day protein yield by models M3, M4, M5 and M6 (Figure 4), ranged, respectively, from 1,806.99 to 5,395.34; from 2,250.76 to 5,126.75; from 1,959.86 to 6961.20, and from 1,936.88 to 7,979.51 g2 for the additive 19
20 21 22 23 24 25 26
5 35 65 95 125 155 185 215 245 275 305
days in milk
600 650 700 750 800 850
5 35 65 95 125 155 185 215 245 275 305
days in milk
550 600 650 700 750 800 850
5 35 65 95 125 155 185 215 245 275 305
days in milkDays in milk Days in milk
Fat yield (g)
Milk
yield
(kg)
Protein yield (g)
studies with Holstein cows (Jamrozik et al., 1997, Berry et al., 2003; Costa et al., 2008).
Likewise, it is common to find higher estimates of permanent environmental variance at the beginning and at the end of lactation (Araújo et al., 2006; Costa et al., 2008; Dorneles et al., 2009). This trend partially agrees with reports of Ludwick & Petersen (1943), who stated that non-genetic factors tend to influence, more expressively, milk yield during the first weeks of lactation. According to Lopez-Romero & Carabaño (2003), differences among models for variance components are more commonly observed in beginning and end of lactation.
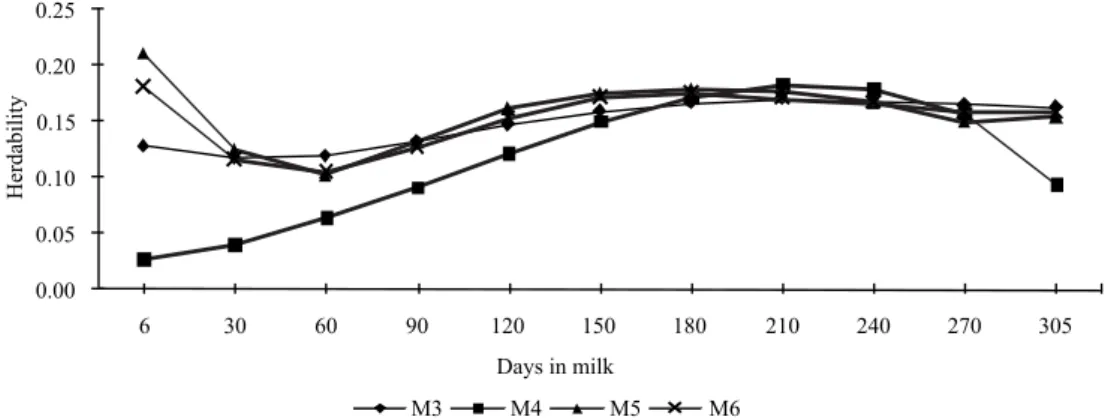
Heritability estimates for milk yield during the lactation period were similar between models (Figure 5), although the estimates in early and late lactation had greater differences. In general, for all models, heritability for milk yield increased during lactation. This increase in heritability estimates is associated not only with the increases on the values of additive genetic variance components but also with the small reductions in values of permanent environmental components between models.
genetic variance; from 8,315.75 to 21,607.87; from 7,145.35 to 18,249.11; from 7,430.40 to 15,532.11, and from 7,325.06 to 15,875.77 g2 for the variance of permanent environmental effect; and from 16,887.74 to 33,768.21; from 15,557.11 to 29,536.86; from 15,270.26 to 28,373.31, and from 15,035.94 to 29,629.28 g2 for phenotypic variance. The residual variance obtained by the models M3, M4, M5 and M6 were 6,765; 6,161; 5,880 and 5,774 g2, respectively.
Residual variance for the three traits decreased as Legendre polynomial order increased (Figures 2, 3 and 4). This trend was also observed by Araújo et al. (2006) and Costa et al. (2008), who reported that although the residual variance for milk yield is heterogeneous among certain stages of lactation, the adoption of homogeneous residual variance by the models is an economical option for adjusting the test-day yields of Holstein cows in Brazil.
In general, the estimates of production variances on the test-day for the additive genetic and estimates of permanent environmental effects showed similar trajectory among models in each trait. The decrease in genetic variability after the onset of lactation has been commonly observed in
The trend of increased heritability estimates for test-day milk yield was similar to that found by Druet et al. (2003), Cobuci et al. (2005) and Araújo et al. (2006) for Holstein animals. The magnitude of the heritability estimates is also similar to those reported by Druet et al. (2003), Mayeres et al. (2004), Cobuci et al. (2005), Araujo et al. (2006), Costa et al. (2008) and Dorneles et al. (2009), which ranged from 0.11 to 0.42. Heritability estimates for test-day fat yield showed increasing values over almost the entire period of lactation as with milk yield estimates, but with greater variation between models (Figure 6).
The estimates obtained by the M4 model showed greater differences than estimates obtained by other models and, as reported by Lopez-Romero & Carabaño (2003), they differentiated more in the extreme periods of lactation, particularly in early lactation.
The estimates of heritability for test-day fat yield were within the range found in these studies in temperate climate, ranging from 0.06 to 0.68 (Jamrozik & Schaeffer, 1997; Lidauer & Mäntysaari, 1999 and Lidauer et al., 2003), showing a large discrepancy among results. There are few
studies on genetic parameters for fat and protein yields on test-day in tropical countries.
The changes in heritability estimates for test-day protein yield were also similar to those estimated for test-day fat yield, also generating different values between models, especially in initial and final periods of lactation (Figure 7).
Heritability estimates for protein yield over lactation period were similar to those found by Jamrozik & Schaeffer (1997), Lidauer & Mäntysaari (1999) and Lidauer et al. (2003), which ranged from 0.10 to 0.69.
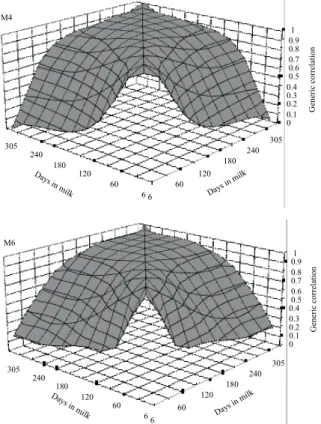
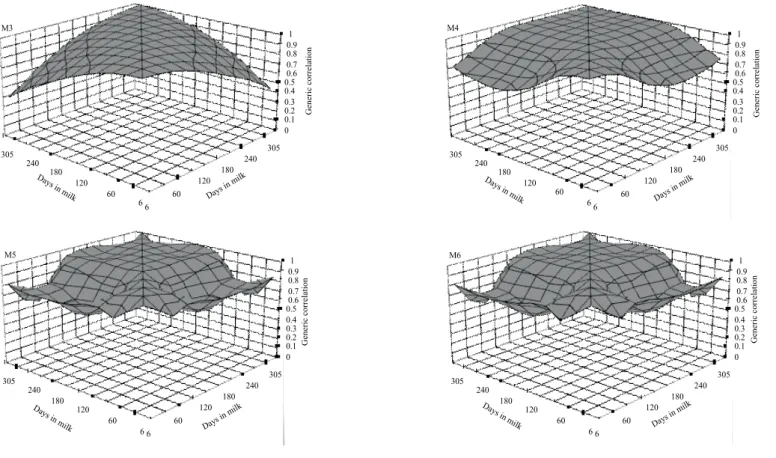
Estimates of genetic correlation for test-day yield obtained by the models M3, M4, M5 and M6 ranged, respectively, from 0.12 to 1.00; from 0.02 to 1.00; from 0.11 to 1.00 and from 0.18 to 1.00 for milk yield (Figure 8), from 0.34 to 0.99; from 0.78 to 1.00; from 0.41 to 1.00, and from 0.38 to 0.99 for fat yield (Figure 9), and from 0.42 to 0.99; from 0.65 to 1.00; from 0.57 to 1.00 and from 0.55 to 1.00 for protein yield (Figure 10).
In general, genetic correlations among test-day yields were higher when periods were closer to each other,
in agreement with Druet et al. (2003), Lidauer et al. (2003), Cobuci et al. (2005), Araujo et al. (2006) and Costa et al. (2008). In these studies genetic correlations for production for days in milk were lower when the period among yields was higher and values close to unity in adjacent periods.
Studies by Jakobsen et al. (2002) and Araújo et al. (2006) with test-day milk yields of Holstein cows found positive genetic correlations with values above 0.40. Genetic correlations among test-day fat or protein yields by the
models tended to be higher than among milk yields on the same test-days (Figures 8 to 10).
The results shown in these figures indicate that fitting polynomials from the third to sixth order had little influence on the estimation of genetic correlations among test-day milk yields, whereas for fat and protein yields this influence was greater, with some models showing high genetic correlations among nonadjacent yields.
Figure 5 - Estimates of heritability for test-day milk yield during lactation period.
Thus, for the description of the trajectory of genetic variation in lactation by the M4 model, the dispersal of genetic correlations for fat and protein yields among test-day was flatter than the adjustment by other models (Figures 9 and 10), although the genetic correlations estimated by the four models were similar over almost the full lactation period.
Different criteria were used to identify the best adjustment model to evaluate the fitting quality of these models based on the production records of the three traits (Table 2). The criteria tend to favour more complex models or larger number of parameters (Ducrocq, 2000, López-Romero & Carabaño, 2003), the values of -2log (ML) maximum likelihood function and the total residual variance were confronted with the Bayesian information criterion (Schwarz, 1978) and the Akaike information criterion (AIC) (Akaike, 1973) for presenting good capacity to fix the number of parameters in the models (Strabel et al., 2005). In these last two criteria, penalties occured in models with a higher number of parameters (Guo & Schaeffer, 2002), and for the Bayesian information criterion, penalty is more rigid (El Faro & Albuquerque, 2003). Following this
tendency, the criterion for model comparison indicated M6 model (highest number of parameters), within the three characteristics, as the one which provided the best fitting.
A reduction in the -2log (ML) maximum likelihood function, Akaike information criterion and residual variance sum was observed as the order of Legendre polynomial increased for each trait (Table 2). An increase in the values of the Bayesian information criterion was also observed for fat and protein yields, when the order of fit increased from 5 to 6.
According to El Faro & Albuquerque (2003) and Liu et al. (2006), it is not a simple task to choose the model with the best fit and frequently the methods used for comparison can lead to conflicting results. Therefore, the authors proposed the formation of an index that uses the results from different methods of comparison as a helpful tool to indicate the best suited model or best quality fit.
Thus, based on the results from most of the comparison criteria, it can be inferred that the models with a better quality fit were those which used higher order Legendre polynomials, in accordance with Guo & Schaeffer (2002).
Figure 8 - Estimates of genetic correlation for test-day milk yields along the lactation.
Figure 10 - Estimates of genetic correlation for test-day protein yields during lactation period.
Conclusions
The use of random regression models fitted with Legendre polynomial functions of order greater than 4 is recommended for carrying out genetic evaluations for milk, milk fat and milk protein yields of primiparous Holstein cows reared in Minas Gerais State, Brazil.
References
A K A I K E , H . I n f o r m a t i o n t h e o r y a n d a n e x t e n s i o n o f t h e m a x i m u m l i k e l i h o o d p r i n c i p l e . In: I N T E R N AT I O N A L S Y M P O S I U M O N I N F O R M AT I O N T H E O RY , 2., 1973, Budapeste. Proceedings... Budapeste, 1973. p.267-281. ARAÚJO, C.V.; TORRES, R.A.; COSTA, C.N. et al. Uso de
funções ortogonais para descrever a produção de leite no dia de controle por meio de modelos de regressão aleatória.
Trait Model Function of maximum Akaike information Bayesian information Sum of residual
likelihood-2log criterion criterion variance
M 3 280,401.1050 280,439.1050 280,659.9037 1,836.90
Milk yield M 4 278,321.6277 278,387.6277 278,771.1201 1,608.30
M 5 277,127.5933 277,229.5933 277,822.2634 1,483.20
M 6 276,737.9778 276,883.9778 277,732.3094 1,415.70
M 3 414,796.1485 414,834.1485 415,050.4125 4,398,000
Fat yield M 4 414,553.9960 414,619.9960 414,995.6124 4,200,000
M 5 414,311.4392 414,413.4392 414,993.9373 4,086,000.
M 6 414,167.3312 414,313.3312 415,144.2402 3,975,000.
M 3 941,91.2857 942,29.2857 944,34.0213 2,029,500.
Protein yield M 4 936,28.5643 936,94.5643 940,50.1576 1,848,300.
M 5 934,85.6116 935,87.6116 941,37.1649 1,764,000.
M 6 933,89.4335 935,35.4335 943,22.0489 1,732,200.
M3 to M6 = random regression models fitted by 3-6 orders of polynomial Legendre.
R e v i s t a B r a s i l e i r a d e Z o o t e c n i a, v. 3 5 , p . 9 6 7 - 9 7 4 ,
2 0 0 6 .
BERRY, D.P.; BUCKLEY, F.; DILLON, P. et al. Genetic parameters for body condition score, body weight, milk yield, and fertility estimated using random regression models. Journal of Dairy Science, v.86, p.3704-3717, 2003.
COBUCI, J.A.; COSTA, C.N.; TEIXEIRA, N.M. et al. Utilização dos polinômios de Legendre e da função de Wilmink em avaliações genéticas para persistência na lactação de animais da raça Holandesa. Arquivo Brasileiro de Medicina Veterinária e Zootecnia, v.58, n.4, p.614-623, 2006.
COBUCI, J.A.; EUCLYDES, R.F.; LOPES, P.S. et al. Estimation of genetic parameters for test-day milk yield in Holstein cows using a random regression models. Genetics and Molecular Biology, v.28, p.75-83, 2005.
COSTA, C.N.; MELO, C.M.R.; MACHADO, C.H.C. et al. Parâmetros genéticos para a produção de leite de controles individuais de vacas da raça Gir estimados com modelos de repetibilidade e regressão aleatória. Revista Brasileira de Zootecnia, v.34, n.5, p.1519-1530, 2005.
COSTA, C.N.; MELO, C.M.R.; PACKER, I.U. et al. Genetic parameters for test day milk yield of first lactation Holstein cows estimated by random regression using Legendre polynomials.
Revista Brasileira de Zootecnia, v.37, p.602-608, 2008. DIONELLO, N.J.L.; SILVA, C.A.S.; COSTA, C.N. et al. Estimação de
parâmetros genéticos utilizando-se a produção de leite no dia do controle em primeiras lactações de vacas da raça Jersey. Revista Brasileira de Zootecnia, v.35, n.4, p.1644-1650, 2006.
DORNELES, C.K.P.; COBUCI, J.A.; RORATO, P.R.N. et al. Estimação de parâmetros genéticos para produção de leite de vacas da raça Holandesa via regressão aleatória. Arquivo Brasileiro de Medicina Veterinária e Zootecnia, v.61, n.2,
p.407-412, 2009.
DRUET, T.; JAFFREZIC, F.; BOICHARD, D. et al. Modeling lactation curves and estimation of genetic parameters for firstlactation test-day records of French Holstein cows. Journal of Dairy Science, v.86, p.2480-2490, 2003.
DUCROCQ, V. Calving ease evaluation of French dairy bulls with a heteroskedastic threshold model with direct and maternal effects. Interbull Bulletin, v.25, p.123-130, 2000. EL FARO, L.; ALBUQUERQUE, L.G. Utilização de modelos de
regressão aleatória para produção de leite no dia do controle, com diferentes estruturas de variâncias residuais. Revista Brasileira de Zootecnia, v.32, n.5, p.1104-1113, 2003. GUO, Z.; SCHAEFFER, L.R. Random regression submodel
comparison. In: WORLD CONGRESS GENETIC APPLIED
LIVESTOCK PRODUCTION, 7., 2002, Montpellier, France.
Proceedings… Montpellier, 2002 (CD-ROM).
JAKOBSEN, J.H.; MADSEN, P.; JENSEN, J. et al. Genetic parameters for milk production and persistency for Danish Holstein estimated in random regression models using REML.
Journal of Dairy Science, v.85, n.6, p.1607-1616, 2002. JAMROZIK, J.; KISTEMAKER, G.J.; DEKKERS, J.C.M. et al. Comparison of possible covariates for use in a random regression model for analyses of test day yields. Journal o f D a i r y S c i e n c e, v.80, n.10, p.2550-2556, 1997.
J A M R O Z I K , J . ; S C H A E F F E R , L . R . E s t i m a t e s o f g e n e t i c parameters for a test day model with random regression for yield traits of first lactation Holsteins. Journal of Dairy S c i e n c e, v.80, n.4, p.762-770, 1997.
JAMROZIK, J.; SCHAEFFER, L.R.; DEKKERS, J.C.M. Genetic evaluation of dairy cattle using test day yields and random regression model. J o u r n a l o f D a i ry S c i e n c e, v.80, n.6, p.1217-1226, 1997.
LIDAUER, M.; MANTYSAARI, E.A. Multiple trait reduced rank random regression test-day model for production traits.
I n t e r b u l l B u l l e t i n, v. 2 2 , p . 7 4 - 8 0 , 1 9 9 9 .
LIDAUER, M.; MÄNTYSAARI, E.A.; STRANDÉN, I. Comparison of test-day models for genetic evaluation of productions traits in dairy cattle. Livestock Production Science, v.79, p.73-86, 2003.
LIU, Y.X.; ZHANG, J.; SCHAEFFER L.R. et al. Short communication: Optimal random regression models for milk production in diary cattle. Journal of Dairy Science, v.89, p.2233-2235, 2006.
LÓPEZ-ROMERO, P.; CARABAÑO, M.J. Comparing alternative random regression models to analyze first lactation daily milk yield data in Holstein-Friesian cattle. Livestock Production S c i e n c e, v.82, p.81-96, 2003.
LUDWICK, T.M.; PETERSEN, W.E. A measure of persistency of lactation of dairy cattle. J o u r n a l o f D a i r y S c i e n c e,
v.26, p.439-445, 1943.
MAYERES, P.; STOLL, J.; BORMANN, J. et al. Prediction of d a i l y m i l k , f a t a n d p r o t e i n p r o d u c t i o n b y a r a n d o m regression test-day model. Journal of Dairy Science, v.87, p.1925-1933, 2004.
M I S Z TA L , R E M L F 9 0 M a n u a l. Disponível em: <http://
nce.ads.uga.edu/~ignacy/numpub/blupf90/docs/remlf90.pdf> 2002. Acesso em: 13/3/2008.
SCHWARZ, G. Estimating the dimension of a model. The annals of Statistics, v.6, n.2, p.461-464, 1978.
STRABEL, T.; SZYDA, J.; PTAK, E. et al. Comparison of random regression test-day models for Polish Black and White cattle.