Revista Brasileira de
Engenharia Agrícola e Ambiental
Campina Grande, PB, UAEA/UFCG – http://www.agriambi.com.br
v.21, n.2, p.88-93, 2017
Spatial variability of soil fertility and its relation with cocoa yield
Railton O. dos Santos
1, Laís B. Franco
1, Samuel A. Silva
2, George A. Sodré
3& Agna A. Menezes
4 DOI: http://dx.doi.org/10.1590/1807-1929/agriambi.v21n2p88-93A B S T R A C T
The knowledge on the spatial variability of soil properties and crops is important for decision-making on agricultural management. The objective of this study was to evaluate the spatial variability of soil fertility and its relation with cocoa yield. The study was conducted over 14 months in an area cultivated with cocoa. A sampling grid was created to study soil chemical properties and cocoa yield (stratified in season, off-season and annual). The data were analyzed using descriptive and exploratory statistics, and geostatistics. The chemical attributes were classified using fuzzy logic to generate a soil fertility map, which was correlated with maps of crop yield. The soil of the area, except for the western region, showed possibilities ranging from medium to high for cocoa cultivation. Soil fertility showed positive spatial correlation with cocoa yield, and its effect was predominant only for the off-season and annual cocoa.
Variabilidade espacial da fertilidade do solo
e sua relação com a produtividade do cacaueiro
R E S U M O
O conhecimento da variabilidade espacial das propriedades do solo e das culturas é importante para a tomada de decisão sobre o manejo agrícola. Objetivou-se, neste estudo, avaliar a variabilidade espacial da fertilidade do solo e sua relação com a produtividade do cacaueiro. O estudo foi realizado durante 14 meses em uma área cultivada com cacaueiros. Foram estudados, a partir de um grid amostral, os atributos químicos do solo e a produtividade do cacaueiro (estratificada em safra, temporão e anual). Os dados foram analisados pela estatística descritiva e pela geoestatística. Os atributos químicos foram classificados utilizando-se a lógica fuzzy, para construção de um mapa de fertilidade do solo, o qual foi correlacionado com os mapas das estratificações da produtividade. O solo da área, com exceção da região oeste, apresentou possibilidades de média a alta, para a condução da cultura do cacau. A fertilidade apresentou correlação espacial positiva com a produtividade do cacaueiro, sendo seu efeito preponderante para o cacau temporão e anual.
Key words:
precision agriculture cocoa
spatial variability fuzzy logic
Palavras-chave: agricultura de precisão cacau
geoestatística lógica fuzzy
1 Universidade Estadual de Santa Cruz/Programa de Pós-Graduação em Produção Vegetal. Ilhéus, BA. E-mail: [email protected]; [email protected]
2 Universidade Federal do Espírito Santo/Centro de Ciências Agrárias e Engenharias/Departamento de Engenharia Rural. Alegre, ES. E-mail: [email protected] (Corresponding author)
3 Comissão Executiva do Plano da Lavoura Cacaueira/Centro de Pesquisa do Cacau. Ilhéus, BA. E-mail: [email protected] 4 Universidade Estadual de Santa Cruz/Departamento de Ciências Agrárias e Ambientais. Ilhéus, BA. E-mail: [email protected]
Introduction
In the last years, the southern portion of the Bahia state, the main cocoa-producing region of Brazil, has faced a serious production crisis, due to the appearance and spread of the
witch-broom disease (Souza Júnior et al., 2011). With the
diffusion of new tolerant seminal and clonal varieties, this problem has been slightly solved with the gradual recovery of production (Arévalo et al., 2007).
However, cocoa production sustainability is related, besides more efficient genetic materials, to the utilization of specific production systems including the use of correctives and fertilizers (Chepote et al., 2013). In this context, the knowledge on the variability of soil fertility and determination of fertilizer doses to be applied constitute a decisive step for the cocoa crop management.
The increase in the efficiency of agricultural managements must contemplate the spatial and temporal variability existing at the field (Silva et al., 2015). Thus, it is possible to optimize the use of agricultural inputs with reduction of economic and environmental risks, obtaining greater profitability and quality of the products (Corwin & Lesch, 2003).
Given the above, this study aimed to evaluate the spatial variability of soil fertility and its relation with coca yield.
Material and Methods
The study was conducted over 14 months from 2014 to 2015, in a 0.6-ha area of the Cocoa Research Center- CEPEC/ CEPLAC, located in the municipality of Ilhéus-BA, Brazil,
at latitude (14° 47' S; 39° 16' W). The soil was classified as
eutroferric Haplic Nitosol, according to the Brazilian Soil Classification System (EMBRAPA, 2013).
The experimental area was implemented in 2003 with 31 cocoa progenies in the agroforestry system with shade of Erythrinas. Cocoa has been cultivated at spacing of 3.0 x 1.5 m and Erythrina at spacing of 24 x 24 m.
The sampling for the determination of soil chemical characteristics and crop yield was performed in a sampling grid with 120 points referenced using the local coordinate system. Soil collection was performed in November 2014, under the cocoa canopy projection at a distance of 0.50 m from the stem, in the layer of 0-0.20 m. Four subsamples (one per quadrant) were used to form a composite sample per sampling point.
The soil samples were sent to the laboratory for the evaluation of chemical attributes: phosphorus (P), potassium (K), calcium (Ca), magnesium (Mg), sulfur (S), sodium (Na), iron (Fe), boron (B), copper (Cu), manganese (Mn), zinc (Zn), aluminum (Al), active acidity (pH in water), potential acidity (H + Al) and calculation of sum of exchangeable bases (SB), potential cation exchange capacity [CEC at pH 7 (T)], including the base saturation index (V%), Al saturation index (m%) and the remaining phosphorus (P-rem). Soil analyses followed the methodologies presented by EMBRAPA (2011).
The production was monthly evaluated from July 2014 to
November 2015 and stratified in off-season cocoa (March to August), season cocoa (September to February) and annual
production (sum of all months). The total healthy fruits in each sampling point and the dry weight of seeds per fruit were determined. The results were converted to yield (kg ha-1)
using the spacing of the crop.
The data were initially subjected to descriptive statistical
analysis. Normality was evaluated by the Shapiro-Wilk (W)
test at 0.05 probability level. Pearson’s coefficient was used to evaluate the existence of correlation between the data of soil chemical attributes and cocoa yield.
Subsequently, geostatistical analysis was applied to verify and quantify the spatial dependence, through the fit of experimental variograms, according to Eq.1:
( )
( )
N h( )( )
(
)
2i i
i 1
1
ˆ h Z x Z x h
2N h =
γ =
∑
− + where:
γ(h) - semivariance estimated using the experimental data; and,
N(h) - number of pairs of observations Z(xi), Z(xi+h), separated by a vector h.
The models tested for the fit of theoretical functions to the experimental variograms were spherical, exponential, Gaussian and linear with plateau. Models with higher value of R2 (coefficient of determination), lower RSS (residual sum
of squares) and higher value of correlation coefficient given by the cross validation were selected.
The degree of spatial dependence (DSD) was determined using the relationship C0/(C0 + C) and the classification proposed by Cambardella et al. (1994). After confirming the spatial dependence, the data were interpolated through ordinary kriging (Isaaks & Srivastava, 1989), to estimate values in non-sampled sites.
The maps interpolated for each chemical attribute were subjected to a fuzzy classification system, to establish the pertinence of the pixels to a certain standard set, according to Silva et al. (2010). The standard set for each soil chemical attribute was established based on the manual of recommendation of fertilization for cocoa (Chepote et al., 2013). A linear fuzzy model was used, in which higher values are equal to the standard, considered as equal to 1, while the lower values are modeled to determine their pertinence to the referred set. In the case of H + Al, high values are harmful; thus, the inverted linear model was used.
The combined effect of the attributes was measured using map algebra functions through the weighted average fuzzy operator. Equal weight was attributed to all representations, i.e., it was considered that the attributes contributed equally in the estimation of soil fertility (Silva et al., 2010).
Results and Discussion
to Cambardella et al. (1994), this can be an indication that the central tendency measurements are not dominated by atypical values in the distribution.
The mean values found for P (> 16 mg dm-3), K(> 10
cmolc dm-3), Mn (> 9.0 mg dm-3), Fe (> 30 mg dm-3) and Zn
(> 1.5 mg dm-3) were high (Chepote et al., 2013). The values
of H + Al (< 5 cmolc dm-3), potential CEC (> 8 cmol
c dm
-3), V
(> 40%), Ca (> 5 cmolc dm-³), SB (> 5 cmol
c dm
-³), OM (> 1.5
dag cm-3), S (> 10 mg dm-3), Cu (> 1.2 (mg dm-3) and pH are
within the limits established as adequate. On the other hand, the attributes Mg (< 1.9 cmolc dm-3) and B (< 0.9 mg dm-3)
remained below the recommended values for the cocoa crop.
Souza Júnior et al. (1999) comment that a good cocoa
yield results from the balance between the nutrients of the soil. According to these authors, soils that are rich in micronutrients tend to be more productive, provided that these elements do not reach toxic levels. Cidin et al.(2009), studying fertility in a soil under agroforestry system composed of cocoa and coconut trees, observed mean values of pH, P and K of 5.3, 2.3 mg dm-3 and 0.23 cmol
c dm
-3, respectively. Silva Júnior
et al. (2012), analyzing a soil cultivated with agroforestry system composed of cocoa and ‘cupuaçu’, obtained mean values of pH, P and K of 4, 9.8 mg dm-3 and 0.06 cmol
c dm
-3,
respectively, which is much lower than the values found in the present study.
The mean yields of off-season, season and annual cocoa were 1322, 393 and 1865 kg ha-1, respectively. Season cocoa
represents the main production of the crop; however, in this study the off-season cocoa showed higher yield, and the result is due to the genetic variability between the cocoa trees and the soil conditions, which allowed in this period an increase in the number of fruits and dry weight of seeds per fruit. Evaluating cocoa yield in different periods, Souza
Júnior et al. (1999) observed that the mean yield of the three most productive years varied from 1447 to 2675 kg ha-1.
The coefficients of variation were low (CV% < 12) for pH, Ca, Mg, SB, CEC (T) and V (%), medium (CV% ≥ 12 and ≤ 60) for K, P, P-rem, OM, S, Zn, B, Cu, Fe, Mn, H+Al, and high
(CV% > 60) for the yield of season, off-season and annual
cocoa, according to Warrick & Nielsen (1980). The coefficient
of variation is a measure of dispersion employed to estimate the precision of experiments (Mohallem et al., 2008) and is a good indication of the variability existing in a data set.
The CV values of the yield of off-season, season and annual cocoa were 75.6, 93 and 78%, respectively, indicating high variability. Such behavior can be attributed to the genetic variability among the progenies cultivated in the area and to the variation of soil chemical attributes, based on the correlation analysis presented in Table 2. Leite et al.(2012) found CV of 44% for potential yield of two clones of cocoa and 60% for the effective yield.
According to Table 2, the stratifications of cocoa yield showed negative and significant linear correlation with the potential CEC of the soil. This value is different from those reported in the literature and can be attributed to the high variability observed for the yield of the crop. Silva et al. (2015) comment that correlations between variables with different
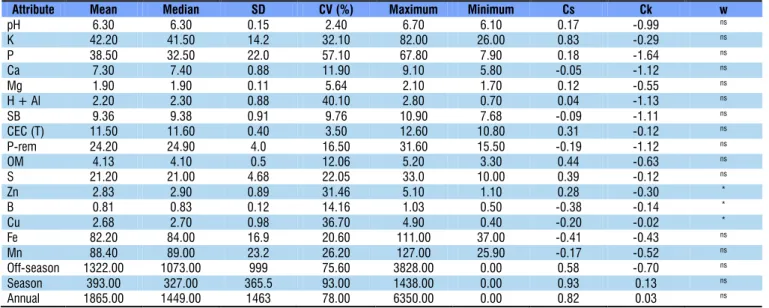
Table 1. Descriptive statistics and frequency distribution of soil attributes and cocoa yield
Attribute Mean Median SD CV (%) Maximum Minimum Cs Ck w
pH 6.30 6.30 0.15 2.40 6.70 6.10 0.17 -0.99 ns
K 42.20 41.50 14.2 32.10 82.00 26.00 0.83 -0.29 ns
P 38.50 32.50 22.0 57.10 67.80 7.90 0.18 -1.64 ns
Ca 7.30 7.40 0.88 11.90 9.10 5.80 -0.05 -1.12 ns
Mg 1.90 1.90 0.11 5.64 2.10 1.70 0.12 -0.55 ns
H + Al 2.20 2.30 0.88 40.10 2.80 0.70 0.04 -1.13 ns
SB 9.36 9.38 0.91 9.76 10.90 7.68 -0.09 -1.11 ns
CEC (T) 11.50 11.60 0.40 3.50 12.60 10.80 0.31 -0.12 ns
P-rem 24.20 24.90 4.0 16.50 31.60 15.50 -0.19 -1.12 ns
OM 4.13 4.10 0.5 12.06 5.20 3.30 0.44 -0.63 ns
S 21.20 21.00 4.68 22.05 33.0 10.00 0.39 -0.12 ns
Zn 2.83 2.90 0.89 31.46 5.10 1.10 0.28 -0.30 *
B 0.81 0.83 0.12 14.16 1.03 0.50 -0.38 -0.14 *
Cu 2.68 2.70 0.98 36.70 4.90 0.40 -0.20 -0.02 *
Fe 82.20 84.00 16.9 20.60 111.00 37.00 -0.41 -0.43 ns
Mn 88.40 89.00 23.2 26.20 127.00 25.90 -0.17 -0.52 ns
Off-season 1322.00 1073.00 999 75.60 3828.00 0.00 0.58 -0.70 ns
Season 393.00 327.00 365.5 93.00 1438.00 0.00 0.93 0.13 ns
Annual 1865.00 1449.00 1463 78.00 6350.00 0.00 0.82 0.03 ns
SD - Standard deviation; CV - Coefficient of variation; Cs - Coefficient of asymmetry; Ck - Coefficient of kurtosis; w* - Non-normal distribution by the Shapiro Wilk test at 0.05 probability level; wns - Normal distribution; Ca, Mg, H + Al, Na, SB, CEC (T) - cmol
c dm
-³; K, P, Fe, Zn, Cu, Mn, S, B - mg dm-³; P-rem - mg L-1; OM - dag cm-3; V - Base saturation (%); pH (H 2O), Al (1 mol L-1 KCl); P and K (Mehlich-1); Ca and Mg (1 mol L-1 KCl); Fe, Zn, Cu and Mn (Mehlich-1); OM (oxidoreduction); S (MCPa); B (hot water); P-rem (0.01 mol L-1 CaCl
2)
*Significant at 0.05 probability level
Attributes Season Off-season Annual
pH 0.07 -0.11 -0.06
K -0.02 -0.05 -0.05
P -0.10 -0.09 -0.11
Ca 0.04 -0.13 -0.09
Mg -0.03 -0.18 -0.15
H+Al -0.16 0.06 -0.01
SB 0.04 -0.15 -0.11
CEC (T) -0.48* -0.43* -0.48*
V 0.14 -0.07 -0.01
P-rem -0.01 -0.04 -0.04
OM -0.44* -0.15 -0.40*
S 0.04 0.06 0.06
Zn 0.17 0.20 0.41*
B -0.41* -0.16 -0.43*
Cu -0.41* -0.09 -0.15
Fe 0.10 0.15 0.15
Mn 0.02 0.02 0.02
variabilities (different CVs) may not be explanatory, indicating the need of analyses that consider the spatial distribution pattern.
The behavior observed for yield in relation to CEC (T) can also be related to factors associated with the type of soil in study. Since part of the CEC (T) is occupied by potential acidity, it is possible to claim that in regions of lower availability of nutrients the effect of acidity is more evident, influencing crop yield. The effect of potential acidity tends to be greater in soils with lower contents of clay, compromising yield (Pegoraro et al., 2008).
Mattioni et al. (2013) and Souza et al. (2010) observed negative linear correlation between CEC (T) and yields of soybean and sugarcane, respectively. Although the above-mentioned studies used crops other than cocoa, it becomes evident the possibility of negative correlations between yield and the potential CEC of the soil.
Similar behavior was observed for the yields of season and annual cocoa, for OM and B levels, which can be justified by the reduced levels of both in the soil, as previously discussed.
According to the geostatistical analysis (Table 3), all attributes, except Mg, show spatial variability in the studied area and fitted to variograms with well-defined plateaus. The theoretical models that best fitted to the experimental variograms were spherical, exponential and Gaussian.
The degree of spatial dependence (DSD) of the attributes was moderate for pH, K, V, CEC (T), Ca, OM, S, Zn, B, Cu, Fe, Mn, H + Al and off-season cocoa, and strong for P, SB, P-rem, fertility, season and annual cocoa, according to Cambardella et al. (1994). These results indicate that, except for CEC (DSD > 50%), the higher proportion of data variability can be attributed to the space that separates the samples, and the random component is less predominant. Higher DSD values improve the estimation through ordinary kriging, facilitating the interpretation of the phenomena (Isaaks & Srivastava, 1989).
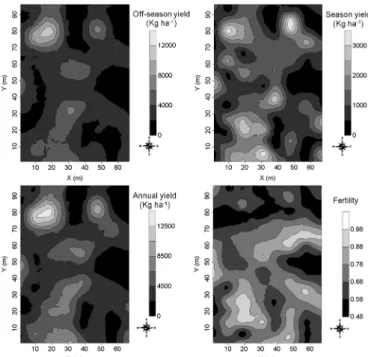
The map of yield for off-season cocoa (Figure 1) indicates that a large extension of the area has yield between 0 and 8500 kg ha-1, with a small part of the area reaching up to 12000 kg
C0 - Nugget effect; C0 + C - Sill; RSS - Residual sum of squares; R2 - Coefficient of determination of the model; DSD - Degree of spatial dependence; R2(CV) - Coefficient of determination of the cross validation; SE Pred - Percent error of the estimate; EXP - Exponential; SPH - Spherical; GAU - Gaussian; PNE - Pure nugget effect
Attribute Model C0 C0+ C RSS R2 DSD Range (m) R2(CV) SE Pred
pH EXP 0.38 1.06 0.01 0.925 35.9 35 0.341 0.17
K SPH 0.47 1.17 0.71 0.961 40.0 70 0.473 0.12
P SPH 0.29 1.53 0.27 0.993 19.0 107 0.610 0.08
Ca EXP 0.35 1.05 0.01 0.935 33.9 30 0.356 0.17
Mg PNE - - -
-H+Al SPH 0.46 1.03 0.00 0.933 44.4 22 0.407 0.13
SB EXP 0.20 1.04 0.01 0.953 19.0 25 0.260 0.20
CEC (T) GAU 0.77 1.25 0.01 0.925 55.0 90 0.215 0.21
V SPH 0.44 1.04 0.14 0.977 42.0 30 0.303 0.17
P-rem GAU 0.34 1.92 0.38 0.995 18.0 108 0.621 0.08
OM SPH 0.54 1.20 0.01 0.965 44.5 84 0.388 0.14
S EXP 0.35 1.01 0.11 0.795 34.9 30 0.299 0.17
Zn EXP 0.31 1.30 0.02 0.958 24.0 100 0.482 0.12
B SPH 0.55 1.22 0.00 0.961 45.0 81 0.353 0.17
Cu SPH 0.46 1.19 0.06 0.887 38.5 72 0.379 0.14
Fe SPH 0.56 1.13 0.10 0.671 49.0 68 0.395 0.13
Mn EXP 0.43 1.05 0.48 0.900 40.0 32 0.377 0.15
Season SPH 0.16 0.96 1.73 0.897 16.9 12 0.267 0.20
Off-season SPH 0.50 1.00 2.15 0.653 45.0 15 0.294 0.19
Annual SPH 0.02 1.01 1.38 0.899 2.20 18 0.392 0.14
Fertility SPH 0.12 0.97 0.15 0.866 12.4 13 0.338 0.17
Table 3. Models and parameters of the variograms fitted to soil attributes and cocoa yield
Figure 1. Maps of yield distribution of off-season cocoa, season cocoa and annual production and soil fertility
integrated by the fuzzy classification system
ha-1. Season cocoa showed yield lower than 3000 kg ha-1 while
annual yield reached 12500 kg ha-1. Genetic and environmental
factors may interfere with the yield of a plant (Leite et al., 2012), as well as factors related to the adopted management (Silva et al., 2010). In the case of cocoa, besides these factors, the cultivation in agroforestry systems allows different results for yield. Thus, the variation expressed inside and between systems suffers influence from those existing in the soil, plant and in the covering canopy (Deheuvels et al., 2012).
the pertinence values of fertility based on the weighting of the individualized attributes are within the interval of 0.48 to 0.98.
The western region of the area showed the lowest fertility levels, with pertinences below 0.68. This same region showed the lowest values of pH, SB and V and the highest values of H+Al, indicating that they can be the most limiting variables to cocoa yield in the studied area. The other attributes also show lower values in this portion of the area, but they are mostly above the levels considered as desirable for cocoa production.
Cocoa yield showed significant spatial correlation at 0.05 probability level with soil fertility. However, the relationship between the yield of season and the fertility was low (R2 = 36%;
y = -0.0029 + 0.2298*x) and, in this case, the preponderant effect on yield variability is due to factors other than the availability of nutrients, such as genetic or environmental factors.
The yield of off-season cocoa and the annual yield showed spatial correlation of 59% (y = -0.3399+0.8209*x) and 53% (y = -0.1646 + 0.4713*x) with soil fertility, respectively, indicating that the greatest proportion (> 50%) of the spatial variability of yield in these periods can be associated with soil fertility. Although the correlation analysis does not provide precise information on cause and effect, it is possible to claim that, for off-season cocoa, fertility was decisive to increase the number of fruits and the dry weight of seeds per fruit, increasing the yield in the period.
The annual yield is obtained by the sum of season and off-season; hence, the correlation is justified by the result observed for this last period, since it was on average about
four times higher compared with the season. Souza Júnior et
al. (1999) comment that the highest yields are expected in the season, but it is possible to claim, based on the results of the present study, that with high levels of soil fertility the yield of off-season cocoa can be equally high or higher.
The results of the present study indicate that, when a cocoa production system is studied based on the spatial analysis and no longer in average terms, various pieces of information not yet evidenced start to be observed. Studies like this can lead to more efficient management interventions, which result in the achievement of higher crop yield.
Conclusions
1. The use of geostatistics allowed to identify specific regions with variable levels of the attributes, which can be used as reference for the correction of soil fertility in variable rates.
2. The soil of the area, except for the western region, showed possibilities from medium to high for the cocoa cultivation.
3. Soil fertility exhibited positive spatial correlation with cocoa yield, and its effect is preponderant only for off-season and annual cocoa.
Acknowledgments
The authors thank the National Council for Scientific and Technological Development (CNPq) for the financial support to the research.
Literature Cited
Arévalo, E.; Ram A.; Valle, R. R. Integração de práticas de manejo no cultivo de cacau. In: Valle, R. R. (ed.). Ciência, tecnologia e manejo do cacaueiro. Itabuna: Gráfica e Editora Vital, 2007. p.324-370.
Cambardella, C. A.; Moorman, T. B.; Novak, J. M.; Parkin, T. B.;
Karlen, D. L.; Turco, R. F.; Konopka, A. E. Field-scale variability of soil properties in Central Iowa soils. Soil Science Society American
Journal, v.58, p.1501-1511. 1994. https://doi.org/10.2136/
sssaj1994.03615995005800050033x
Chepote, R. E.; Sodré, G. A.; Reis, E. L.; Pacheco, R. G.; Marrocos, P. C. L.; Valle, R. R. Recomendações de corretivos e fertilizantes na cultura do cacaueiro no sul da Bahia. Ilhéus: CEPLAC/CEPEC. 2013. 44p. Boletim Técnico, 203
Cidin, A. C.; Corrêa, F. L. D. O.; Pequeno, P. L. L.; Almeida, C. M. V. C.;
Müller, M. W.; Macedo, R. G.; Gama-Rodrigues, A. C. Avaliação
da fertilidade do solo em sistema agroflorestal com cacaueiros
e coqueiros em Ji-Paraná, Rondônia, Brasil. Agrotrópica, v.21, p.65-72, 2009.
Corwin, D. L.; Lesch, S. M. Application of soil electrical conductivity to precision agriculture: Theory, principles, and guidelines.
Agronomy Journal, v.95, p.455-471. 2003. https://doi.org/10.2134/
agronj2003.0455
Deheuvels, O.; Avelino, J.; Somarriba, E.; Malezieux, E. Vegetation
structure and productivity in cocoa-based agroforestry systems in Talamanca, Costa Rica. Agriculture, Ecosystems and Environment, v.149, p.181-188. 2012. https://doi.org/10.1016/j. agee.2011.03.003
EMBRAPA - Empresa Brasileira de Pesquisa Agropecuária. Manual
de métodos de análise de solos. 2.ed. Rio de Janeiro: EMBRAPA,
2011. 230p.
EMBRAPA - Empresa Brasileira de Pesquisa Agropecuária. Centro Nacional de Pesquisas de Solos. Sistema brasileiro de classificação
de solos. 3.ed. Rio de Janeiro: EMBRAPA, 2013. 353p.
Isaaks, E. H.; Srivastava, R. M. An introduction to applied geostatistics. New York: Oxford Press, 1989. 561p.
Leite, J. B. V.; Fonseca, E. V.; Sodré, G. A.; Valle, R. R.; Nascimento,
M. N.; Marrocos, P. C. L. Comportamento produtivo de cacau no semiárido do Brasil. Agrotrópica, v.24, p.85-90. 2012.
Mattioni, N. M.; Schuch, L. O. B.; Villela, F. A. Variabilidade espacial e efeito de atributos químicos de um Latossolo na população de plantas e produtividade da cultura da soja. Revista da FZVA, v.19, p.20-32, 2013.
Mohallem, D. F.; Tavares, M.; Silva, P. L.; Guimarães, E. C.; Freitas, R. F. Avaliação do coeficiente de variação com medida de precisão em experimentos com frangos de corte. Arquivo Brasileiro de Medicina Veterinária e Zootecnia, v.60, p.449-453, 2008. https:// doi.org/10.1590/S0102-09352008000200026
Pegoraro, R. F.; Santos Neto, J. A.; Silva, I. R.; Fontes, R. L. F.;
Faria, A. F.; Moreira, F. F. Crescimento de soja em solos em resposta a doses de Boro, calagem e textura do solo. Ciência e Agrotecnologia, v.32, p.1092-1098, 2008. https://doi.org/10.1590/ S1413-70542008000400009
Silva, S. A.; Lima, J. S. S.; Souza, G. S.; Oliveira, R. B.; Xavier, A. C.
Lógica fuzzy na avaliação da fertilidade do solo e produtividade
do café conilon. Revista Ciência Agronômica, v.41, p.9-17.
Silva, S. A.; Queiroz, D. M. de; Ferreira, W. P. M.; Correa, P. C.; Rufino, J. L. S. Mapping the potential beverage quality of coffee produced in the Zona da Mata, Minas Gerais, Brazil. Journal of
Science of Food and Agriculture, v.96, p.1-11, 2015. https://dx.doi. org/10.1002/jsfa.7485
Silva Júnior, C. A.; Boechat, C. L.; Carvalho, L. A. Atributos químicos do solo sob conversão de floresta amazônica para diferentes
sistemas na região norte do Pará, Brasil. Bioscience Journal, v.28, p.566-572, 2012.
Souza, Z. M. de; Cerri, D. G. P.; Magalhães, P. S. G.; Siqueira, D. S. Spatial variability of soil attributes and sugarcane yield in relation to topographic location. Revista Brasileira de Engenharia Agrícola e Ambiental, v.14, p.1250-1256, 2010. https://doi.org/10.1590/ S1415-43662010001200001
Souza Júnior, J. O.; Carmello, Q. A. C.; Sodré, G. A. Substrato e
adubação fosfatada para a produção de mudas clonais de cacau. Revista Brasileira de Ciência do Solo, v.35, p.151-159, 2011. https://doi.org/10.1590/S0100-06832011000100014
Souza Júnior, J. O.; Ker, J. C.; Mello, J. W. V.; Cruz, C. D. Produtividade do
cacaueiro em função de características do solo. II. Características físico-morfológicas e alguns elementos extraídos pelo ataque
sulfúrico. Revista Brasileira de Ciência do Solo, v.23, p.873-880,
1999. https://doi.org/10.1590/S0100-06831999000400014
Warrick, A. W.; Nielsen, D. R. Spatial variability of soil physical