Genetic characterization of the Neotropical catfish
Pimelodus maculatus
(Pimelodidae, Siluriformes) in the Upper Uruguay River
Josiane Ribolli
1, Cláudio Manoel Rodrigues de Melo
2and Evoy Zaniboni-Filho
11
Laboratório de Biologia e Cultivo de Peixes de Água Doce, Departamento de Aquicultura,
Universidade Federal de Santa Catarina, Florianópolis, SC, Brazil.
2Laboratóiro de Moluscos Marinhos, Departamento de Aquicultura,
Universidade Federal de Santa Catarina, Florianópolis, SC, Brazil.
Abstract
Freshwater fish present unique challenges when one attempts to understand the factors that determine the structure of their populations. Habitat fragmentation is a leading cause of population decline that threatens ecosystems world-wide. In this study, we investigated the conservation status of genetic variability in the Neotropical catfish (Pimelodus maculatus). Specifically, we examined the structure and genetic diversity of this species in a region of the Upper Uru-guay River fragmented by natural barriers and dams. There was no genetic structure among the four sites analyzed, indicating the existence of only one population group. A combination of environmental management and genetic monitoring should be used to minimize the impact of impoundment on panmitic populations of migratory fish species. Key words:conservation genetics, dams, habitat fragmentation, microsatellite.
Received: November 24, 2011; Accepted: May 24, 2012.
Introduction
Investigations into the mechanisms involved in creat-ing population genetic structure are an important aspect of wildlife management because genetic variation is the means whereby a given species responds and adapts to a changing environment (Oliveiraet al., 2009). One of the primary impacts of many human activities is habitat frag-mentation (Templeton, 2001), especially for rivers, in which damming inhibits migratory behaviour and de-creases environmental cues for spawning, and can lead to substantial reductions in gene flow within and between some river systems (Yamamotoet al., 2004; Dudgeon et
al., 2006; Helfman, 2007; Barlettaet al., 2010; Colemanet
al., 2010; Huguenyet al., 2011).
The hydropower potential of Brazilian rivers is large and currently includes more than 988 hydroelectric dams (ANEEL, 2012). Dams restrict the free movement of aquatic animals by preventing them from reaching up-stream habitats (Benke, 1990; Dynesius and Nilsson, 1994) and by interfering with the migratory behavior of freshwa-ter fishes (Pringleet al., 2000). Such interference can lead to a reduction in population size and increase the
probabil-ity of differentiation because of genetic drift (Heggenes and Røed, 2006; Dehaiset al., 2010).
The structuring of populations in reduced and some-times isolated groups has an impact on the erosion of ge-netic variation and increased inbreeding, which are factors of paramount importance in conservation programs (Fran-khamet al., 2002; Allendorf and Luikart, 2007). In popula-tions with restricted gene flow, the changes in allele frequencies due to genetic drift are inversely related to pop-ulation size and are compounded by the number of genera-tions of isolation (Falconer, 1989). In river systems, fish can form a panmictic population or genetically differenti-ated populations with sufficient gene flow to maintain the integrity of the metapopulation (Piorski et al., 2008). McGlashan and Hughes (2000) identified freshwater fish with high levels of genetic differentiation among popula-tions from different river systems. For many freshwater fish, physical barriers (natural or man-made), reproductive behavior and ecological characteristics exert a large influ-ence on genetic structuring (Avise and Felley, 1979; Hol-deregger and Wagner, 2006; Barthemet al., 1991; Godinho
et al., 2007a; Vergaraet al., 2008).
The family Pimelodidae is one of the largest families of Neotropical catfish (Pinna, 1998). This family includes the yellow-mandi catfish, or mandi-pintado (Pimelodus
maculatus), which is a small abundant catfish that is impor-tant in regional fishing (Zaniboni-Filho and Schulz, 2003).
www.sbg.org.br
Send correspondence to Josiane Ribolli. Laboratório de Biologia e Cultivo de Peixes de Água Doce, Departamento de Aquicultura, Universidade Federal de Santa Catarina, Florianopólis, SC, Brazil. E-mail: josianeribolli@gmail.com.
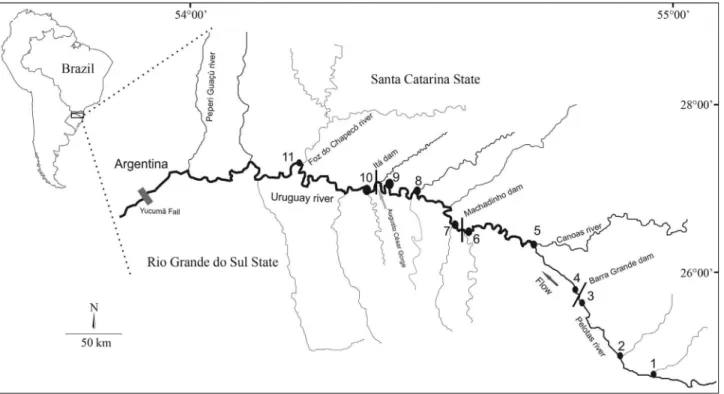
The Upper Uruguay River has its headwaters in the Serra Geral mountains near the southern coast of Brazil, where it is known as the Pelotas River, and continues along the bor-der between the Brazilian states of Santa Catarina and Rio Grande do Sul. The Upper Uruguay River is formed from a series of pools and rapids that become an obstacle to fish movement during periods of drought (Eletrosul/CNEC, 1990). These rapids were flooded by the reservoir created by the Itá hydroelectric dam in 1999 (Zaniboni-Filho and Schulz, 2003). Since then, four additional hydroelectric dams have been constructed on the Upper Uruguay River, bringing the current total to five dams.
Many studies have suggested that anthropogenic disturbances that cause habitat fragmentation are respon-sible for genetic variation among and within populations of freshwater fish (Neraas and Spruell, 2001; Pamponetet al., 2008; Esguícero and Arcifa, 2010). Such variation has been studied by a variety of techniques, including micro-satellites, which have become one of the most popular markers for making inferences on population genetics be-cause they are abundant, widely distributed in the genome and highly polymorphic (O’Connell and Wright, 1997; DeWoody and Avise, 2000; Wu and Drummond, 2011).
The aim of this study was to investigate the genetic diversity inP. maculatusin the Upper Uruguay River with particular reference to the genetic differentiation among populations resulting from natural barriers and isolation by hydroelectric dams.
Materials and Methods
Sampling and DNA extraction
The Upper Uruguay River is formed by rapids, with the Augusto César Gorge (1,493 km from the river mouth) located just below the confluence with the Peixe River be-ing an important obstacle; in this stretch, the river drops 8 m in only 7 km (Eletrosul/CNEC, 1990). Several hydroelec-tric dams have been constructed on this river, including the Itá dam (built in 2000, with a flooded area of 141 km2) in the middle section of the river, the Machadinho dam (built in 2002, with a flooded area of 56.7 km2), upstream of Itá dam in the middle segment of the river, and the Barra Grande dam (built in 2005, with a flooded area of 94 km2) located at the head of the river.
Two hundred and ten specimens ofP. maculatuswere collected from 2007 to 2009 at different locations along the Upper Uruguay River during all seasons (Figure 1). All samples were collected after construction of the dams and were obtained from four sites: BG – upstream of the Barra Grande dam (n = 51), MA – downstream of the Barra Grande dam and upstream of the Machadinho dam (n = 60), IT – downstream of the Machadinho dam and upstream of the Itá dam (n = 48) and DI – downstream of the Itá dam (n = 51) (Table 1). Genomic DNA was extracted from fin clips using the proteinase K/phenol-chloroform protocol (Sambrooket al., 2001).
Microsatellite amplification and genotyping
Eight polymorphic loci (Pmac01, Pmac02, Pmac03,
Pmac06, Pmac07, Pmac08, Pmac10andPmac11) were se-lected from 11 previously reported microsatellites (Paiva and Kalapothakis, 2008). PCR amplifications of each mi-crosatellite locus were done using an MJ Research PTC-100 thermal cycler with the assay conditions described by these authors for each locus. The PCR products were sepa-rated by electrophoresis in 4% polyacrylamide gels with a 10-bp DNA ladder (Gibco BRL) and stained with silver (Cresteet al., 2001). DNA fragments stained with silver were illuminated with a white light transilluminator and an-alyzed manually twice. All gels were documented with a scanner.
Data analysis
Prior to statistical analyses, Micro-Checker (Ooster-houtet al., 2004) was used to test for scoring errors due to null alleles, stuttering or large allele dropout. Genetic di-versity was measured by the number of alleles per locus (A), observed heterozygosity (Ho) and expected hetero-zygosity (He) and assignment tests were calculated with GenAlex 6.41 (Peakall and Smouse, 2006). Allelic richness (RA) and inbreeding coefficient (FIS) were calculated with
FSTAT 2.9.3 (Goudet, 2002). Departures from Hardy-Weinberg equilibrium expectations (HWE), genotypic linkage disequilibrium and the number of migrants per gen-eration (Nm) were calculated with GenePop (Barton and Slatkin, 1986).
The occurrence of genetic structuration among groups was investigated with pairwise FST (Weir and
Cockerham, 1984) in FSTAT. However, since the tradi-tionalFSTmay have undesirable attributes in some
situa-tions when estimated from highly polymorphic markers such as microsatellites (Jost, 2008; Heller and Siegismund, 2009) we also calculated a recently developed alternative measure, DEST (Jost, 2008), using the software SMOGD
1.2.5 (Crawford, 2010).
Two contrasting Bayesian clustering methods were used to examine population genetic structure without allo-cating individuals to populations prior to analysis: STRUCTURE ver. 2.2 (Pritchard et al., 2000) and SAMOVA ver. 1.0 (Dupanloupet al., 2002). Based solely on genetic data, STRUCTURE identifies the number of dis-tinct clusters, assigns individuals to clusters and identifies migrants and admixed individuals. To determine the num-ber of populations (K) within the complete data set, two in-dependent simulations forK= 1-6 with 100,000 burn-in it-erations and 500,000 data itit-erations were run. Analysis was done using the admixture model of population structure (i.e., each individual derives some fraction of its genome from each of theKpopulations) and allele frequencies cor-related among populations (i.e., allele frequencies in the different populations are likely to be similar due to factors such as migration or shared ancestry) (Pritchard et al., 2000). The estimation ofKbased on maximum posterior likelihood ln (K) is an approximation and, in many empiri-cal data sets, may continue to increase once the true number of populations is reached; therefore, an alternative method to estimateKbased on the change in likelihood (DK) was
also applied (Evannoet al., 2005).
By using genetic data and geographic coordinates, SAMOVA (spatial analysis of molecular variance) defines groups of populations that are geographically homogenous and maximally differentiated from each other (Dupanloup
et al., 2002). To determine the number of groups within the complete data set, 100 simulated annealing processes for eachK= 1-11 (sample sites; Table 1) were run on a sum of square size differences distance matrix.
The genetic structure and the possible existence of natural groups of populations beyond the molecular parti-tions between and within sites, as well as variaparti-tions among individuals, were examined through analysis of molecular variance (AMOVA) performed with ARLEQUIN version 3.11 (Excoffieret al., 2005), with 1,023 permutations to test for significance. The analysis of the four groups was
Table 1- Sampling sites forPimelodus maculatus, including sample sizes per site (N) and localization.
Study site ID Specific collecting location N Localization
BG 1 Pelotas River 23 28°16’05.25” S 50°41’47.34” W
2 Downstream Vacas Gordas River 6 28°02’28.54” S 50°28.71” W
3 Immediately upstream of Barra Grande dam 22 27°57’58.54” S 51°01’59.14” W
MA 4 Downstream of Barra Grande dam 20 27°32’16” S 51°51’24” W
5 Downstream Canoas River 23 27°35’59,7” S 51°23’28,9” W
6 Immediately upstream of Machadinho dam 17 27°31’25” S 51°47’05” W
IT 7 Downstream Machadinho dam 21 27°31’37” S 51°47’06” W
8 Itá reservoir 13 27°22’43” S 51°59’18” W
9 Immediately upstream of Itá dam 14 27°17’10” S 52°20’27” W
DI 10 Immediately downstream of Itá dam 12 27°05’54” S 53°01’02” W
defined based on the fragmentation caused by the dams (Table 1).
Results
Genetic variability
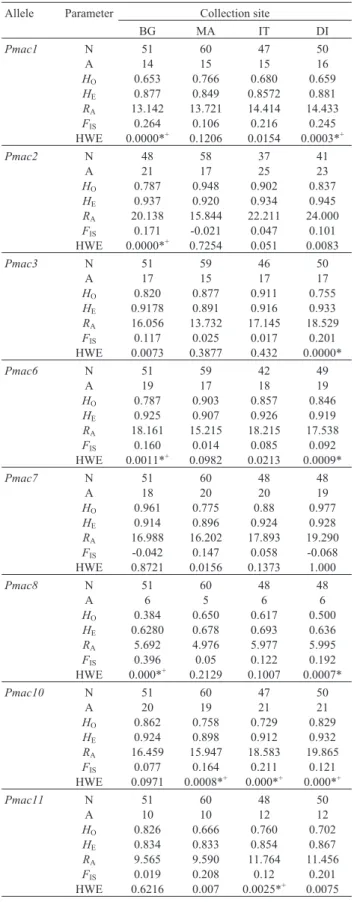
All of the microsatellites analyzed were highly poly-morphic and the number of alleles per locus ranged from five (Pmac8) to 25 (Pmac2) (mean = 15.81). The expected and observed heterozygosities ranged from 0.629 (Pmac8) to 0.948 (Pmac2) and from 0.385 (Pmac8) to 0.978 (Pmac7), respectively. All populations exhibited high levels of allelic richness (RA) that ranged from 4.98 (Pmac8) to 24.0
(Pmac2) (Table 2). There was no linkage disequilibrium for the pairs of loci analyzed, indicating that the observed fre-quency of the combination of alleles for a pair of loci was similar to the expected frequency. TheFISindex suggested a
heterozygote deficiency in the four populations analyzed (Table 2). Significant departures from Hardy-Weinberg equilibrium (p < 0.0055, adjusted using the Bonferroni cor-rection) were detected at the population level for 11 loci. Es-timates of the occurrence of null alleles, as checked with the program Micro-Checker, indicated that null alleles might be present at nine cases in which departure from Hardy-Weinberg equilibrium was identified (Table 2).
Population genetic structure
The average differentiation among the study popula-tions was low for FST (0.0229) and moderate for DEST
(0.255). The genetic differentiation among populations es-timated by theFSTpairwise comparisons index ranged from
0.004 to 0.0352; these values were not significant, indicat-ing the absence of genetic differentiation among the groups analyzed (Table 3). The differentiation index DESThad the
highest values, which ranged from 0.129 (between BG and DI) to 0.3307 (between MA and IT).
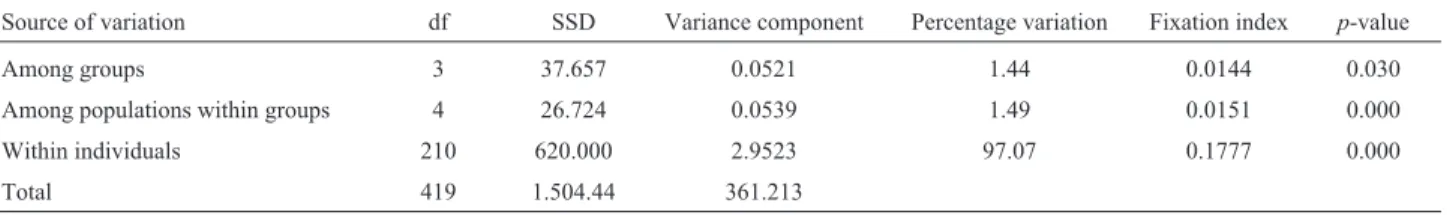
The values for the gene flow parameterNm, which was measured based on the observed private alleles (Barton and Slatkin, 1986), were high, with an average of 2.86 mi-grants per generation. Determination of the distribution of molecular variation by AMOVA revealed that most of the total genetic variance was also found within individuals (Table 4). SAMOVA revealed that there was no genetic structure among the individuals ofP. maculatusfrom the Upper Uruguay River. Analysis of the entire dataset using STRUCTURE indicated that the most likely value forK= 2 based on the highest mean estimated log probability (Prit-chardet al., 2000). However, with the Evanno correction, the highest value ofDKfor the entire data set revealed a
lack of structure among the groups (DK= 1) (Figure 2).
Discussion
Microsatellite analysis
The overall genetic variation inP. maculatusof the Upper Uruguay River basin was high (He = 0.629 to 0.948)
Table 2- Genetic variation in populations ofPimelodus maculatus. Allele Parameter Collection site
BG MA IT DI
Pmac1 N 51 60 47 50
A 14 15 15 16
HO 0.653 0.766 0.680 0.659
HE 0.877 0.849 0.8572 0.881
RA 13.142 13.721 14.414 14.433
FIS 0.264 0.106 0.216 0.245
HWE 0.0000*+ 0.1206 0.0154 0.0003*+
Pmac2 N 48 58 37 41
A 21 17 25 23
HO 0.787 0.948 0.902 0.837
HE 0.937 0.920 0.934 0.945
RA 20.138 15.844 22.211 24.000
FIS 0.171 -0.021 0.047 0.101
HWE 0.0000*+ 0.7254 0.051 0.0083
Pmac3 N 51 59 46 50
A 17 15 17 17
HO 0.820 0.877 0.911 0.755
HE 0.9178 0.891 0.916 0.933
RA 16.056 13.732 17.145 18.529
FIS 0.117 0.025 0.017 0.201
HWE 0.0073 0.3877 0.432 0.0000*
Pmac6 N 51 59 42 49
A 19 17 18 19
HO 0.787 0.903 0.857 0.846
HE 0.925 0.907 0.926 0.919
RA 18.161 15.215 18.215 17.538
FIS 0.160 0.014 0.085 0.092
HWE 0.0011*+ 0.0982 0.0213 0.0009*
Pmac7 N 51 60 48 48
A 18 20 20 19
HO 0.961 0.775 0.88 0.977
HE 0.914 0.896 0.924 0.928
RA 16.988 16.202 17.893 19.290 FIS -0.042 0.147 0.058 -0.068
HWE 0.8721 0.0156 0.1373 1.000
Pmac8 N 51 60 48 48
A 6 5 6 6
HO 0.384 0.650 0.617 0.500
HE 0.6280 0.678 0.693 0.636
RA 5.692 4.976 5.977 5.995
FIS 0.396 0.05 0.122 0.192
HWE 0.000*+ 0.2129 0.1007 0.0007*
Pmac10 N 51 60 47 50
A 20 19 21 21
HO 0.862 0.758 0.729 0.829
HE 0.924 0.898 0.912 0.932
RA 16.459 15.947 18.583 19.865
FIS 0.077 0.164 0.211 0.121
HWE 0.0971 0.0008*+ 0.000*+ 0.000*+
Pmac11 N 51 60 48 50
A 10 10 12 12
HO 0.826 0.666 0.760 0.702
HE 0.834 0.833 0.854 0.867
RA 9.565 9.590 11.764 11.456
FIS 0.019 0.208 0.12 0.201
HWE 0.6216 0.007 0.0025*+ 0.0075
when compared with other with other species of Siluri-formes (He = 0.055 to 0.861 (Abreuet al., 2009) and 0.310 to 0.942 (Pereira et al., 2009)). The loci investigated showed a high level of polymorphism (15.81 alleles/locus). Genetic diversity was high and similar to that commonly found in wild fish populations (Martinset al., 2003; Pereira
et al., 2009; Garcezet al., 2011).
Tests for stutter miscall and allelic dropout in MICROCHECKER were not significant in any of the sam-ples. The occurrence of null alleles seen here is a common problem with microsatellite markers and may be explained by the low efficiency of hybridization of the primers used to amplify some loci, possibly because of point mutations in one or more annealing sites of these primers (Callenet al., 1993; O’Connell and Wright, 1997; Dakin and Avise, 2004) or because of failures associated with manual geno-typing.
Population structure
Our analysis revealed high genetic diversity and no population structuring. Estimates of population differentia-tion are crucial for understanding the connectivity among populations and provide an important tool for developing conservation strategies (Balloux and Lugon-Moulin, 2002). The populations ofP. maculatusshowed extremely high levels of diversity, with low FST values (mean =
0.0229) (Table 3). The lowFSTvalues and individual-based
Bayesian clustering seen here did not detect any genetic structure among the four populations. An equivalent com-parison done with the estimator of actual differentiation DESTindicated a higher level of differentiation among these
populations (0.129 to 0.3307).
DESTis considered to be particularly suitable for
esti-mating population structure with microsatellites markers, especially in situations where within-locus genetic diver-sity is high, as is often the case for highly polymorphic microsatellite data (Hedrick, 2005; Jost, 2008). In general, DEST estimates tend to be 3-4 times higher than theirFST
equivalents, with a near-perfect correlation between both estimates (Ensinget al., 2011). According to Jost (2008),
FSTstatistics tend to underestimate true levels of population
differentiation compared to Jost’s D and related statistics because they detect smaller levels of genetic differentiation in relation to DEST. Birdet al.(2011) recommended that
re-searchers apply both a xation index and an index of genetic differentiation to their datasets. Our data set provides an op-portunity to compare those two statistics.
Habitat fragmentation is one of the most common outcomes of environmental changes induced by human ac-tivities (Frankham et al., 2002; Fabry et al., 2008; Tuo-mainen and Candolin, 2011). However, our analysis of the genetic structure of populations ofP. maculatusrevealed that despite the existence of seasonal natural barriers, the methods used were unable to differentiate the populations of P. maculatus genetically. AMOVA has been widely used for hierarchical analysis of the genetic differentiation among populations (Dupanloupet al., 2002; Pereiraet al., 2009; Colemanet al., 2010; Wollebaeket al., 2011). Here, AMOVA indicated that the vast majority of variance oc-curred within populations and not between them. These re-sults agree with those obtained by Population Assignment
Figure 2- STRUCTURE results for maximum likelihood lnK(•) andDK
(–), for one to six populations (K). Maximum peaks inKwere atK= 1.
Table 3- Values ofFST(below diagonal) and D (above diagonal) for pairwise comparisons of the four sites sampled.
BG MA IT DI
BG - 0.2723 0.2686 0.1293
MA 0.0300 - 0.3307 0.2611
IT 0.0294 0.0352 - 0.2383
DI 0.0040 0.0231 0.0150
-Significance level: 0.05.
Table 4- Uruguay River AMOVA summaries under the standard model followed by the microsatellite model (SMM), as implemented in Arlequin 3.1.0.2 (Excoffieret al., 2005). The data show the degrees of freedom (df), sum of squared deviation (SSD), variance component estimates, the percent-age of total variance that each component contributed, the fixation index and the probability of obtaining by chance alone a more extreme variance com-ponent than the observed values (p-value). Thep-values were derived from significance tests (1023 permutations) calculated with the distance method (FST) in Arlequin 3.11.
Source of variation df SSD Variance component Percentage variation Fixation index p-value
Among groups 3 37.657 0.0521 1.44 0.0144 0.030
Among populations within groups 4 26.724 0.0539 1.49 0.0151 0.000
Within individuals 210 620.000 2.9523 97.07 0.1777 0.000
using GenAlex which, based on individuals of known ori-gin, found that many individuals belonging to a given popu-lation were attributed to other popupopu-lations that were different from the previously established one. SAMOVA and STRUCTURE established that the populations were genetically homogeneous. The absence of genetic structure in a population has also been observed for pacu (Piaractus
mesopotamicus) (Calcagnotto and DeSalle, 2009; Iervolino
et al., 2010) and the genusProchilodus(Sivasundaret al., 2001).
High levels of genetic diversity are often observed in migrating fish with large populations because, in large pop-ulations, high rates of migration minimize the effects of ge-netic drift (Santoset al., 2007).Pimelodus maculatusis a lateral migratory species that leaves the main river to spawn in tributaries (Zaniboni-Filho and Schulz, 2003). However, there are reports of migrations occurring over long dis-tances. The reproduction of Neotropical migratory fish occurs during the rainy season, when the fish travel to tribu-taries to spawn (Agostinhoet al., 2003), and these migra-tions can be regarded as a homogenizing agent among pop-ulations (Turner et al., 2004). Pimelodus maculatus produces small floating eggs that can be passively carried to the main channel, thereby mixing larvae from different tributaries. In addition, during the rainy season, natural bar-riers are frequently submerged by the high water level, thus facilitating the migration of fishes.
The level of gene flow was high, with an average of 2.86 migrants per generation, indicating that some gene ex-change occurred among all of the sampled populations be-fore construction of the dams. According to Nei (1987),Nm values above 1 indicate that genetic flow constitutes a posi-tive factor against genetic differentiation among popula-tions (Spieth, 1974). These results are consistent with the values found by Pereiraet al.(2009). When populations of
Pseudoplatystoma corruscansin the La Plata Basin were analyzed, these authors foundNm= 2.65 and the occur-rence of low to moderate genetic structure. In contrast, Abreuet al.(2009) reportedNm= 0.841 for this same spe-cies, with pronounced genetic differentiation. The gene flow data observed here forP. maculatuswere supported by theFST, AMOVA and STRUCTURE analyses, with no
significant differences among the populations. Another im-portant factor related to the homogeneity of these fish pop-ulations could be the ability of some individuals to migrate further than others. The unique reproductive characteristics of these fish affect the potential for gene flow among popu-lations because of the possibility of contact among different regions; this contact involves crossing physical barriers that in turn facilitates genetic exchange among populations. High gene flow has previously been reported for pop-ulations ofP. maculatusfrom the lower and middle Tietê River (6.480), the lower and upper Tietê River (4.596) and the middle and upper Tietê River (4.332), with important differences among the populations of these three regions
(Almeida and Sodré, 1998). However, Almeida et al. (2003) found structuring among populations in the upper, middle and lower Paranapanema River, with gene flow es-timates of 4.464, 2.173 and 1.877, respectively. According to these authors, the differentiation ofP. maculatus popula-tions in the Paranapanema River most probably reflected the existence of many waterfalls, some of which are more than 60 m in height. The level of gene flow may be the most important determinant of population structure because it defines the extent to which each local population is an inde-pendent evolutionary unit (Slatkin, 1995).
According to Zaniboni-Filho and Schulz (2003), be-fore the construction of dams, the Upper Uruguay River had a bed composed of a sequence of pools and rapids that, in periods of drought, became an obstacle for fish to swim through. However, we found no significant differences be-tween individuals from below and above the Augusto César gorge. Currently, the population ofP. maculatusin the Up-per Uruguay River basin is separated by five hydroelectric dams, with no possibility for interaction among the popula-tions. Given the natural isolation imposed by rivers and the small size of most populations, freshwater fish species would be expected to show higher levels of subdivision and genetic differentiation among populations (Ward et al., 1994; Neraas and Spruell, 2001). However, high levels of gene flow ensure short genetic distances and help to main-tain homogenous populations; this results in limited evolu-tionary differences between regions while promoting relatively high genetic variability. Ramellaet al.(2006) re-ported high genetic diversity among individuals of P.
maculatusbased on an analysis using RAPD markers.
The Upper Uruguay River is continually being frag-mented by the construction of hydroelectric dams, resulting in the isolation of different populations of fish species. Yamamotoet al.(2004) reported that habitat fragmenta-tion, such as caused by dams, can altering the genetic vari-ability of many freshwater fish species in which the effects of isolation on genetic variation and population differentia-tion have been studied (Hansen and Mensberg, 1998, Ne-raas and Spruell, 2001). The risks associated with popula-tion fragmentapopula-tion are directly associated with the level of gene flow among the fragmented populations (Frankhamet
al., 2002), such that the lower the flow between populations the greater the risk of losing variability.
im-pact caused by hydroelectric dams on the genetic structure of this species.
In populations with a restricted gene flow, changes in the allele frequencies caused by genetic drift are inversely related to population size and can be compounded by the number of generations of isolation (Falconer, 1989). Con-sequently, migration corridors between populations sepa-rated by dams may be valuable for sustaining their evolutionary potential (Wollebaeket al., 2011).
The effects of existing dams on the fish community need to be understood in order to make better informed de-cisions about future projects.Pimelodus maculatus is an abundant migratory species in which genetic flow main-tains the samples in panmixy, including geographically dis-tant populations. Because the genetic effects of population isolation may be similar across species the results from this study should prove useful to a variety of ecosystem manag-ers. Studies of the genetic structure of freshwater fish should be requested by IBAMA, the Brazilian federal envi-ronmental agency, as a prerequisite before the construction of dams in Brazilian rivers.
Acknowledgments
The authors thank the field collection team of the Freshwater Fish Biology and Culture Laboratory for help with sample collection and colleagues of the Laboratory of Developmental Physiology and Plant at UFSC who pro-vided the equipment for molecular analysis. This work was supported by CNPq, Tractebel Energia and Fapesc.
References
Abreu MM, Pereira LHG, Vila VB and Foresti F (2009) Genetic variability of two populations of Pseudoplatystoma reticulatum from the Upper Paraguay River Basin. Genet Mol Biol 32:868-873.
Agostinho AA, Gomes LC, Suzuki HI and Júlio Jr HF (2003) Mi-gratory fishes of the Paraguay River Basins, Brazil. In: Carolsfeld J, Harvey B, Ross C and Baer A (eds) Migratory Fishes of South America: Biology, Bisheries and Conserva-tion Status. InternaConserva-tional Development Research Centre, Ot-tawa, pp 19-98.
Allendorf FW and Luikart G (2007) Conservation and the Genet-ics of Populations. Blackwell Publishing, Malden, 642 pp. Almeida FS and Sodré LMK (1998) Analysis of genetic
variabil-ity in three species of Pimelodidae (Ostariophysi, Siluri-formes). Genet Mol Biol 21:487-492.
Almeida FS, Sodré LM and Contel EPB (2003) Population struc-ture analysis ofPimelodus maculatus(Pisces, Siluriformes) from the Tietê and Paranapanema Rivers (Brazil). Genet Mol Biol 26:301-305.
Avise JC and Felley J (1979) Population structure or freshwater fishes. I. Genetic variation of bluegill (Lepomis macro-chirus) populations in man-made reservoirs. Evolution 33:15-26.
Balloux F and Lugon-Moulin N (2002) The estimation of popula-tion differentiapopula-tion with microsatellite markers. Mol Ecol 11:155-165.
Barletta M, Jaureguizar AJ, Baiguns C, Fontoura NF, Agostinho AA, Almeida-Val MF, Val AL, Torres RA, Jimenes-Segura LF, Giarrizzo T,et al.(2010) Fish and aquatic habitat con-servation in South America: A continental overview with emphasis on neotropical systems. J Fish Biol 76:2118-2176. Barthem RB, Ribeiro MB and Petrere M (1991) Life strategies of
some long-distance migratory catsh in relation to hydroelec-tric dams in the Amazon Basin. Biol Conserv 55:339-345. Barton NH and Slatkin M (1986) A quasi-equilibrium theory of
the distribution of rare alleles in a subdivided population. Heredity 56:409-416.
Benke AC (1990) A perspective on America’s vanishing streams. J N Am Benthol Soc 9:77-88.
Bird CE, Karl SA, Smouse PE and Toonen RJ (2011) Detecting and measuring genetic differentiation. Crust Issues 19:31-39.
Calcagnotto D and DeSalle R (2009) Population genetic structur-ing in pacu (Piaractus mesopotamicus) across the Paraná-Paraguay basin: Evidence from microsatellites. Neotrop Ichthyol 7:607-616.
Callen DF, Thompson AD, Shen Y, Phillipis HA, Richards RI, Mulley JC and Sutherland GR (1993) Incidence and origin of “null” alleles in the (AC)nmicrosatellite markers. Am J Hum Genet 52:922-927.
Coleman RA, Pettigrove V, Raadik TA, Hoffman AA, Miller AD and Carew ME (2010) Microsatellite markers and mtDNA data indicate two distinct groups in dwarf galaxias, Galaxiella pusilla(Mack) (Pisces, Galaxiidae), a threatened freshwater fish from south-eastern Australia. Conserv Genet 11:1911-1928.
Crawford NG (2010) SMOGD: Software for the measurement of genetic diversity. Mol Ecol Res 10:556-557.
Creste S, Tulmann Neto A and Figueira A (2001) Detection of sin-gle sequence repeat polymorphisms in denaturing polyacryl-amide sequencing gels by silver staining. Plant Mol Biol Rep 19:299-306.
Dakin EE and Avise JC (2004) Microsatellite null alleles in par-entage analysis. Heredity 93:504-509.
Dehais C, Eudeline R, Berrebi P and Argillier C (2010) Micro-geographic genetic isolation in chub (Cyprinidae,Squalius cephalus) population of the Durance River: Estimating frag-mentation by dams. Ecol Fresh Fish 19:267-278.
DeWoody JA and Avise JC (2000) Microsatellite variation in ma-rine, freshwater and anadromous fishes compared with other animals. J Fish Biol 56:461-473.
Dudgeon D, Arthington AH, Gessner MO, Kawabata Z, Knowler DJ, Lévêque C, Naiman RJ, Prieur-Richard AH, Soto D, Stiannsy ML,et al.(2006) Freshwater biodiversity: Impor-tance, threats, status and conservation challenges. Biol Rev 81:163-182.
Dupanloup I, Schneider S and Excoffier L (2002) A simulated an-nealing approach to define the genetic structure of popula-tions. Mol Ecol 11:2571-2581.
Dynesius M and Nilsson C (1994) Fragmentation and flow regula-tion of river systems in the northern third of the world. Sci-ence266:753-762.
Eletrosul/CNEC (1990) Relatório de Impacto Ambiental da Usina Hidrelétrica de Itá – Versão sintética. Eletrosul/CNEC, Flo-rianópolis, 102 pp.
hybridiza-tion on the genetic structure of redband trout in the Upper Snake River Basin. Ecol Evol 140:282-295.
Esguícero ALH and Arcifa MS (2010) Fragmentation of a Neo-tropical migratory fish population by a century-old dam. Hydrobiology 638:41-53.
Evanno G, Regnaut S and Goudet J (2005) Detecting the number of clusters of individuals using the software STRUCTURE: A simulation study. Mol Ecol 14:2611-2620.
Excoffier L, Laval G and Schneider S (2005) Arlequin ver. 3.11: An integrated software package for population genetics data analysis. Evol Bioinf 1:47-50.
Fabry VJ, Seibel BA, Feely RA and Orr JC (2008) Impacts of ocean acidification on marine fauna and ecosystem pro-cesses. ICES J Mar Sci 65:414-432.
Falconer DS (1989) Introduction to Quantitative Genetics. 3rd edition. Longman, New York, 438 pp.
Frankham R, Ballou JD and Briscoe DA (2002) Introduction to Conservation Genetics. Cambridge University Press, Cam-bridge, 617 pp.
Garcez R, Calcagnotto D and Almeida-Toledo LF (2011) Popula-tion structure of the migratory fish Prochilodus lineatus (Characiformes) from Rio Grande basin (Brazil), an area fragmented by dams. Aquat Conservat Mar Freshwat Ecosyst 21:268-275.
Godinho AL, Kynard B and Godinho HP (2007) Migration and spawning of female surubim (Pseudoplatystoma corruscans, pimelodidae) in the São Francisco River, Brazil. Environ Biol Fish 80:421-433.
Hansen MM and Mensberg KD (1998) Genetic differentiation and relationship between genetic and geographical distance in Danish sea trout (Salmo truttaL.) populations. Heredity 81:493-504.
Hedrick PW (2005) A standardized genetic differentiation mea-sure. Evolution 59:1633-1638.
Heggenes J and Røed KH (2006) Do dams increase genetic diver-sity in brown trout (Salmo trutta)? Microgeographic differ-entiation in a fragmented river. Ecol Fresh Fish 15:366-375. Helfman GS (2007) Fish Conservation: A Guide to
Understand-ing and RestorUnderstand-ing Global Aquatic Biodiversity and Fishery Resources. Island Press, Washington (DC) Island Press, 140 pp.
Heller R and Siegismund HR (2009) Relationship between three measures of genetic differentiationGST,DESTandG‘ST: How wrong have we been? Mol Ecol 18:2080-2083.
Holderegger R and Wagner HH (2006) A brief guide to landscape genetics. Lands Ecol 21:793-796.
Hugueny B, Movellan A and Belliard J (2011) Habitat fragmenta-tion and extincfragmenta-tion rates within freshwater fish communi-ties: A faunal relaxation approach. Glob Ecol Biogeogr 20:449-463.
Iervolino F, Resende EK and Hilsdorf (2010) The lack of genetic differentiation of pacu (Piaractus mesopotamicus) popula-tions in the Upper-Paraguay Basin revealed by the mito-chondrial DNA D-loop region: Implications for fishery management. Fish Res 101:27-31.
Jost L (2008) GSTand its relatives do not measure differentiation. Mol Ecol 17:4015-4026.
Martins C, Wasko AP, Oliveira C and Foresti F (2003) Mitochon-drial DNA variation in wild populations of Leporinus elongatus from the Paraná river basin. Genet Mol Biol 26:33-38.
McGlashan DJ and Hughes JM (2000) Reconciling patterns of ge-netic variation with stream structure, earth history and biol-ogy in the Australian freshwater fish Craterocephalus stercusmuscarum(Atherinidae). Mol Ecol 9:1737-1751. Nei M (1987) Molecular Evolutionary Genetics. Columbia
Uni-versity Press, New York, 512 pp.
Neraas LP and Spruell P (2001) Fragmentation of riverine sys-tems: The genetic effects of dams on bull trout (Salvelinus confluentus) in the Clark Fork River system. Mol Ecol 10:1153-1164.
O’Connell M and Wright JM (1997) Microsatellite DNA in fishes. Rev Fish Biol Fish 7:331-363.
Oliveira C, Foresti F and Hilsdorf AWS (2009) Genetics of neo-tropical fish: From chromosomes to populations. Fish Phy-siol Biochem 35:81-100.
Oosterhout CV, Hutchinson WF, Wills DPM and Shipley P (2004) Micro-Checker: Software for identifying and cor-recting genotyping errors in microsatellite data. Mol Ecol Notes 4:535-538.
Paiva ALB and Kalapothakis E (2008) Isolation and characteriza-tion of microsatellite loci inPimelodus maculatus (Siluri-formes, Pimelodidae). Mol Ecol Res 8:1078-1080. Pamponet VCC, Carneiro PLS, Affonso PRAM, Miranda VS,
Silva Jr JC, Oliveira CG and Gaiotto FA (2008) A multi-approach analysis of the genetic diversity in populations of Astyanax aff. bimaculatus Linnaeus, 1758 (Teleostei, Characidae) from northeastern Brazil. Neotrop Ichthyol 6:621-630.
Peakall R and Smouse PE (2006) GENALEX 6: Genetic analysis in Excel. Population genetic software for teaching and re-search. Mol Ecol Notes 6:288-295.
Pereira LHG, Foresti F and Oliveira C (2009) Genetic structure of the migratory catfishPseudoplatystoma corruscans (Silu-riformes, Pimelodidae) suggests homing behavior. Ecol Fresh Fish 18:215-225.
Pinna MCC (1998) Phylogenetic relationships of Neotropical Siluriformes (Teleostei, Ostariophysi): Historical overview and synthesis of hypotheses. In: Malabarba LR, Reis RE, Vari RP, Lucena CAS and Lucena ZMS (eds) Phylogeny and Classification of Neotropical Fishes. Edipucrs, Porto Alegre, pp 279-330.
Piorski NM, Sanches A, Carrillo-Avila M, Carvalho-Costa LF, Hatanaka T, Freitas PD and Galetti Jr PM (2008) Contribu-tion of conservaContribu-tion genetics in assessing neotropical fresh-water fish biodiversity. Braz J Biol 68:1039-1050.
Pringle CM, Freeman MC and Freeman BJ (2000) Regional ef-fects of hydrologic alterations on riverine macrobiota in the New World: Tropical-temperate comparisons. Bioscience 50:807-823.
Pritchard JK, Stephens M and Donnelly P (2000) Inference of population structure using multilocus genotype data. Genet-ics 155:945-959.
Ramella MS, Kroth MA, Meurer S, Nuñer APO, Zaniboni-Filho E and Arisi ACM (2006) Genetic variability in four fish spe-cies (Pimelodus maculatus,Prochilodus lineatus,Salminus brasiliensis andSteindachneridion scripta) from Uruguay River Basin. Braz Arch Biol Technol 49:589-598.
Santos MCF, Ruffino ML and Farias IP (2007) High levels of ge-netic variability and panmixia of the tambaquiColossoma macropomum(Cuvier, 1816) in the main channel of the Am-azon River. J Fish Biol 71:33-44.
Sivasundar A, Bermingham E and Orti G (2001) Population struc-ture and biogeography of migratory freshwater fishes (Prochilodus, Characiformes) in major South American rivers. Mol Ecol 10:407-417.
Slatkin M (1995) A measure of population subdivision based on microsatellite allele frequencies. Genetics 139:457-462. Spieth PT (1974) Gene flow and genetic differentiation. Genetics
78:961-965.
Templeton AR (2001) Using phylogeographic analyses of gene trees to test species status and processes. Mol Ecol 10:779-791.
Tuomainen U and Candolin U (2011) Behavioural responses to human-induced environmental change. Biol Rev 86:640-657.
Turner TF, McPhee MV, Campbell P and Winemiller KO (2004) Phylogeography and intraspecific genetic variation of pro-chilodontid fishes endemic to rivers of northern South America. J Fish Biol 64:186-201.
Vergara J, Azpelicueta M and Garcia G (2008) Phylogeography of the Neotropical catfish Pimelodus albicans(Siluriformes, Pimelodidae) from Rio de la Plata basin, South America, and conservation remarks. Neotrop Ichthyol 6:75-85. Waples RS and Gaggiotti OE (2006) What is a population? An
empirical evaluation of some genetic methods for identify-ing the number of gene pools and their degree of connectiv-ity. Mol Ecol 15:1419-1439.
Ward RD, Woodwark M and Skibinski DOF (1994) A compari-son of genetic diversity levels in marine, freshwater and ana-dromous fishes. J Fish Biol 44:213-232.
Weir BS and Cockerham CC (1984) Estimating F-Statistics for the analysis of population structure. Evolution 38:1358-1370.
Wollebaek J, Heggenes J and Roed KH (2011) Population con-nectivity: Dam migration mitigations and contemporary site fidelity in Arctic char. BMC Evol Biol 11:207.
Wu C and Drummond A (2011) Joint inference of microsatellite mutation models, population history and genealogies using transdimensional MCMC. Genetics 188:151-164.
Yamamoto S, Morita K, Koizumi I and Maekawa K (2004) Ge-netic differentiation of white-spotted charr (Salvelinus leucomaenis) populations after habitat fragmentation: Spa-tial-temporal changes of gene frequencies. Conserv Genet 5:529-538.
Zaniboni-Filho E and Schulz UH (2003) Migratory fishes of the Uruguay River. In: Carolsfeld J, Harvey B, Ross C and Baer A (eds) Migratory Fishes of South America – Biology, Fish-eries and Conservation Status. IDRC, Ottawa, pp 157-194.
Internet Resources
ANEEL - Agencia Nacional de Energia Elétrica (2012) Banco de Informações de Geração - Capacidade de Geração do Brasil. http://www.aneel.gov.br/ (March 9, 2012).
Goudet J (2002) FSTAT: A program to estimate and test gene di-versities and fixation indices, ver. 2.9.3.2. University of Lausanne, Department of Ecology and Evolution, Lausanne. http://www2.unil.ch/popgen/softwares/fstat.htm (June 2, 2011).
Associate Editor: Fausto Foresti