w w w . s b f g n o s i a . o r g . b r / r e v i s t a
Original
Article
In
vivo
potential
hypoglycemic
and
in
vitro
vasorelaxant
effects
of
Cecropia
glaziovii
standardized
extracts
Daniela
Paula
Arend
a,
Talitha
Caldas
dos
Santos
a,
Luisa
Helena
Cazarolli
d,
Mariana
Appel
Hort
c,
Diva
Sonaglio
a,
Ana
Lúcia
Gomes
dos
Santos
a,
Rosa
Maria
Ribeiro-do-Valle
c,
Fátima
Regina
Mena
Barreto
Silva
b,
Angela
Machado
de
Campos
a,∗aDepartamentodeCiênciasFarmacêuticas,LaboratóriodeFarmacotécnica,CentrodeCiênciasdaSaúde,UniversidadeFederaldeSantaCatarina,Florianópolis,SC,Brazil bDepartamentodeBioquímica,LaboratóriodeHormônioseTransduc¸ãodeSinais,CentrodeCiênciasBiológicas,UniversidadeFederaldeSantaCatarina,Florianópolis,SC,Brazil cLaboratóriodeFarmacologiadeProdutosNaturais,DepartamentodeFarmacologiaCentrodeCiênciasBiológicas,UniversidadeFederaldeSantaCatarina,Florianópolis,SC,Brazil dUniversidadeFederaldaFronteiraSul,CampusUniversitárioLaranjeirasdoSul,LaranjeirasdoSul,PR,Brazil
a
r
t
i
c
l
e
i
n
f
o
Articlehistory:
Received19November2014 Accepted25May2015 Availableonline3July2015
Keywords: Cecropiaglaziovii Decoction Maceration Totalphenolic
Antihyperglycemicactivity Vasorelaxantactivity
a
b
s
t
r
a
c
t
TheaimofthisstudyistoinvestigatetheeffectofCecropiaglazioviiSnethl,Urticaceae,extractsonthe
oralglucosetolerancecurve,onglycemiainalloxan-induceddiabeticratsandvasorelaxanteffectafter
theextractionprocess,andtostandardizetheextractivesolutions.Theeffectsoftheprocessvariables
andtheirinteractionswerecalculatedinrelationtodryresidue,pH,totalphenolicresultsandchemical
markercontent.Furthermore,theeffectoftheextracts(400mg/kg),chlorogenic(2or15mg/kg)and
caffeicacids(2mg/kg)wereinvestigatedontheoralglucosetolerancecurveandonglycemiain
alloxan-induceddiabeticrats.Oraladministrationofethanolextracts4d20and8d20significantlyimproved
glucosetoleranceinthehyperglycemicrats.Chlorogenicandcaffeicacids,aswellastheassociationof
thecompoundswereabletosignificantlyreduceglycemiaafteroralgavagetreatments.Ontheother
hand,theaqueousextractsdidnotaltertheglycemia.Theaqueousextracts(8020and9030)andonly
thehigherdoseofchlorogenicacidpresentedasignificanteffectonserumglucoseloweringindiabetic
rats.Additionally,theIC50revealsthattheethanolextractspresentedmorepotentvasodilatoreffects
thantheaqueousextractsinaorticrings.ThisstudyshowsthatC.glazioviistandardizedextractsexhibits
antihyperglycemicaction,isabletoimproveglucosetoleranceandhasapotentvascularrelaxingeffect.
Theseresultsareprobablylinkedtoconcentrationsofthemainphenoliccompoundsoftheextracts.
©2015SociedadeBrasileiradeFarmacognosia.PublishedbyElsevierEditoraLtda.Allrightsreserved.
Introduction
LeavesofCecropiaglazioviiSnethl,Urticaceae,areusedinthe
traditionalmedicine,mainlyintheformoftea.Pharmacological
studieshaveshownthatextractivesolutionsofthisspeciesproduce
anxiolytic(Rochaetal.,2002),hypotensive(Lima-Landmanetal.,
2007),antiasthmatic(Delarcinaetal.,2007),antidepressant(Rocha
etal.,2007),antacid,antiulcer(Souccaretal.,2008)effects,aswell
asinvitroantiviraleffectsagainsthumanherpesvirustypes1and
2(Silvaetal.,2010).
SomeCecropiaspeciesare usedinpopularmedicinetotreat
diabetes and hypoglycemic effects have been reported for the
extractive solutions of Cecropia obtusifolia Bertol., Urticaceaae,
Cecropia peltata L., Urticaceae (Andrade-Cetto and Wiedenfeld,
∗ Correspondingauthor.
E-mail:angela.campos@ufsc.br(A.M.deCampos).
2001;Nicasioetal.,2005;Andrade-Cettoetal.,2007;Alonso-Castro etal.,2008;Andrade-CettoandVázquez,2010)andalsoCecropia pachystachyaTrécul.,Urticaceae(Aragãoetal.,2010).Basedonthe
hypoglycemicpotentialdescribedtoCecropiaspeciesand
consid-eringthattherearenostudiesonthehypoglycemiceffectofC.
glaziovii,thepresentstudysoughttoevaluatetheeffectofextracts
preparedfromC.glazioviileavesonoralglucosetolerancecurve
andonglycemiainalloxan-induceddiabeticrats.
Inthepreparationoftheextractivesolutions,theapplicability
ofthemacerationanddecoctionmethodswasdeterminedfor
opti-mizingtheextractionconditionsofphenolicacidssubstancesfrom
C.glazioviileaves.Someextractionparameterswereanalyzedusing
anexperimentaldesign.Thisworkthereforedeterminesthemost
appropriateextractionmethod,andthebestconditionsfor
pro-motinganextractionwiththehighestcontentsofchemicalmarkers
(chlorogenicandcaffeicacids).Chlorogenic(CGA)andcaffeic(CFA)
acidswereusedaschemicalmarkersforstandardizationdueto
highconcentrationpresentintheextractsandalsotoberelatedto
http://dx.doi.org/10.1016/j.bjp.2015.05.010
thehypoglycemic/antihyperglycemiceffectsintheliterature(Hsu etal.,2000;RodriguezdeSotilloandHadley,2002;Jungetal.,2006; Gentaetal.,2010).Theseinitialresultscanbeusedtoguidefurther
standardizationand applicationofC.glazioviileafextractinthe
developmentofphytopharmaceuticalpreparations.
Materialsandmethods
Materials
Chemicalsandreagentswereobtainedfromthefollowing
com-mercialsources:chlorogenicacidandcaffeicacid(Sigma–Aldrich,
St.Louis,MO,USA),Folin–Ciocalteu(Fluka,Sigma–Aldrich,St.Louis,
MO,USA),methanolandacetonitrile(HPLCgrade)werepurchased
fromJ.T.Baker (Phillipsburg, NJ,USA), aceticacid(Qhemis, São
Paulo,Brazil),LC-gradewaterobtainedinMilli-Qsystem(Millipore,
Bedford,MA,USA).Allsamplesandsolutionswerepreparedfrom
bidistilledwater.Allotherreagentsandsolventswereofanalytical
grade.
Rawmaterialcharacterization:plantmaterial
TheleavesofCecropiaglazioviiSnethl,Urticaceae,werecollected
bytheÍlioMontanariJr.researcheratPluridisciplinaryCenterof
Chemical,BiologicalandAgronomicStudies(CPQBA)ofthe
Uni-versityofCampinas,SP,Brazil.Aspecimenvoucherisdeposited
attheCPQBAherbarium(number78).Thedryleaveswereground
inaknifemill(Macmont)usinga3mmmesh.Themilledvegetal
materialwascharacterizedbytotalashcontent,lossondrying,
par-ticlesizedistributionandmicrobiologicalqualityoftherawplant,
asdescribedbelow.
Totalashcontent(TA)
Thetotalashcontentwasdeterminedafterbummingthemilled
leaves.Theprocedurewasdonegravimetricallybyweighing3.0g
ofmilledleavesinaporcelaincrucible.Thesampleswere
submit-tedtocalcinationinanovenat600◦C for2h. Theresultswere
expressedaspercentageofremainingweight(w/w)bythemean
ofthreemeasurements(FarmacopéiaBrasileira,2010).
Lossondrying(LOD)
Thelossondryinganalysiswascarriedouttodeterminethe
amountofwaterandvolatilematterintheplantdrugmaterial.The
LODwasdeterminedgravimetricallybyweighing2.0gofmilled
leavesinaweighingbottleandsubmittingthesamplestoaheated
stoveat105◦Cfor2h.Theprocedurewasrepeateduntilconstant
weightwasachieved(variation<5mg).Theresultswereexpressed
aspercentageofweightlost(w/w)bythemeanofthree
measure-ments(FarmacopéiaBrasileira,2010).
Particlesizedistribution
Particlesizedistributionwasevaluatedbyastandardsieving
method,fora periodof15min(SieveShakerBertel1400),with
30gof thedried milledplantmaterial, usinga series ofsieves
withscreensizescorrespondingto180,355,500,710,1000and
1700m. Theaverageparticlesizewascalculated bymeansof
Probito’sevaluation(Vila-Jato,1997;Pasqualotoetal.,2005).
Assessmentofmicrobiologicalqualityofrawplant
Thetotalviableaerobiccountoftheplantmaterialwas
deter-mined,asspecifiedinthetestprocedurebelow,usingtheplate
countmethod.Aerobicbacteriaandfungi(moldsandyeasts)were
determinedinthistest.
Pretreatmentofthetestplantmaterial
Plantmaterial(10g)wasdilutedinphosphatebufferpH7.2,
totalvolumeadjustedto100ml.Thetreatedsampleresultedina
dilutionof10−1.
Totalviableaerobiccount
Todeterminethetotalbacteria,thepre-treatedherbal
mate-rialwaspreparedinduplicateusingdecimaldilutionuntil10−9
dilution.Sampleswereincubatedat30–35◦Cfor7daysinnutrient
agar.Similarly,forfungi,pre-treatedplantmaterialwaspreparedin
duplicateusingdecimaldilutionuntil10−9dilution.Sampleswere
incubatedat20–25◦Cfor7daysinSabouraudagar(WHO,1998).
Extractpreparation:experimentaldesign
Twofullfactorialscreeningdesigns(22)waschosento
investi-gatetheeffectsoftheextractionconditionsinthetwoextraction
methods:macerationand decoction. Inthe case ofmaceration,
theindependentvariableswereethanolconcentration(20,50and
80%;v/v)(factorA)andextractiontime(4,6and8days)(factor
B),whileforthedecoctionmethodthevariableswere
tempera-ture(70,80and90◦C)(factorA)andextractiontime(10,20and
30min)(factorB).Alldataaregivenasmeans±standard
devia-tionsoftwoindependentbatches.Onecentralpointwasproposed
ineachdesignandtheseexperimentswereperformedin
dupli-cate. The effects ofthe process variables and theirinteractions
onthedryresidue,pH,totalphenolicandchemicalmarker
con-tent(CGA andCFA)werecalculatedasthedifferences between
themeansonthehighandthelowlevels,respectively.The
sig-nificanceoftheeffectswasevaluatedbycomparingtheirvalues
totheconfidence intervals basedonthe meanstandard
devia-tionfor the respectiveresponse variables (Montgomery,2005).
Theexperimentswerecarriedoutrandomlyandtheeffectswere
calculatedpresumingalinearmodelwithinteractionamongthe
factors.Theestablishedscreeningdesignandtheresultswere
ana-lyzed by Design-Expert® software (Version 8.0.6, StatEase, and
Minneapolis,MN).Theeffectsofeachfactortestedinthese
exper-imentsweredemonstratedusinganalysisofvariance(regression
coefficientsandsignificantpvalues)andParetochart,whichwere
ausefultoolforshowingthestatisticallysignificanteffects
eval-uatedinstudy.ThefunctionoftheParetochartistoprovidean
additionalchartusedtodisplaythet-valuesoftheeffects.Another
useoftheParetochartis tocheck“onemoresignificanteffect”
thatwasnoteasilyvisibleintheotherchart.Analysisofvariance
(ANOVA)wasperformedtoidentifythesignificanceofsingle
fac-torsand theirbinaryinteractionsin termsoftheirinfluenceon
theresponsesanalyzed(significantwhenthepvalue<0.05).The
interactiontermsthatwerenotsignificantwereremovedfromthe
model.
Characterizationoftheextractivesolutions(ethanolandaqueous extracts)
Determinationofdryresidue
Thedryresiduewasdeterminedbydrying20gofeach
extrac-tivesolutioninanovenat105◦Cfor2h.Aftercompletedrying,
theresidualsolidmatterwasweighedandthedryresidue was
expressedasapercentage(w/w)bythemeanofthree
Totalphenoliccontent(TPC)
Percentages of total phenolic of the ethanol and aqueous
extractsweredeterminedaccordingtothemethodreportedbyYu
etal.(2002).Briefly,thereactionmixturecontainedextractive
solu-tion(10lofethanolextractor20laqueousextract),500lofthe
Folin–Ciocalteureagent,and1.5mlof20%sodiumcarbonate.The
finalvolumewasmadeupto10mlwithpurifiedwater.After2hof
reaction,theabsorbanceat765nmwasmeasuredandusedto
cal-culatethephenoliccontentsusinggallicacidasstandard.Triplicate
reactionswereconducted.
QuantitativeanalysisofCGAandCFA(HPLC)
Thechlorogenic(CGA)and caffeic(CFA)acidscontentinthe
extractivesolutionsweredeterminedbyHPLCanalysisusinga
pre-viouslyvalidatedmethod(Arendetal.,2011)onaPerkin-Elmer
apparatusequippedwithanautosamplerSeries200,interface600
SeriesLINK,binarypumpSeries200,UV-VisdetectorSeries200,
andvacuumdegasserSeries200.AZorbaxCHPC18column(5mm,
150mm×4.6mm,AgilentTechnologies)wasused.Thegradientof
elutionconsistedofacetonitrile(A)1.0%aceticacid(B)withaflow
rateof1ml/min,andwasprogrammedasfollows:0–15min,87%
B;15–25min,87–60%B;25–34min,60%B.Detectionwassetat
330nm.Theinjectionvolumewas20l.
Thequantificationofchemicalmarkers,CGAandCFAwas
car-riedoutbycomparisonoftheirretentiontimesandco-injectionof
standardsolutions.Twostandardcurveswereplotted:chlorogenic
acid(2.5–200g/ml)andcaffeicacid(2.5–100g/ml).
Quantifica-tionoftheindividualcompoundswasperformedusingavalidated
regressioncurve(r>0.9999).Threemillilitersofeach extractive
solutionsweredilutedto10mlusingamethanol:watersolution
(50:50;v/v).Thesampleswerefilteredthrougha0.45mmHVLP
membrane(Millipore)beforeinjection.
Vascularreactivityinthoracicrataorta
Pharmacological studiesrelatedtohypotensive activityhave
alreadybeendescribedforthisplant(Lima-Landmanetal.,2007;
Ninahuamanetal.,2007).Inanattempttoevaluatethepotency
ofthese extractivesolutions, thepotentialcardiovasculareffect
wasdemonstratedthroughvascularreactivityinthoracicrataorta
followingthestepsbelow.
Animals
Male Wistar rats (250–300g) were maintained in a 12h
light/darkcyclewithfreeaccesstowaterandstandardratchow.On
thedayoftheexperiments,ratswereeuthanizedunder
anesthe-siawithamixtureofketamine(80mg/kg)andxylasine(15mg/kg)
given intraperitoniallyand theaortawasremoved.The
experi-mentswereperformedafterapprovaloftheprotocolbythelocal
ethicalcommitteeforanimaluse(ProtocolCEUA/UFSCPP00482).
Tissuepreparation
The thoracic aorta was isolated as described previously by
Andriambelosonetal.(1999).Inbrief,afterremovaloffatand
con-nectivetissue,aorticrings(3–4mminlength)weremountedinan
isolatedorganbathonisometricforcetransducersconnectedtoan
amplifierandchartrecorder(SoftandSolutions/KITCAD8,Brazil)
forisometrictensionrecordingsasdescribedelsewhere.Therings
werebathedwithphysiologicalsalt solutionwiththefollowing
compositioninmM:130.0NaCl,4.7KCl,1.2KH2PO4,1.2MgSO4,1.6
CaCl2,14.9NaHCO3,0.03EDTAand5.5glucose,maintainedat37◦C
andbubbledwith95%O2–5%CO2.Theaorticringswerestretched
applyingtensionof1gappliedfor1hwithperiodicalwashesevery
15min.Afterthisperiod,theringswerecontractedwith
phenyle-phrine(1M)andchallengedwithacetylcholine(1M)totestthe
tissueviabilityandintegrityoftheendothelium,respectively.
Evaluationofthevasorelaxanteffect
Endothelium-intactaorticringswerecontractedwith
phenyle-phrine(1M)untilthe plateauofthecontractionwasreached
(around15min)andthenexposedtoincreasingconcentrationsof
theextractivesolutions(0.1–100g/ml)givenat5minintervals.A
concentration–responsecurveofacetylcholine-induced
vasodila-tation(1nMto3M)wasusedasapositivecontrol.Theresults
wereexpressedasmean±standard errorof themean (SEM)of
percentageofrelaxation.Statisticalcomparisonsbetweengroups
werecarriedoutusingone-wayanalysisofvariance(ANOVA)
fol-lowedbytheTukeytest.Theresultswerealsoexpressedasthe
geometricmean(IC50)values,accompaniedbytheirrespective95%
confidencelimits.
Antihyperglycemicactivity
Fastedratsforantihyperglycemicactivitymeasurements,from
thesameanimal facility,weredeprivedoffoodforatleast16h
butallowedfreeaccesstowater.Alltheanimalsweremonitored
andmaintainedinaccordancewiththelocalethicalcommitteefor
animaluse(ProtocolCEUA/UFSCPP00223).
Oralglucosetolerancecurve
Animals were divided into groups of five animals for each
treatment: hyperglycemic group: fasted rats that received
glu-cose(4g/kg;8.9M);hyperglycemictreatedgroup:fastedratsthat
receivedglucose(4g/kg)plusdifferentethanoloraqueousextracts
(400mg/kg)ortolbutamide(100mg/kg)orchemicalmarkeralone,
chlorogenicacid(CGA2or15mg/kg)orcaffeicacid(CFAatadoseof
2mg/kg)orincombination(CGAplusCFAatadoseof2mg/kg).All
treatmentswerecarriedoutbyoralgavage.Bloodsampleswere
collectedjustpriortoandat0,15,30,60and180minafterthe
glucose loading.Aftercentrifugation, serum wasusedto
deter-minetheglycemiabytheglucoseoxidasemethod(Foladoretal.,
2010).Datawereexpressedasmean±S.E.M.One-wayanalysisof
variance(ANOVA),followedbytheBonferronipost-testor
non-pairedStudent’sttest,wasusedtoidentifysignificantlydifferent
groups.Differenceswereconsideredtobesignificantatthep≤0.05
level.
Diabeticanimals
Ratsweremadediabeticbya singleintravenousinjectionof
alloxanmonohydrate5%(w/v) ina salinesolutionat adoseof
40mg/kgbodyweight.Bloodsampleswerecollected3dayslater,
andglucoselevelsweredeterminedasindicativeofthe
develop-mentofdiabetes.Diabeticratsreceivedethanoloraqueousextracts
(400mg/kg)orchemicalmarkeralone,chlorogenicacid(CGA2or
15mg/kg)orcaffeicacid(CFAatdose2mg/kg)orincombination
(CGAplusCFAatdose2mg/kg).Bloodsamplesfromthetailvein
werecollectedandcentrifugedandtheserumwasusedto
deter-minetheglycemiabytheglucoseoxidasemethod.Aserumglucose
rangeof22–29mmol/lwasusedfortheexperiment(Foladoretal.,
2010).
Determinationoftheserumglucoseconcentration
Bloodsampleswerecollectedandcentrifuged,andtheblood
glucoselevelsweredetermined bytheglucoseoxidasemethod
Table1
Dryresidue,pH,totalphenoliccontent,andCGAandCFAcontentsforthemacerationextractionmethod.
Extractivesolution Ethanol(%) Time(days) Dryresidue(%) pH Totalphenolic(mg/ml) CGA(g/ml) CFA(g/ml)
4d20 20 4 1.06 5.78 3.64 131.09 36.93
4d20 20 4 1.05 5.81 3.96 128.81 36.67
4d80 80 4 1.02 5.88 3.48 150.99 3.25
4d80 80 4 1.01 5.88 3.37 150.69 3.27
8d20 20 8 1.14 5.79 3.95 73.36 58.35
8d20 20 8 1.10 5.83 3.69 75.62 57.61
8d80 80 8 1.06 5.90 3.47 154.80 3.78
8d80 80 8 1.05 5.93 3.43 153.99 3.67
6d50 50 6 1.08 5.92 3.88 167.11 11.94
6d50 50 6 1.07 5.96 3.89 167.65 12.18
Resultsanddiscussion
Rawmaterialcharacterization
Plantsarecomplexmixturesthatpresentaprobleminterms ofstandardizationandqualitycontrol.Therefore,protocolswere developedfromtherawmaterialtoestablishtheirprevious treat-mentandqualitycontrolinordertocharacterizethemproperly. Determinationofthetotal ashcontentisparticularlyimportant forevaluatingthecleanlinessoftheplantmaterial,forexample, thepresenceorabsenceofinorganicmattersuchassandanddirt adheredtothesurfaceofthedrug(Jainetal.,2010).Similarly,the
presenceofwatercanpromotedegradationreactionsand
prolif-erationofmicroorganisms.Thiscontaminationcompromisesthe
integrityofpharmacologicallyactivesubstances.Totalashcontent
andlossondryingoftheplantdrugweredeterminedbythe
pro-ceduresgivenintheBrazilianPharmacopoeia(2010).Theresults
were7.92±0.03%and13.10±0.06%,respectively.Themean
diam-eterofthecrushedleaveswasdeterminedas0.78±0.41mm.This
informationisimportantforstandardizingthereproducibilityof
theextractionprocess,a homogenoussamplemighttoimprove
thekineticsofthechemicalcompoundextraction.
Thepresenceofmicroorganismscanbeanaturalconsequenceof
theagriculturalpracticesandprocessingconditionsofplant
mate-rials(Kolb,1999).Thus,rawmaterialplantmaybeassociatedwith
abroadvarietyofmicrobialcontaminants,andthismicrobiological
backgroundhasanimportantimpactontheresultsofqualitative
andquantitativeanalysescarriedoutforqualitycontrol(Wolfgang
etal.,2002;Kosalecetal.,2009).Theresultsofthestandard
aer-obicbacteriacountwere1.04×103UFC/ml,moreover,themean
valuesformoldandyeastwerefrom8.25×104UFC/ml.Therefore,
therawmaterialdidnotexceedthevaluerecommendedbythe
WHO(1998).Thedataobtainedsuggestthattherawmaterialwas
characterizedanddeemedappropriateforcontinuingstudies.
Preparationandstandardizationofextractivesolutions
Inthestandardizationofherbalpreparationsvariousaspectsof
analysismustbeperformed,requiringtheuseofscientificproof
and clinicalvalidationwithchemical standardization,biological
assaysandclinicaltrials(Ong,2004).Thechoiceofthetechnique
for theextractionplantmaterial is themost importantstep in
thedevelopmentofanalyticalmethods(Benthinetal.,1999;Ong,
2004),particularlyconsideringthat herbalextractsarecomplex
mixtures,andappropriatetechniquesareneededtoallowa
bet-terextractionoftheirconstituentsofinterest(Jacquesetal.,2007).
Decoctionandmacerationmethodswereinvestigatedasan
alter-nativetotraditionalextractionmethodsusedintheextractionof
chemicalmarkers(CGAandCFA),searchingforimproved
extrac-tionefficiency.TheconditionsfortheextractionofC.glazioviiusing
macerationanddecoctionmethodswereevaluatedondryresidue,
totalphenolicvaluesandCGAandCFAacidscontent.Tables1and2
showtheresultsoftheexperimentaldesignsusedforthe
macera-tionanddecoctiontechniques,respectively.
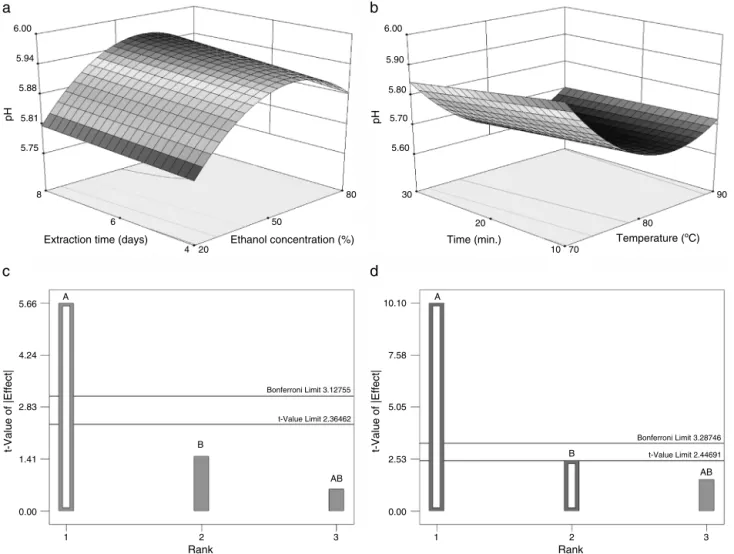
Dryresidue
Intheethanol extractsobtainedbymaceration, bothfactors
–ethanolconcentration(factorA)andextractiontime(factorB)
–weresignificant(Table3;Fig.1c).Increasingthepercentageof
ethanolcausesadecreaseofdryresidue.Ontheotherhand,the
increaseinextractiontimeresultedinanincreasedamountofdry
residue(Fig.1a).
In the case of the aqueous extracts obtained by decoction,
onlythefactortemperaturewassignificant(Table4;Fig.1d).The
increaseintemperaturecausedanincreaseindryresidue.Inthe
decoctionmethod,significantcurvaturewasobserved,indicating
thereisnolinearityforthedryresidueresponse,asshowninFig.1b.
pH
The pH values for the ethanol extracts were in the range
5.78–5.96.Intheextractsobtainedbymaceration,onlythefactor
ethanolconcentrationwassignificant(Table3;Fig.2c).Lowering
theethanol concentrationalsoloweredthepH values(Fig.2a).
Thesameoccurredwithincreasingtemperaturefortheaqueous
extracts(Table4;Fig.2bandd),whichseemstoindicatethe
extrac-tionofsubstanceswithacidiccharacterinthoseconditions.The
Table2
Dryresidue,pH,totalphenoliccontent,andCGAandCFAcontentsforthedecoctionextractionmethod.
Extractivesolution Temperature(◦C) Time(min) Dryresidue(%) pH Totalphenolic(mg/ml) CGA(
g/ml) CFA(g/ml)
7010 70 10 0.82 5.88 2.09 179.09 7.75
7010 70 10 0.76 5.94 1.65 177.67 7.72
9010 90 10 0.91 5.72 2.19 190.17 7.59
9010 90 10 0.93 5.72 2.15 192.99 8.02
7030 70 30 0.87 5.85 2.21 185.41 8.06
7030 70 30 0.83 5.84 2.13 186.65 8.18
9030 90 30 0.91 5.70 2.19 191.55 8.70
9030 90 30 0.95 5.71 2.35 193.04 8.63
8020 80 20 0.77 5.65 2.15 220.87 4.86
Table3
Analysisofvariance(regressioncoefficientsandsignificantpvalues)fordryresidue,totalphenolic,CGAandCFAresponsesformacerationextractionmethod.
Polynomialterm Dryresidue(%) pH Totalphenolic CGA(g/ml) CFA(g/ml)
Coefficient pvalue Coefficient pvalue Coefficient pvalue Coefficient pvalue Coefficient pvalue
Model – 0.0023 – 0.0018 – 0.0153 – <0.0001 – <0.0001
Intercept +1.06 – 5.85 – 3.62 127.42 – 25.44 –
(A)Ethanol(%) −0.026 0.0024 0.048 0.0007 −0.19 0.0053 +25.20 <0.0001 −21.95 <0.0001 (B)Time(days) +0.026 0.0024 0.013 0.1466(NS) 0.011 0.8057(NS) −12.98 <0.0001 +5.41 <0.0001
(AB)Interaction – NS – NS NS +14.75 <0.0001 −5.18 <0.0001
Curvature – NS – 0.0017 0.0370 – <0.0001 <0.0001
NS,notsignificant.
Ethanol concentration (%)
Extraction time (days) Time (min.) Temperature (ºC)
Bonferroni Limit 3.28746
t-Value Limit 2.44691 t-Value Limit 2.36462 Bonferroni Limit 3.12755
B
AB A
4.58
3.44
2.29
1.15
0.00 AB
B A
5.02
4.02
3.01
2.01
1.00
0.00
0.95
0.89
0.82
0.76
0.70
30 80
50
20 4 6
8 1.14
1.11
1.07
1.03
1.00 Dey residue (%)
Dey residue (%)
70 10
80
90
20
t-Value of
|Effect
|
t-Value of
|Effect
|
1 2 3
Rank
1 2 3
Rank
a
b
c
d
Fig.1.Graphofethanolconcentration(A)andextractiontime(B)versusdryresidueformaceration(a);andtemperature(A)andtime(B)fordecoction(b),andsignificance oftheeffects(*)onParetochart:Maceration(c)Decoction(d);positiveeffects(#);negativeeffects(##).
Table4
Analysisofvariance(regressioncoefficientsandsignificantpvalues)fordryresidue,pH,CGAandCFAresponsesfordecoctionextractionmethod.
Polynomialterm Dryresidue(%) pH CGA(g/ml) CFA(g/ml)
Coefficient pvalue Coefficient pvalue Coefficient pvalue Coefficient pvalue
Model – 0.0046 – 0.0001 – 0.0002 – 0.0044
Intercept +0.85 – 5.79 – +13.91 – +7.44 –
(A)Temperature(◦C) +0.053 0.0020
−0.082 <0.0001 +0.18 <0.0001 +0.15 0.0289
(B)Time(min.) +0.017 0.1340(NS) −0.020 0.0498 +0.077 0.0038 +0.31 0.0017
(AB)Interaction – NS – NS −0.064 0.0081 – NS
Curvature – 0.0031 – 0.0003 – <0.0001 <0.0001
Ethanol concentration (%)
Extraction time (days) Time (min.) Temperature (ºC)
t-Value of
|Effect
|
t-Value of
|Effect
|
6.00
5.94
5.88
5.81
5.75
8
6
4 20
50
80 30
20
10 70
80
90 5.60
5.70 5.80 5.90 6.00
pH
10.10
7.58
5.05
2.53
0.00 AB
B A
5.66
4.24
2.83
1.41
0.00
Bonferroni Limit 3.12755
t-Value Limit 2.36462
t-Value Limit 2.44691 Bonferroni Limit 3.28746 B
AB A
1 2 3
Rank
1 2 3
Rank
pH
a
b
c
d
Fig.2.Graphofethanolconcentration(A)andextractiontime(B)versuspHforMaceration(a)andtemperature(A)andextractiontime(B)fordecoction(b),andsignificance oftheeffects(*)onParetochart:Maceration(c);Decoction(d);positiveeffects(#);negativeeffects(##).
significantcurvaturevaluesforbothextractionmethodsshowthat thisincreaseisnotlinear,abehavioralsoshowninFig.2aandb.
ThepHvaluesappeartoreachasteadystateatahigherethanol
concentrationfortheethanolextractsandatahighertemperature
fortheaqueousextracts.However,althoughtherearestatistical
differences,thesmallvariationbetweenthepHvalues(5.78–5.96)
maynotberelevantfromtechnologicalstandpoint.
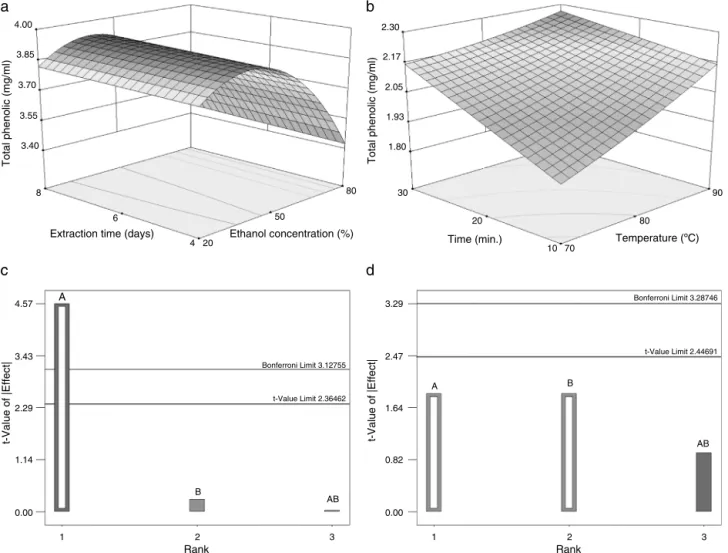
Totalphenoliccontent
Severalresearchershaveinvestigatedtheabilityofsome
phe-noliccompoundspresentinplantmaterialtoactasantioxidants
(Seerametal.,2006;Zhangetal.,2008;Is¸ıketal.,2011).This
activ-itymaybecorrelatedwiththecontentoftheirphenoliccompounds
(Veliogluetal.,1998;Cheungetal.,2003).Determinationoftotal
phenoliccontenthasbeenachievedusingtheFolin–Ciocalteu
pro-cedure(Yuetal.,2002).Thiscolorimetricmethodisbasedonthe
extractionofphenoliccompounds(acidicsolution)afteroxidation
ofthereduced molecules bya mixtureof thetwostrong
inor-ganicoxidantphosphotungsticandphosphomolybdicacids(Is¸ık
etal.,2011).TheFolinmethodhaspoorspecificity,asitcangive
anoverestimatedvaluefortotal phenolcontentinextracts.For
example,betweensomenon-phenolicsubstancesthismethodcan
potentiallyinterfereinthedeterminationoftotal phenolic
con-tentbyincreasingtheabsorbancevalueofthephenoliccompounds
(Stevanatoetal.,2004;Is¸ıketal.,2011).Evenwiththispotential
interference,duetothecomplexityofthesample,thistechnique
iseasyandfasttouse,andisconvenientforroutineuseforquality
controltestsontheplantmaterial.
Totalphenoliccontentwasexpressedasgallicacidequivalents.
Acalibrationcurvewasconstructedwithdifferentconcentrations
ofgallicacidasstandard.Theamountofphenoliccompoundsin
theethanolextractswashigherthanthatoftheaqueousextracts
(Table 1).Thetotal phenoliccontent ofethanol extracts
gradu-allydecreasedwithincreasingethanolconcentration,andwasnot
influencedbyextractiontime(Table3;Fig.3aandc).Thisindicates
thatat4daysofmaceration,asteadystatemayhavealreadybeen
reachedintheextractionofthesecompounds.Thehighertotal
phe-noliccontentintheethanolextractsthanintheaqueousextracts
mightbeexplainedbythedifferentextractorliquid usedinthe
extraction.Inaddition,theextractionmethodmaycontributeto
thedifferenceincontent(Yuetal.,2002).Normally,theefficiency
oftheextractionofpolyphenolicscompoundsislowerusingpure
solutionslikewater,ethanolormethanol.Theyieldoftotal
pheno-liccompoundsextractedfromtheseextractscanbehigherwhen
solventscontainingsomewaterareusedintheextractionprocess
(Katsubeetal.,2009).
AsobservedinFig.3b,theincreasesintemperatureand
extrac-tion time tend to increase the total phenolic concentration in
theaqueousextracts,althoughnostatisticalsignificancehasbeen
observed in the factors evaluated for these extracts (Fig. 3d).
The yield of phenolic compounds may dependsignificantly on
extractiontemperature andtime (Herreraand LuquedeCastro,
4.00
3.85
3.70
3.55
3.40
8
6
4 20
50
80
Ethanol concentration (%) Extraction time (days)
A
2.30
2.17
2.05
1.93
1.80
30
20
10 70
80
90
Time (min.) Temperature (ºC)
Bonferroni Limit 3.28746
t-Value Limit 2.44691
B A
AB
1 2 3
Rank
1 2 3
Rank B
AB
0.00 0.82 1.64 2.47 3.29
t-Value of
|Effect
|
t-Value of
|Effect
|
0.00 1.14 2.29 3.43 4.57
Bonferroni Limit 3.12755
t-Value Limit 2.36462
Total phenolic (mg/ml) Total phenolic (mg/ml)
a
b
c
d
Fig.3. Graphofethanolconcentration(A)andextractiontime(B)versustotalphenolicforMacerationmethod(a)andtemperature(A)andtime(B)fordecoctionmethod (b),andsignificanceoftheeffects(*)onParetochart:Maceration(c);Decoction(d);positiveeffects(#);negativeeffects(##).
integrity, hydrolyze the bonds of bound phenolic compounds
(phenol–proteinorphenol–polysaccharide)andenhancephenolic
solubility.Asaresult,phenoliccompoundswoulddisperseinthe
solvent(Juntachoteetal.,2006;Lietal.,2006;Spignoetal.,2007;
Chanetal.,2009).However,eventhoughincreasedtemperatures
increasethesolubilityofthechlorogenicandcaffeicacids,itshould
betakenintoaccountthathighertemperaturespromote
instabil-ityofthephenoliccompounds(HerreraandLuquedeCastro,2005;
Maetal.,2009).Thismayindicateadegradationofsomephenolic
acids(Maetal.,2009)whichisacrucialinfluenceintheextraction
ofphenolicacidyields.
CGAandCFAcontent
Accordingtotheexperimentaldesign, theextractionof CGA
frommacerationhadasignificantinfluenceonethanol
concentra-tionand time.However,aninteractionbetweenthefactorswas
observed.Significantcurvaturewasalsoobserved,indicatingthere
isnolinearityforthisresponse(Table3;Fig.4aandc).
Ethanolextractscontaining80%ethanolshowedthesame
con-centrationoftheCGAforallextractiontimes(4,6and8days).
Thesedatasuggestthatthesteadystatebetweendrugandsolvent
occurredfromthefourthday.Ontheotherhand,extractsprepared
with20%ethanolpresentedsignificantlylowerlevelsofCGAover
time(Fig.4a).TheCFAcontentinextractscontaining20%ethanol
wasdifferentaccordingtotheextractiontime(Table3;Fig.4band
d).Betweenthefourthandeighthdays,anincreasewasobserved
in theamountof this compound,from 36to 58g/ml,
respec-tively.Inthesameperiod,CGAconcentrationdecreasedfrom130to
75g/ml.ThisdecreaseinCGAcontentwaspreviouslyinvestigated
byourgroup(Arendetal.,2011).Inordertochecktheoccurrence
ofthermalorenzymaticdegradationofCGAduringthemaceration
time,theinfluenceoftemperatureandthepresenceofa
preser-vativeonthecontentofthisacidintheextractivesolutionswere
evaluated.TheseresultsshowedthatCGAconcentrationdoesnot
alterinpresenceof apreservative,suggestingthatthedecrease
inCGAcontentinextractivesolutionsisnotdueto
microbiologi-caldegradationduringtheextractionperiod.Thiseffectmightbe
relatedtoachemicaldegradation,consideringthatchlorogenicacid
isanesterofcaffeicacidandquinicacid(Olthofetal.,2001;Arend
etal.,2011).AhigherCGAconcentrationwasobservedinextracts
containing50%ethanol,followedbywith80%ethanol
(indepen-dentof extractiontime)and 20%ethanol, 4daysand 8daysof
extractiontime,respectively.
CGAextractiononaqueousextractsappearstobeinfluenced
bytimeandtemperatureandaninteractionbetweenthefactors
wasobserved(Table4;Fig.5aandc).MaximumCGAcontentwas
observedat30minandanextractiontemperatureofabout80◦C,
showingnon-linearityinthisresponse(Table4).Thesameoccurs
for the amountof CFA,but inthe opposite direction,with the
smallestamountoccurringataround80◦C(Table4;Fig.5band
d).However,CFAcontentintheaqueousextractswasverylow,
particularlywhencomparedCGAcontentintheseextractive
Ethanol concentration (%)
Extraction time (days) Extraction time (days) Ethanol concentration (%)
CFA (
μ
g/ml)
CGA (
μ
g/ml)
200
165
130
95
60
8
6
80
50
20 4
6
4 20
50
80 8
0 15 30 45 60
66.92
57.36
47.80
38.24
28.68
19.12
9.56
0.00
t-Value of
|Effect
|
AB
B A
237.15
177.86
118.57
59.29
0.00
B A
AB
1 2 3
Rank
1 2 3
Rank
t-Value of
|Effect
|
a
b
c
d
Bonferroni Limit 3.53411
t-Value Limit 2.57058 Bonferroni Limit 3.53411 t-Value Limit 2.57058
Fig.4. Graphofethanolconcentration(A)andextractiontime(B)versusCGA(a)andCFA(b)inthemacerationmethod,andsignificanceoftheeffects(*)onParetochart: CGA(c);CFA(d);positiveeffects(#);negativeeffects(##).
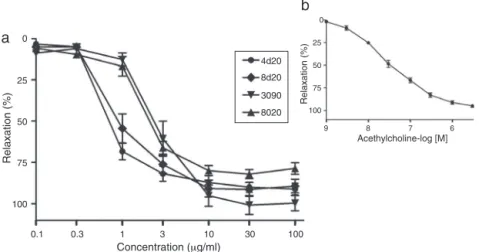
Vascularreactivityinvitrointhoracicrataorta
Infusion of C. glaziovii leaves has been used in traditional
medicineas anantihypertensive, cardiotonicand antiasthmatic
(Rochaetal.,2002).Lima-Landmanetal.(2007)describedan
anti-hypertensiveeffectforaqueousextractandbutanolicfractionofC.
glaziovii,withsatisfactoryresults.Basedontheseresults,thiswork
providesevidenceoftheabilityoftheextractivesolutionsprepared
bymaceration(4d20,8d20)anddecoction(9030and8020)torelax
rataorta,andevaluatethepotencyoftheextractsforthispurpose.
Fig.6showstheconcentration–effectcurvestosamplesinrataortic
ringspre-contractedwithphenylephrine(1M).Cumulative
dos-ingofextractsproducedaconcentration-dependentrelaxationof
aorticrings.TheIC50 valueswiththe95%respectiveconfidence
intervalsfortheextractivesolutionswere:4d20,0.85(0.74–0.96);
8d20,1.48 (1.01–1.89); 9030,2.62 (2.26–2.98);and 8020,2.41
(1.99–2.81)g/ml.AnalyzingtheIC50values,weverifiedthatthe
ethanolextractspresentedmorepotentvasodilatoreffectsthanthe
aqueousextractsinaorticrings.
Antihyperglycemicactivity
AcuteantihyperglycemiceffectofC.glaziovii
Fig.7aandbshowstheeffectofdifferentethanoland
aque-ousextractsfromC.glazioviiontheglucosetolerancecurve.The
extractswereselectedbasedontheconcentrationofthe
chemi-calmarkers,chlorogenicacid(CGA)andcaffeicacid(CFA),inthe
extracts.Oraladministration(400mg/kg)ofethanolextracts4d20
and8d20improvedglucosetolerance,andthiseffectwas
signif-icant at15minfor 4d20extract and at15, 30,60 and 180min
for8d20extractwhencomparedwiththehyperglycemiccontrol
group.Ontheotherhand,theoraltreatmentswith6d50ethanol
extractaswellasthe8020and9030aqueousextractswerenot
abletoreducethebloodglucoselevels.Asexpected,afterstarting
theglucosetolerancetesttheserumglucoseconcentrationwas
sig-nificantlyincreasedwhencomparedwithzerotime.Tolbutamide
(100mg/kg)anoralhypoglycemicagentofsulfonylureaclasswas
usedasapositivecontrolandproducedatypicalserumglucose
lowering at15, 30 and 60mincompared tothe hyperglycemic
group(Fig.1C).
Consideringtheglucosehomeostasis,somespeciesofCecropia
havebeendescribed toimproveglucosemetabolism.The
hypo-glycemiceffectofmethanol leafextractsof C.obtusifoliaandC.
peltatawereevaluatedinhealthymice.Bothextractsproduceda
significanthypoglycemiceffectat2and4hafteroral
administra-tion.However,C.peltatashowedabettereffectthanC.obtusifolia,
which may be correlated to thedifference in chlorogenic acid
content between them (Nicasio et al., 2005). Additionally, an
investigationoftheC.pachystachyamethanolextractconfirmed
ahypoglycemiceffectthat canbeexplainedbythepresenceof
chlorogenicacidand C-glycosylated flavonesas themajor
con-stituents.
Basedontheseresults,thechemicalmarkerswereevaluated
ontheglucosetolerancecurveandtheresultsareshowninFig.8.
ItcanbeobservedthatCGAat15mg/kgwasnotabletoreduce
Temperature (°C) Time (min.)
70 10
Temperature (°C) Time (min.)
80
90
20 30
170 185 200 215
230 9.00
7.75
6.50
5.25
4.00
30
20
10
80
90
70
6.15
4.61
3.07
1.54
0.00
1 2 3
Rank
1 2 3
Rank A B
AB 11.67
10.37
9.08
7.78
6.48
5.19
3.89
2.59
1.30
0.00 A
B
AB
CFA (
μ
g/ml)
CGA (
μ
g/ml)
t-Value of
|Effect
|
t-Value of
|Effect
|
Bonferroni Limit 3.53411
t-Value Limit 2.57058
a
b
c
d
Bonferroni Limit 3.53411
t-Value Limit 2.57058
Fig.5.Graphoftemperature(A)andtime(B)versusCGA(a)andCFA(b)inthedecoctionmethod,andsignificanceoftheeffects(*)onParetochart:CGA(c);CFA(d);positive effects(#);negativeeffects(##).
significanteffectat15and30minafterthetreatment.Also,CFA
atthedose(2mg/kg)showedarapideffectat15mincomparedto
thecontrolgroup.Inordertoevaluateifthesecompoundshave
anadditiveeffecttheywerestudiedtogetherintheoralglucose
tolerancecurve.Atthedoseof2mg/kgCGAandCFAwereableto
significantlyreducetheglycemiaatbetween15minand60min
afteroralgavagetreatment.
Caffeicandchlorogenicacidshavealreadybeendemonstrated
toreducebloodglucoselevelsinhyperglycemicaswellasin
dia-beticratsacting viaseveralmechanismsagainst hyperglycemia
(Meng et al., 2013; Dhungyahet al., 2014).They regulate beta
cellfunctionandincreaseinsulinsecretion,up-regulateadipocytes
GLUT-4 contentand increase glucose uptake in adipocytesand
in muscles. Additionally, CFA and CGA inhibit alpha-amylase
0.1 0.3 1 3 10 30 100
Concentration (μg/ml)
Acethylcholine-log [M]
8 7 6
9 100
75 50 25 0
Relaxation (%)
4d20
8d20
3090
8020
100 75 50 25 0
Relaxation (%)
a
b
60 30
15 180
Time (min) Time (min)
60 30
15 180
50 100 150 200 250
Hyperglycemic control
8020 400 mg/kg
9030 400 mg/kg 4d20 400 mg/kg
8d20 400 mg/kg
6d50 400 mg/kg Hyperglycemic control 250
200
150
100
50
Serum glucose levels (mg/dl) Serum glucose levels (mg/dl)
a
b
Fig.7.Effectofmaceration(A)anddecoction(B)extractsfromCecropiaglazioviiSnethlonglucosetolerancecurve.Valuesareexpressedasmean±S.E.M;n=6induplicate foreachtreatment.Statisticallysignificantdifferencefromthecorrespondinghyperglycemicgroup;*p≤0.05;***p≤0.001).
and alpha-glucosidase activity in the gastrointestinal tract and
increasesglucokinaseactivityinthehepatocytes(Jungetal.,2006;
Touschetal.,2008;Bassolietal.,2008;Karthikesanetal.,2010;Ong etal.,2012,2013;Mengetal.,2013;Dhungyahetal.,2014).
Caf-feicacidandchlorogenicacidalsolowerglucose-6-phosphatase,
glucose-6-translocase and phosphoenolpyruvate carboxykinase
activities,componentsofgluconeogenesis andglycogenolysisin
ratliverresultinginareductionofthehepaticglucoseproduction
(Schwabetal.,2001).ConsideringthatCGAandCFAarethemajor
constituentsofC.glazioviiextracts,itcanbesuggestedthatthe
anti-hyperglycemicandthehypoglycemiceffectobservedhereintoC.
glazioviiextractsandtoCFAandCGAcouldbemediatedthrough
differenttargetsofactioninvolvinghepaticglucoseoutput,glucose
uptakeininsulintargettissues,intestinalglucoseabsorptionand
insulinsecretion.
Basedonthecontent oftheCGA and CFAoneach of theC.
glazioviiextractivesolutionsandbasedontheliterature,itis
sug-gestedthattheantihyperglycemiceffectofthedifferentextracts
mayberelated withthecontent/concentration ofthe chemical
markersandalsototheratiobetweenthem.Thebestresultson
glycemiawereobservedwiththeextractsthatcontainedthe
low-estconcentrationsofCGAandCFA(8d20and4d20)andalsothe
ratiocloseto1:1(Fig.7aandb/Table1).Thisresultisinlinewith
thoseobservedforCGAandCFAontheglucosetolerancecurve,in
Serum glucose levels (mg/dl)
CGA 15 mg/kg Hyperglycemic control
230
170
110
50
30
15 60
Time (min) 180
CGA 2 mg/kg
CFA 2 mg/kg
CGA + CFA 2 mg/kg
Fig.8. Effectofthechemicalmarkerschlorogenicacid(CGA)andcaffeicacid (CFA),andtheassociationonglucosetolerancecurve.Valuesareexpressedas mean±S.E.M;n=6induplicateforeachtreatment.Statisticallysignificant differ-encefromthecorrespondinghyperglycemicgroup;**p≤0.01.
whichthelowestdoseofCGAaswellastheassociationofboth,CGA
andCFApresentedthemostpronouncedeffect(Fig.8)showinga
dose-dependentpatternofactionontheglucosetolerancecurve.
Additionally,inordertocomplementtheglycemicprofile,the
differentextractsofC. glazioviiandthechemical markerswere
studiedinvivo,usinganalloxan-induceddiabeticratmodel(unable
tosecretinsulin).Fig.9showstheeffectofethanolandaqueous
extractsaswellasCGAonglycemiainalloxan-induceddiabetic
rats.Theaqueousextracts,8020and9030,wereabletoreduce
significantlytheglycemia,at1handat2h,respectively,afterthe
oral treatments (400mg/kg),when compared withthe diabetic
controlgroup.Also, itcan beobservedthattheethanol extract
8d20presentedaslightreductioninglycemiaat2hafterthe
treat-ment.Additionally,whenthechemicalmarkers,CGAandCFAwere
evaluated,justthehigherdoseofCGA(15mg/kg)presenteda
sig-nificanteffectonreducingthebloodglucoselevelsat2and3hafter
thetreatment.TheCFA,CGAaswellastheassociationofbothat
2mg/kgwereineffectiveinthisapproach(datanotshown).
Con-trarytothatobservedinhyperglycemicnormalrats,theabsenceof
and/ortheslighteffectoftheethanolextractsinalloxan-induced
diabeticratsmayberelatedtotheinsufficientconcentrationofCGA
andCFAintheextracts,sincewhenthesecompoundswere
eval-uatedonlythehigherdoseofCGAwaseffectiveinthisapproach.
Also,theaqueousextractsthatpresentedahigherconcentration
ofCGAwereeffectiveinthediabeticanimals.Itispossiblethat
toexertitseffectasaninsulinomimeticagentindiabeticrats,C.
glazioviiextracts/compoundsmusthavehigherconcentrationsof
themainconstituents,CGAandCFA.
CGA 15 mg/kg 8020 400 mg/kg 9030 400 mg/kg 8d20 400 mg/kg Diabe tic control
250 300 350 400 450 500
Serum glucose levels (mg/dl)
1 2 3
Time (h)
Fig.9. Effectoftheethanolicandaqueousextractsandthechlorogenicacid(CGA) ontheserumglucoselevelinalloxan-induceddiabeticrats.Valuesareexpressedas mean±S.E.M;n=6induplicateforeachtreatment.Statisticallysignificant differ-encefromthecorrespondingzerotimevalueofeachgroup;*p≤0.05.Statistically
RecentstudieshaveshownthehypoglycemiceffectofCecropia
speciesindiabeticanimalmodels.Aqueousandbutanolextracts
preparedfromC.obtusifoliaandC.peltatawereevaluatedin
strep-tozotocindiabeticratsandtheresultsshowedasignificantdecrease
inserumglucoseat3haftertheoraltreatmentaswellasonthe
oralglucosetolerancecurve.Moreover,itissuggestedthat
chloro-genicacidisinvolvedinthehypoglycemiceffectofC.obtusifolia
and C. peltata because it wasone of the majorconstituents of
theextracts(Andrade-CettoandWiedenfeld,2001;Andrade-Cetto
andVázquez,2010).ThemethanolextractfromtheleavesofC. pachystachyaalsoproduceda significanthypoglycemiceffectin
alloxan-induceddiabeticrats,probablyduetothechlorogenicacid
contentinthisspecies(Aragãoetal.,2010;Karthikesanetal.,2010).
Inconclusion,thisstudyprovidesthefirstreportonthe
antihy-perglycemicactionoftheextractsofC.glazioviileavesimproving
glucosetolerance.Inaddition,thepotentrelaxingeffectofethanol
extractsonthoracicaortawasdemonstrated.Independentofthe
exactmechanismofactioninvolved,theseresultscanprobablybe
associatedwiththeconcentrationsofthephenolicconstituentsof
theextracts.Theresultspresentedheregiveinitialexperimental
supportforfuture experiments,astheylinkthis effecttomore
classesofsecondarycompoundsaswellasevaluationofthe
iso-latedcompoundspresentintheextractivesolutions.
Authors’contributions
DPA(MScstudent)contributedinrunningthelaboratorywork,
chromatographic analysis, analysis of thedata and draftedthe
paper.TCScontributedindraftingthemanuscript.LHCandMAH
contributedtobiologicalstudies.DS,ALGS,RMRVandFRMBS
con-tributedtocriticalreadingofthemanuscript.AMCdesignedthe
study,supervised thelaboratoryworkand contributed to
criti-calreadingofthemanuscript.Alltheauthorshavereadthefinal
manuscriptandapprovedthesubmission.
Conflictsofinterest
Theauthorsdeclarenoconflictsofinterest.
Acknowledgments
The authors thank FAPESC (Grant Number 05798, edict
008/2006),CNPqandÍlioMontanariJr.researcheratCPQBA.
References
Alonso-Castro,A.J.,Miranda-Torres,A.C.,González-Chávez,M.M.,Salazar-Olivo,L.A., 2008.CecropiaobtusifoliaBertolanditsactivecompound,chlorogenicacid, stim-ulate2-NBDglucoseuptakeinbothinsulin-sensitiveandinsulin-resistant3T3 adipocytes.J.Ethnopharmacol.120,458–464.
Andrade-Cetto,A.,Cárdenas,R.,Ramírez-Reyes,B.,2007.Hypoglycemiceffectof CecropiapeltataL.onN5-STZtype2diabeticrats.Pharmacology3,203–210. Andrade-Cetto,A.,Vázquez,R.C.,2010.Gluconeogenesisinhibitionand
phytochem-icalcompositionoftwoCecropiaspecies.J.Ethnopharmacol.130,93–97. Andrade-Cetto,A.,Wiedenfeld,H.,2001.HypoglycemiceffectofCecropiaobtusifolia
onstreptozotocindiabeticrats.J.Ethnopharmacol.78,145–149.
Andriambeloson,E.,Stoclet,J.C.,Andriantsitohaina,R.,1999.Mechanismof endothe-lialnitricoxide-dependentvasorelaxationinducedbywinepolyphenolsinrat thoracicaorta.J.Cardiovasc.Pharm.33,248–254.
Aragão,D.M.O.,Guarize,L.,Lanini,J.,daCosta,J.C.,Garcia,R.M.G.,Scio,E.,2010. HypoglycemiceffectsofCecropiapachystachyainnormalandalloxan-induced diabeticrats.J.Ethnopharmacol.128,629–633.
Arend,D.P.,dosSantos,T.C.,Sonaglio,D.,dosSantos,A.L.G.,Reginatto,F.H.,de Cam-pos,A.M.,2011.Experimentaldesignasatooltoevaluatechlorogenicandcaffeic acidsextractedfromCecropiaglazioviiSneth.J.Pharm.Biomed.Anal.54,58–66. Bassoli,B.K.,Cassolla,P.,Borba-Murad,G.R.,Constantin,J.,Salgueiro-Pagadigorria, C.L.,Bazotte,R.B.,Silva,R.S.S.F.,Souza,H.M.,2008.Chlorogenicacidreducesthe plasmaglucosepeakintheoralglucosetolerancetest:effectsonhepaticglucose releaseandglycaemia.CellBiochem.Funct.26,320–328.
Benthin,B.,Danz,H.,Hamburger,M.,1999.Pressurizedliquidextractionofmedicinal plants.J.Chromatogr.A837,211–219.
2010.Farmacopéia Brasileira,5thed. AgênciaNacionaldeVigilânciaSanitária, Brasília.
Chan,S.W.,Lee,C.Y.,Yap,C.F.,WanAida,W.M.,Ho,C.W.,2009.Optimisationof extractionconditionsforphenoliccompoundsfromlimaupurut(Citrushystrix) peels.IFRJ16,203–213.
Cheung,L.M.,Cheung,P.C.K.,Ooi,V.E.C.,2003.Antioxidantactivityandtotal pheno-licsofediblemushroomextracts.FoodChem.81,249–255.
Delarcina,S.,Lima-Landman,M.T.R.,Souccar,C.,Cysneiros,R.M.,Tanae,M.M.,Lapa, A.J.,2007.Inhibitionofhistamine-inducedbronchospasminguineapigstreated withCecropiaglazioviSnethandcorrelationwiththeinvitroactivityintracheal muscles.Phytomedicine14,328–332.
Dhungyah,B.,Koirala,P.,Sharma,C.,Jha,D.K.,2014.Caffeicacid–apotent phyto-compoundagainstdiabetesmellitusareview.SMUMed.J.1,152–161. Folador,P.,Cazarolli,L.H.,Gazola,A.C.,Reginatto,F.H.,Schenkel,E.P.,Silva,F.R.M.B.,
2010.Potentialinsulinsecretagogueeffectsofisovitexinandswertisin iso-latedfromWilbrandiaebracteata rootsinnon-diabeticrats.Fitoterapia81, 1180–1187.
Genta,S.B., Cabrera,W.M.,Mercado,M.I., Grau,A.,Catalán,C.A.,Sánchez,S.S., 2010.HypoglycemicactivityofleaforganicextractsfromSmallanthus sonchi-folius:constituentsof themostactive fractions.Chem.Biol.Interact. 185, 143–152.
Herrera,M.C.,LuquedeCastro,M.D.,2005.Ultrasound-assistedextractionof phe-noliccompoundsfromstrawberriespriortoliquidchromatographicseparation andphotodiodearrayultravioletdetection.J.Chromatogr.A1100,1–7. Hsu,F.-L.,Chen,Y.-C.,Cheng,J.-T.,2000.Caffeicacidasactiveprinciplefromthefruit
ofXanthiumstrumariumtolowerplasmaglucoseindiabeticrats.PlantaMed. 66,228–230.
Is¸ık,E.,S¸ahin,S.,Demir,C.,Türkben,C.,2011.Determinationoftotalphenoliccontent ofraspberryandblackberrycultivarsbyimmobilizedhorseradishperoxidase bioreactor.J.FoodCompos.Anal.24,944–949.
Jacques,R.A.,dosSantosFreitas,L.,Pérez,V.F.,Dariva,C.,deOliveira,A.P.,deOliveira, J.V.,Caramão,E.B.,2007.TheuseofultrasoundintheextractionofIlex paraguar-iensisleaves:acomparisonwithmaceration.Ultrason.Sonochem.14,6–12. Jain,S.C.,Pancholi,B.,Singh,R.,Jain,R.,2010.Pharmacognosticalstudiesofimportant
aridzoneplants.Rev.Bras.Farmacogn.20,659–665.
Jung,U.J.,Lee,M.-K.,Park,Y.B.,Jeon,S.-M.,Choi,M.-S.,2006.Antihyperglycemicand antioxidantpropertiesofcaffeicacidindb/dbmice.J.Pharmacol.Exp.Ther.318, 476–483.
Juntachote,T., Berghofer, E., Bauer, F.,Siebenhandl, S., 2006. Theapplication ofresponsesurfacemethodologytotheproductionofphenolicextractsof lemongrassgalangal,holybasilandrosemary.Int.J.FoodSci.Technol.41, 121–133.
Karthikesan,K.,Pari,L.,Menon,V.P.,2010.Combinedtreatmentof tetrahydrocur-cumin and chlorogenic acid exerts potential antihyperglycemic effect on streptozotocin–nicotinamide-induceddiabeticrats.Gen.Physiol.Biophys.29, 23–30.
Katsube,T.,Tsurunaga,Y.,Sugiyama,M.,Furuno,T.,Yamasaki,Y.,2009.Effectof air-dryingtemperatureonantioxidantcapacityandstabilityofpolyphenolic compoundsinmulberry(MorusalbaL.)leaves.FoodChem.113,964–969. Kolb,N.,1999. Microbiologicalstatus ofuntreatedHerbalmaterials.Deutsche
Lebensmittel-Rundschau95,263–269.
Kosalec,I.,Cvek,J.,Tomi´c,S.,2009.ContaminantsofMedicinalHerbsandHerbal Products.ArhHigRadaToksikol,pp.485.
Li,B.B.,Smith,B.,Hossain,M.M.,2006.Extractionofphenolicsfromcitruspeels:II. Enzyme-assistedextractionmethod.Sep.Purif.Technol.48,189–196. Lima-Landman,M.T.R.,Borges,A.C.R.,Cysneiros,R.M.,DeLima,T.C.M.,Souccar,C.,
Lapa,A.J.,2007.Antihypertensiveeffectofastandardizedaqueousextractof CecropiaglazioviiSnethinrats:aninvivoapproachtothehypotensive mecha-nism.Phytomedicine14,314–320.
Ma,Y.-Q.,Chen,J.-C.,Liu,D.-H.,Ye,X.-Q.,2009.Simultaneousextractionofphenolic compoundsofcitruspeelextracts:effectofultrasound.Ultrason.Sonochem.16, 57–62.
Meng,S.,Cao,J.,Feng,Q.,Peng,J.,Hu,Y.,2013.Rolesofchlorogenicacidonregulating glucoseandlipidsmetabolism:areview.Evid.BasedComplement.Altern.Med. 2013,1–11.
Montgomery,D.C.,2005.DesignandAnalysisofExperiments,6aed,NewJersey.
Nicasio,P.,Aguilar-Santamaría,L.,Aranda,E.,Ortiz,S.,González,M.,2005. Hypo-glycemiceffectandchlorogenicacidcontentintwoCecropiaspecies.Phytother. Res.19,661–664.
Ninahuaman,M.F.M.L.,Souccar,C.,Lapa,A.J.,Lima-Landman,M.T.R.,2007.ACE activityduringthehypotensionproducedbystandardizedaqueousextractof CecropiaglazioviiSneth:acomparativestudytocaptoprileffectsinrats. Phy-tomedicine14,321–327.
Olthof,M.R.,Hollman,P.C.H.,Katan,M.B.,2001.Chlorogenicacidandcaffeicacidare absorbedinhumans.J.Nutr.131,66–71.
Ong,E.S.,2004.Extractionmethodsandchemicalstandardizationofbotanicalsand herbalpreparations.J.Chromatogr.B812,23–33.
Ong,K.W.,Hsu,A.,Tan,B.K.H.,2012.Chlorogenicacidstimulatesglucosetransport inskeletalmuscleviaAMPKactivation:acontributortothebeneficialeffectsof coffeeondiabetes.PLoSONE7,e32718.
Ong,K.W.,Hsu,A.,Tan,B.K.H.,2013.Anti-diabeticandanti-lipidemiceffectsof chlorogenicacidaremediatedbyAMPKactivation.Biochem.Pharmacol.85, 1341–1351.
Rocha,F.F., Lapa,A.J.,De Lima,T.C.M., 2002.Evaluationof theanxiolytic-like effectsofCecropiaglaziouiSneth inmice.Pharmacol. Biochem.Behav.71, 183–190.
Rocha,F.F.,Lima-Landman,M.T.R.,Souccar,C.,Tanae,M.M.,DeLima,T.C.M.,Lapa, A.J.,2007.Antidepressant-likeeffectofCecropiaglaziouiSnethandits con-stituents–invivoandinvitrocharacterizationoftheunderlyingmechanism. Phytomedicine14,396–402.
RodriguezdeSotillo,D.V.,Hadley, M.,2002. Chlorogenicacidmodifiesplasma andliverconcentrationsof:cholesterol,triacylglycerol,andmineralsin(fa/fa) Zuckerrats.J.Nutr.Biochem.13,717–726.
Schwab,D.,Herling,A.W.,Hemmerle,H., Schubert,G.,Hagenbuch,B.,Burger, H.-J., 2001. Hepatic uptake of synthetic chlorogenic acid derivatives by the organic anion transport proteins. J. Pharmacol. Exp. Ther. 296, 91–98.
Seeram,N.P.,Lee,R.,Scheuller,H.S.,Heber,D.,2006.Identificationofphenolic com-poundsinstrawberriesbyliquidchromatographyelectrosprayionizationmass spectroscopy.FoodChem.97,1–11.
Silva,I.T.,Costa,G.M.,Stoco,P.H.,Schenkel,E.P.,Reginatto,F.H.,Simões,C.M.O.,2010. InvitroantiherpeseffectsofaC-glycosylflavonoid-enrichedfractionofCecropia glazioviiSneth.Lett.Appl.Microbiol.51,143–148.
Souccar,C.,Cysneiros,R.M.,Tanae,M.M.,Torres,L.M.B.,Lima-Landman,M.T.R., Lapa,A.J.,2008.Inhibitionofgastricacidsecretionbyastandardizedaqueous extractofCecropiaglazioviiSnethandunderlyingmechanism.Phytomedicine 15,462–469.
Spigno,G.,Tramelli,L.,DeFaveri,D.M.,2007.Effectsofextractiontime,temperature andsolventonconcentrationandantioxidantactivityofgrapemarcphenolics. J.FoodEng.81,200–208.
Stevanato,R.,Fabris,S.,Momo,F.,2004.Newenzymaticmethodforthe deter-minationoftotalphenoliccontentinteaandwine.J.Agric.FoodChem.52, 6287–6293.
Tousch,D.,Lajoix,A.D.,Hosy,E.,Azay-Milhau,J.,Ferrare,K.,Jahannault,C.,Cros,G., Petit,P.,2008.Chicoricacidanewcompoundabletoenhanceinsulinrelease andglucoseuptake.Biochem.Biophys.Res.Commun.377,131–135. Varley,H.,Gowenlock,A.H.,Bell,M.,1976.PracticalBiochemistry,London. Velioglu,Y.S.,Mazza,G.,Gao,L.,Oomah,B.D.,1998.Antioxidantactivityandtotal
phenolicsinselectedfruits,vegetables,andgrainproducts.J.Agric.FoodChem. 46,4113–4117.
Vila-Jato,J.L.,1997.TecnologiaFarmacéutica.Aspectosfundamentalesdelos sis-temasfarmacêuticosyoperacionesbásicas.Madrid,EditorialSintesis. WHO,1998.Qualitycontrolmethodsformedicinalplantmaterials.In:WorldHealth
Organization(Ed.),WHOLibraryCataloguing-in-PublicationData.
Wolfgang,K.,Erich,C.,Brigitte,K.,2002.Microbialcontaminationofmedicinal plants.Areview.PlantaMed.68,5–15.
Yu,L.,Haley,S.,Perret,J.,Harris,M.,Wilson,J.,Qian,M.,2002.Freeradicalscavenging propertiesofwheatextracts.J.Agric.FoodChem.FoodChem.50,1619–1624. Zhang,Y.,Seeram,N.P.,Lee,R.,Feng,L.,Heber,D.,2008.Isolationandidentificationof