Percentile of Serum Lipid Profile in Children at Eastern Iran
Fatemeh Taheri1, *Tayebeh Chahkandi2, Toba Kazemi3, Bita Bijari4
1
Associate Professor of Pediatric, Birjand Atherosclerosis and Coronary Artery Research Center, Birjand University of Medical Sciences (BUMS), Birjand, Iran.
2
Assistante Professor of Pediatric, Birjand Atherosclerosis and Coronary Artery Research Center, Birjand University of Medical Sciences (BUMS), Birjand, Iran.
3
Professor of Cardiology, Birjand Atherosclerosis and Coronary Artery Research Center, Birjand University of Medical Sciences (BUMS), Birjand, Iran.
4
Assistante Professor of Social Medicine, Birjand Atherosclerosis and Coronary Artery Research Center, Birjand University of Medical Sciences (BUMS), Birjand, Iran.
Abstract
Introduction
Racial and environmental differences in communities leading cause of differences in serum lipids. It can be said this study aimed in assessing percentile curves of serum lipid profile in 6 to18 year- old of students at Birjand, east of Iran.
Methods and Materials
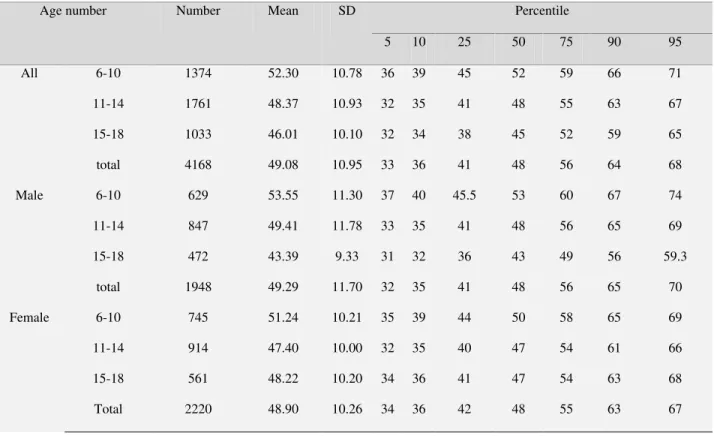
The present cross-sectional study was done on 4168 students of Birjand aged 6-18 years. They were classified into three age groups (6-10) and (15-18) and (11-14) years. The 5th, 10th, 25th, 50th, 75th, 90th, and 95th percentiles of lipids [Cholesterol, Low density lipoprotein (LDL), High density lipoprotein (HDL) and triglycerides] were determined by sex for different age groups.
Result
The 5th, 10th, 25th, 50th, 75th, 90th and 95th percentiles for cholesterol, LDL, HDL, and Triglycerides (TG) were: (114,123, 138, 157, 176, 197, 210; 54, 59, 71, 86, 102, 119, 131; 33, 36, 41, 48, 56, 64, 68 and 43, 49, 61, 78, 103, 138, 164) respectively.
Conclusion
Percentiles of lipid in kids of Birjand were different in comparison with reference percentiles of the U.S and also Tehran. Triglycerides and HDL in children and adolescents were higher and lower, respectively than the Americans. This could be due to racial differences and environmental factors such as nutrition and sedentary life style. This should be considered in interpretation of normal and abnormal values and determination of dyslipidemia in children and adolescents.
Keywords: Adolescents, Birjand, Children, Dyslipidemia, Lipid profile.
Corresponding author:
Tayebeh Chahkandi MD, Assistant professor of pediatric,
Birjand Atherosclerosis and Coronary Artery Research Center, Birjand University of Medical Sciences (BUMS), Birjand, Iran.
E-mail address: na_chahkandi@yahoo.com
Introduction
During these decades cardiovascular disease as the main reason of adult mortality has been increased especially in many of developing countries (1-3). Dyslipidemia or, abnormal levels of blood lipids such as hypercholesterolemia begins in childhood and adolescence and can lead to premature atherosclerosis (4-6). Bugalus Heart Study Autopsy studies showed that High total cholesterol (TC) , LDL and low HDL are associated with increasing coronary artery lesions (7, 8). It is known which not only in adults but also in children and adolescents, dyslipidemia is related with other cardiovascular risk factors such as hypertension and obesity (9, 10).
Serum lipids levels are related to gender, race, and age in children and adolescents (11). Like of many developing countries, cardiovascular disease and its associated risk factors such as obesity as a public health problem is increasing in Iran (12-14).Therefore study of lipid profile and prevalence of dyslipidemia especially in children and adolescents is important. Considering that the environment and racial differences could lead to difference in lipid profile of various communities, herein we aim to determine lipid percentiles in 6 to18 year- old children in Birjand.
Methods and Materials
The present cross-sectional, descriptive and analytical study was done on 4168 middle and high school students aged 6 to18 years (2220 girls and 1948 boys) in Brigand, eastern Iran in 2012. The samples were selected through multistage cluster sampling. Considering the distribution of
schools in different districts of the city, at first 24 girls’ schools and 24 boys’ schools each consisting 10 primary, 7 middle, and 7 high schools were selected. Then, some students were selected from each class with respect to the population of each school and its ratio to the total number of students in that class. Firstly, 4500 students were chosen and a demographic questionnaire bearing a consent form was sent to each one’s parents. The parents were requested to fill out the demographic and consent forms then return them to school if they agreed with their kid’s participation in the plan. The exclusion criteria were: (a) not having any chronic disease or endocrine disorder such as diabetes; (b) not being on treatment of corticosteroids or drugs influencing lipid profile.
(version15). P ≤ 0.05 was taken as the significant level.
Results
In the present study 4168 students, aged 6 to 18 year-old, including 1948 (46.7%) girls and 2220 (53.3%) boys, were included. 33%, 42.2%, and 24.8%, of students were in the age groups of 6-10, 11-14, and 15-18 years, respectively.
The 5th, 10th, 25th, 50th, 75th, 90th, and 95th percentiles for cholesterol, LDL, HDL, and TG were 114, 123, 138, 157, 176, 197, 210; 54, 59, 71, 86, 102, 119, 131; 33, 36, 41, 48, 56, 64, 68, and 43, 49, 61, 78, 103, 138, 164, respectively (Tables 1-4).
Mean TC and LDL were significantly higher in girls than boys (p=0.007) as (156.9 ±
30.6) and (86.7 ± 24.2) mg/dl for boys and (159.4 ± 28.2) and (88.7±23.3) mg/dl for girls.
Mean TG was 87.9 mg/dl, that there was no statistically significant difference between the two groups (p=0.97). Mean HDL was higher in boys (49.29±11.7) compared the girls (48.90±10.2), however the difference was not statistically significant (p=0.25).
The age groups of 6-10 and 15-18 years among of all age groups had highest and lowest amount of mean TC, LDL, and HDL, respectively. The lowest and highest mean of TG were obtained for 6-10 and 10-14 aged groups, respectively. Mean of all serum lipids at different age groups were significantly different (p<0.001).
Table1: TC percentiles and their mean values for different age groups/gender Percentile SD
Mean Number
Age number
95th 90th
75th 50th
25th 10th
5th
217 205
185 166
150 135
127 27.04
168.16 1374
6-10 All
206 193
173 154
136 122
115 28.61
156.06 1761
11-14
200 184
164 146
129 114
107 29.82
148.85 1033
15-18
210 197
176 157
138 123
114 29.38
158.26 4168
total
219 207
187 167
151 138
125 27.18
169.54 629
6-10 Boy
206 194
174 154
136 120
112 28.96
155.73 847
11-14
198.3 176
155 138
123 111
104.6 30.82
142.32 472
15-18
211 198
175 155
136 120
112 30.60
156.94 1948
Total
214 202
183 166
150 134
128 26.90
166.99 745
6-10 Girl
206 192
173 154
136 123
116.7 28.30
156.36 914
11-14
201.8 187.8
171 152
137 122
110 27.82
154.34 561
15-18
209 195
176 158
140 125
118 28.23
159.41 2220
Table 2: LDL percentiles and their mean values for different age groups/gender Percentile SD Mean Number Age number 95 90 75 50 25 10 5 137 126.5 109 94 79 67 59 23.14 95.45 1374 6-10 All 126 115 98 84 70 59 54 22.82 85.57 1761 11-14 122 111 95 79 65 55 49 23.75 81.41 1033 15-18 131 119 102 86 71 59 54 23.82 87.80 4168 total 137 129 110 93 80 68 61.5 22.93 95.69 629 6-10 Male 126 115 98 84 69 58 52.4 22.87 85.14 847 11-14 119 105.7 89 74 62 53 45 24.51 77.67 472 15-18 131 119 100 85 70 58 52 24.27 86.73 1948 total 138 125 109 94 79 65 59 23.33 95.25 745 6-10 Female 128.2 115 97 83 71 60 54.7 22.77 85.97 914 11-14 123 115 97 83 68 58 51 22.63 84.56 561 15-18 131 118 103 87 73 61 55 23.28 87.73 2220 Total
Table 3: HDL percentiles and their mean values for different age groups/gender
Table 4: TG percentiles and their mean values for different age groups/gender
Percentile SD
Mean Number
Age number
95 90
75 50
25 10 5
142 121
92 71
56 45 40.75 34.77
79.18 1374
6-10 All
178 147
113 84
66 52 46
43.13 94.66
1761 11-14
165 138
101 76
61 49 42
47.43 88.12
1033 15-18
164 138
103 78
61 49 43
42.26 87.93
4168 total
138 118
91 70
54 44 38.5 32.65
76.65 629
6-10 Male
187 155
113 81
63 49 43
47.73 94.37
847 11-14
189.7 147.7
106 77
60 46 41
53.19 91.32
472 15-18
173 141
105 76
59 46 41
45.61 87.91
1948 total
146.7 125
94 73
58 47 42
36.34 81.31
745 6-10
Female
166.7 141
113 86
68 55 50.7 38.41
94.92 914
11-14
154 127
99 76
62 50 43
41.84 85.42
561 15-18
159 134
103 80
62.2 51
45 39.09 87.95
2220 Total
Discussion
In the present study, the mean TC, LDL, HDL, and TG were measured about158 (boys 156 and girls 159), 87.8 (boys 86.7 and girls 87.7), 49 (boys 49.2and girls 48.9), and 87.9 mg/dl in both sexes, respectively. According to the obtained results within 5th, 75th, 90th, and 95th percentiles of lipids, it can be concluded that with the exception of 5th percentile, total cholesterol of other percentiles in the cases of Birjand with the age group of 6-10 and 11-14 years old was higher than American ones (15). For the individuals of Birjand between 15-18 years,
equal to American findings, the other HDL percentiles were lower than American ones. In the age group of 10-14 years old, all of the percentiles of Birjand teens were lower than the American ones (15).
The 5th and 95th percentiles of HDL within male teens aged 15-18 years were higher than American ones but 10th percentile was equal and the rest percentiles of Birjand teens were lower than the American ones(15).In this study, the 5th, 75th, 90th, and 95th TG percentiles were higher than American ones in the all age groups (15). The study on the students of Birjand aged 6-12 years indicates all of TG percentiles and HDL percentiles were higher and lower than American cases, respectively(16). The results of a study on the 4824 students aged 6-18 from six Iranian cities (Tabriz, Rasht, Gorgan, Mashhad, Yazd, and Tehran)(17) and findings of a few related studies showed that percentiles of TG and HDL of Iranian adolescents were higher and lower, respectively than American and many other countries adolescents(18-20). In another study conducted by Kelishadi on 2000 students from Esfahan, Iran it was found that percentiles of TC, TG, LDL, and HDL were higher and lower than those of USA. She compared the results of two conducted studies in 1993 and 1999 and revealed the increasing of TC, LDL, and HDL levels (21). In another study conducted by her about students aged 6-18 from 23 Iranian provinces, mean and percentiles of TG and percentiles of TC, LDL, and HDL in Iranian children and adolescents were higher and lower, respectively than the LRC (lipid Research Clinic) level (22). Herein, percentiles of TG and most of HDL were lower than American cases. These findings are in agreement with other Iranian studies (17-20). However, there are
different reports about cholesterol and LDL. Some Iranian studies have reported higher amounts and some others have concluded lower amounts of cholesterol and LDL in comparison to American studies. In the present study, we found different values for different age groups. In summary, our results indicate that cholesterol amounts of the 6-10 and 11-14 age groups were similar to Esfahan study findings and higher than American outputs (22). TC in the age group of 15-18 were lower than that American (22). Also, the results about LDL in the age group of 6-10 years old was higher but in the 11-14 and 15-18 years old were lower than that American ones respectively. They were consistent with Kelishadi findings conducted in 23 Iranian provinces (21,22).
According to a study among the Korean students aged 10-18, all percentiles of TC for Korean adolescents were lower compared to American ones. Mean and 50th percentile of LDL in Korean adolescents were near to results of American research while 95th percentile was lower (23). Another study on Korean adolescents showed that TC and LDL were near to findings about American ones and HDL has lower value (24). It can be due to racial differences and environmental factors such as nutrition and sedentary lifestyle which they could be influenced on the normal and abnormal amount of children and adolescent dyslipidemia. In order to make a diagnosis of dyslipidemia, preparation of regional lipid percentiles within Iranian kids is recommended.
Conflict of Interest
Acknowledgment
The authors feel themselves obliged to the research assistant of BUMS for accepting their plan and paying the expense of the project. They also thank the authorities of Birjand Education Office and all of the students who took part in the study. They also thank the Department of Health for paying 50% of expense of the project.
References
1.World Health Organization (WHO). The global burden of disease: 2004 update [Internet]. Geneva: WHO; c2013 [cited 2013 Jan 15].
2. Aslam F, Hague A, Foody J, Lee LV. Peripheral arterial disease:current perspectives and new trends in management. South MedJ 2009; 102:1141–1149.
3. Statistics KoreaAnnual report on the cause of death statistics, 2010 [Internet]. Daejeon: Statistics Korea; [2013 Jan 9].
4. Expert Panel on Integrated Guidelines for Cardiovascular Health and Risk Reduction in Children and Adolescents: National Heart, Lung, and Blood Institute. Expert panel on integrated guidelines for cardiovascular health and risk reduction in children and adolescents: summary report. Pediatrics 2011; 128 Suppl 5:S213.
5. Kwiterovich PO, Jr. Recognition and management of dyslipidemia in children and adolescents. J Clin Endocrinol Metab 2008; 93:4200–4209.
6. Kavey RE, Daniels SR, Lauer RM, Atkins DL, Hayman LL, Taubert K, et al. American Heart Association guidelines for primary prevention of atherosclerotic cardiovascular disease beginning in childhood. Circulation 2003; 107: 1562– 1566.
7. Bao W, Srinivasan SR, Wattigney WA, Bao W, Berenson GS. Usefulness of childhood low-density lipoprotein cholesterol level in
predicting adult dyslipidemia and other cardiovascular risks. The Bogalusa Heart Study. Arch Intern Med 1996; 156:1315– 1320.
8. Li S, Chen W, Srinivasan SR, et al. Childhood cardiovascular risk factors and carotid vascular changes in adulthood: the Bogalusa Heart Study. JAMA 2003; 290: 2271–2276.
9. McGill HC Jr, McMahan CA, Zieske AW, Malcom GT, Tracy RE, Strong JP. Effects of nonlipid risk factors on atherosclerosis in youth with a favorable lipoprotein profile. Circulation 2001; 103:1546–1550.
10. Juonala M, Viikari JS, Ronnemaa T, Marniemi J, Jula A, Loo BM, et al. Associations of dyslipidemias from childhood to adulthood with carotid intima-media thickness, elasticity, and brachial flow-mediated dilatation in adulthood: the Cardiovascular Risk in Young Finns Study. Arterioscler Thromb Vasc Biol 2008; 28:1012–1017.
11. Bao W, Srinivasan SR, Valdez R, Greenlund KJ, Wattigney WA, Berenson GS. Longitudinal changes in cardiovascular risk from childhood to young adulthood in offspring of parents with coronary artery disease: the Bogalusa Heart Study JAMA. 1997; 278: 1749 –1754.
12. Sarraf-Zadegan N, Boshtam M, Malekafzali H, Bashardoost N,Sayed-Tabatabaei FA, Rafiei M, et al. Secular trends in cardiovascular mortality in Iran, with special reference to Isfahan. Acta Cardiol 1999; 54: 327–33.
13. Taheri F, Kazemi T, Chahkandi T, Namakin K, Zardast M, Bijari B. Prevalence of Overweight ,Obesity and Central Obesity among Elementary School Children in Birjand, East of Iran,2012. JRHS 2013; 13(2): 157-161.
15. Charles A, Stanley and Michael J, Bennett. Defects in Metabolism of Lipids. In: Behrman RE, Kliegman RM, Jenson HB, eds. Nelson Textbook of Pediatrics.18th ed. Philadelphia: WB Saunders; 2007. P. 589. 16. Fesharakinia A, Zarban A,Sharifzadeh
GR.Lipid Profiles and Prevalence of Dyslipidemia in Schoolchildren in South Khorasan Province, Eastern Iran. Arch Iranian Med 2008; 11 (6): 598 – 601. 17. Hosseini SM, Amir Khani MA, Rafii
Babaki M, Ardalan K, Akbari S, Poor Safa P. Evaluation of reference percentiles lipid in Iranian children and adolescents using the LMS method and penalized likelihood Data: Caspian study. Qom Univ Med Sci J 2011; 5(2): 51-58.
18. Kelishadi R. Childhood overweight, obesity and the metabolic syndrome in developing countries. Epidemiol Rev 2007; 29:62–76.
19. Azizi F, Rahmani M, Madjid M, Allahverdian S,Ghanbili J, Ghanbarian A,et al. Serum lipid levels in an Iranian population of children and adolescents: Tehran lipid and glucose study. Eur J Epidemiol 2001; 17: 281 –288.
20. Esmaillzadeh A, Mirmiran P, Azadbakht L, Etemadi A, Azizi F. High prevalence of the metabolic syndrome in Iranian adolescents. Obesity. (Silver Spring) 2006; 14: 377–82.
21. Klishadi R, Pour MH, Zadegan NS, Kahbazi M, Sadry G, Amani A, et al. Dietary fat intake and lipid profiles of Iranian adolescents: Isfahan healthy heart program-heart health promotion from childhood. Prev Med 2004; 39:760 –766. 22. Kelishadi R, Ardalan G, Gheiratmand R,
Ramazani A. Family History of Premature Cardiovascular Disease Appropriate for Detection of Dyslipidemic children in Population –Based Preventive Medicine Program.CASPIAN Study. Pediatr Cardiol 2006; 27:729-736.
23.Yang S, Hwang JS, Park HK, Lee HS, Kim HS, Kim EY, et al. Serum Lipid Concentrations ,Prevalence of Dyslipidemia, and Percentage Eligible for pharmacological Treatment of Korean Children and Adolescents ;Data from the Korea National Health and Nutrition Examination Survey IV (2007-2009). PLOS ONE 2012; 7(12) e 49253.