Formation and Neuronal Activity in the Amygdala
Anna E. Skrzypiec1, Rahul S. Shah2,3, Emanuele Schiavon2, Eva Baker2, Nathan Skene5, Robert Pawlak1*,
Mariusz Mucha2,4
1University of Exeter Medical School, Exeter, United Kingdom,2Department of Cell Physiology and Pharmacology, University of Leicester, Leicester, United Kingdom, 3Department of Neurosurgery, Wessex Neurological Centre, Southampton, United Kingdom,4Wolfson Institute for Biomedical Research and Department of Cell and Developmental Biology, University College London, London, United Kingdom,5Wellcome Trust Sanger Institute, Cambridge, United Kingdom
Abstract
Behavioural adaptation to psychological stress is dependent on neuronal plasticity and dysfunction at this cellular level may underlie the pathogenesis of affective disorders such as depression and post-traumatic stress disorder. Taking advantage of genome-wide microarray assay, we performed detailed studies of stress-affected transcripts in the amygdala – an area which forms part of the innate fear circuit in mammals. Having previously demonstrated the role of lipocalin-2 (Lcn-2) in promoting stress-induced changes in dendritic spine morphology/function and neuronal excitability in the mouse hippocampus, we show here that the Lcn-2 gene is one of the most highly upregulated transcripts detected by microarray analysis in the amygdala after acute restraint-induced psychological stress. This is associated with increased Lcn-2 protein synthesis, which is found on immunohistochemistry to be predominantly localised to neurons. Stress-naı¨ve Lcn-22/2mice
show a higher spine density in the basolateral amygdala and a 2-fold higher rate of neuronal firing rate compared to wild-type mice. Unlike their wild-wild-type counterparts, Lcn-22/2 mice did not show an increase in dendritic spine density in
response to stress but did show a distinct pattern of spine morphology. Thus, amygdala-specific neuronal responses to Lcn-2 may represent a mechanism for behavioural adaptation to psychological stress.
Citation:Skrzypiec AE, Shah RS, Schiavon E, Baker E, Skene N, et al. (2013) Stress-Induced Lipocalin-2 Controls Dendritic Spine Formation and Neuronal Activity in the Amygdala. PLoS ONE 8(4): e61046. doi:10.1371/journal.pone.0061046
Editor:Ulrike Schmidt, Max Planck Institute of Psychiatry, Germany
ReceivedSeptember 17, 2012;AcceptedMarch 5, 2013;PublishedApril 9, 2013
Copyright:ß2013 Skrzypiec et al. This is an open-access article distributed under the terms of the Creative Commons Attribution License, which permits unrestricted use, distribution, and reproduction in any medium, provided the original author and source are credited.
Funding:This work was supported by a Marie Curie Excellence Grant MEXT-CT-2006-042265 from the European Commission (http://www.cordis.europa.eu/ mariecurie-actions/ext/home.html), Medical Research Council Project Grant G0500231/73852 (http://www.mrc.ac.uk/index.htm) and the COST Action ECMNet, BM1001. The funders had no role in study design, data collection and analysis, decision to publish, or preparation of the manuscript.
Competing Interests:The authors have declared that no competing interests exist.
* E-mail: [email protected]
Introduction
Prolonged or traumatic stressful events influence neuronal morphology and function in distinct brain regions such as the amygdala and hippocampus, a process which may give rise to affective disorders. The amygdala consists of an almond-shaped group of nuclei located deeply within the medial temporal lobes and is responsible for fear memory formation, consolidation and retention [1]. During fear processing, the amygdala is undergoing dynamic changes including extracellular protease activation [2], proteolytic cleavage of synaptic receptors [3] and dendritic arborisation [4]. Such changes require the synchronization and tight control of gene expression and protein synthesis.
Stress hormone release can activate cascades of gene expression, affecting central nervous system function and animal behaviour. Upon agonist binding, glucocorticoid receptors translocate into the cell nucleus and bind to DNA glucocorticoid response elements to positively [5] or negatively [6] affect transcription of target genes. They may also alter neuronal plasticity by inducing synthesis or activation of extracellular proteases. Harada et al. [7] showed that corticosterone release in response to psychological stress increases the expression and release of neuropsin to regulate neuronal plasticity [8]. Stress hormones also influence gene expression indirectly through regulation of post-translational protein phosporylation by MAPK and Egr-1 pathways [9]
including histone phosphorylation [10]. Other stress-induced histone modifications linked with the stress response such as acetylation [11] and methylation [12] can also change gene expression patterns.
Due to technical difficulties, most studies have focussed on regulation and expression of single or small group of genes responding to psychological stress. Here we took advantage of microarray technology allowing genome-wide analysis of gene expression in amygdala of acutely restrain-stressed mice. Among the positively regulated transcripts we found well known stress-related genes regulated by glucocorticoids including Sgk1 [13], Fkbp5 [3] and Map3k6 [14].
amygdala provide a novel mechanism for stress-induced neuro-plasticity and may contribute to anxiety behaviour.
Results
Microarray Analysis of Restraint-stress Induced Genes in Mouse Amygdala
To identify genes contributing to the stress response we subjected wild-type mice to acute restraint stress and performed genome-wide gene expression profiling in the amygdala using microarrays. The principal component analysis of obtained data revealed existence of two relatively distinctive subpopulations of data points resulting from restraint stress (Fig. 1A). Next, we verified the general distribution of stress-affected transcripts using volcano plot (Fig. 1B). We found that the restraint stress affected expression of specific gene (FC$1.3 and FC# 21.3, adjusted
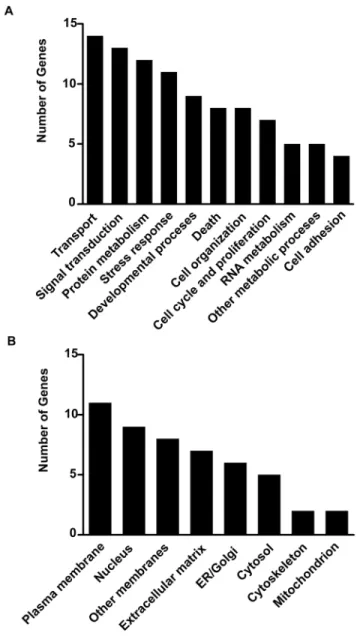
p-value#0.05) (Fig. 1B–C and Table 1). The transcripts encoding nuclear and membrane proteins represented almost half of stress affected genes. This would be consistent with the membrane-to-nucleus signalling and activity-driven transcription contributing to stress-induced regulation of cellular responses (Fig. 2). Functional analysis revealed that the majority of the regulated genes were involved in the control of cellular transport, signal transduction, protein metabolism and the stress reponse. Several of these genes have been shown to be regulated by glucocorticoids (e.g. Fkbp5, Map3k6 and Sgk1) confirming the central role of these hormones in the adaptation of the central nervous system to stress (for review see [20]). Gene over- and underrepresentation analysis (Table 2) revealed the existence of 16 gene ontology functional/structural subcategories overrepresented significantly. We also examined microarray data looking for alternative splicing events induced by stress by comparing the mean signal of all probe sets annotated to
Figure 1. Microarray analysis of gene expression in the amygdala following acute restraint stress. A. Principal component analysis of microarray data obtained by hybridization of mRNA extracted from amygdalae of wild-type control (n = 5) and stressed (n = 5) mice. The figure represented the first three principal components of microarray analysis data (PC1, PC2 and PC3). The analysis of microarrays revealed the existence of two relative distinctive components of 5 metasets of control (red) and stress-affected (blue) gene expression patterns.B.The volcano plot depicting the range of gene expression fold-change (log2[fold change]) induced by restraint stress and corresponding p-value (-log10[uncorrected p-value]).
Using the threshold cut-off of an absolute 1.3 fold-change and corrected p-value #0.05, statistically significant genes are marked in red.C. Hierarchical clustering of normalised signal intensities read from microarray probe sets.D. qRT-PCR verification of example genes identified as upregulated in response to restraint stress. The basal level of expression is marked by the red dashed line.
all exons of stress regulated genes (Fig. 3). We found no stress-related alternative splice variants within the above group of genes.
Lipocalin-2 is Upregulated by Stress and Expressed by Neurons in the Amygdala Complex
Microarray analysis revealed lipocalin-2 (Lcn-2) as a highly upregulated gene in the amygdala in response to restraint stress (Table 1). Because of the technical complexity of the microarray design the results might be biased by either high homology among genes or cross-hybridization between probes, leading to either false-positive findings or underestimation of differentially ex-pressed transcripts. To confirm our microarray data we performed qRT-PCR and found a,13-fold upregulation of the Lcn-2 gene
in response to restraint stress in the amygdala (Fig. 4A; n = 5; p,0.001). Similarly, Western blotting demonstrated an upregula-tion of Lcn-2 protein after stress (Fig. 4B and 4C; n = 3; p,0.01) suggesting that the transcriptional regulation of the Lcn-2 gene is accompanied by analogous changes in protein synthesis.
Next, we performed immunohistochemistry to determine where Lcn-2 is primarily expressed in the amygdala. We found high levels of Lcn-2 in the central nucleus and the basolateral complex of the amygdala (Fig. 4D a–d). We also detected considerable amounts of Lcn-2 in the brain parenchyma (not shown) consistent with previous reports of its extracellular release [21]. We performed the immunohistochemistry on both stressed and stress-naı¨ve animals, however we saw no obvious differences in signal localisation (not shown).
Neuronal adaptation to external stimuli can be modulated by a variety of cell types including vascular components or glial cells [22]. To investigate in what cell types Lcn-2 was expressed we performed triple staining using cell-type specific markers (Fig. 4D e–h). Lipocalin-2 co-localized mainly with a neuronal marker NeuN and to a much lesser extent with the astrocyte marker glial acidic fibrillary protein (GFAP) indicating that it was predomi-nantly expressed by neurons.
Lipocalin-2 Regulates Stress-induced Changes in Spine Density and Function and Regulates Neuronal Excitability
Neuronal plasticity is, in part regulated by dendritic spine density and morphology. We examined whether Lcn-2 affects dendritic spine densityin vivoin amygdala. Basolateral amygdala
neurons were labelled with DiI in wild type and Lcn-22/2 mice and spine density and morphology examined according to the previously published criteria [23]. Stress-naive Lcn-22/2animals showed higher spine density in the basolateral complex of the amygdala (p,0.01) when compared to wild-type controls (Fig. 5A). Baseline spine morphology did not differ between the genotypes (Fig. 5B). To investigate whether lipocalin-2 affects experience-driven spine plasticity we performed DiI labelling in Lcn-22/2 and wild-type amygdala neurons ex vivo after stress (Fig. 5A).
Because single session of restraint stress appeared not to be sufficient to trigger persistent changes at dendritic spine level in amygdala (data not shown), we decided to perform 3 restraint sessions to assess if such changes could be precipitated by repeated stress. We found no increase in spine density after stress in amygdala of Lcn-22/2animals while in wild-type mice we found a ,15–20% increase in spine density, confirming previously
reported observations [24]. In wild-type animals, after stress, the spine density reached the density of spines observed in stress-naı¨ve Lcn-22/2mice (Fig. 5A F(3,67)= 5,436).
We next considered a possibility that Lcn-2 might regulate either basal or stress-induced changes in spine morphology/ maturation. We found that stress caused a decrease in the proportion of the mushroom spines in the basolateral complex of the amygdala, equally pronounced in both genotypes (Fig. 5B-C). There was also a concomitant increase in the proportion of stubby and thin spines in response to stress in both Lcn-22/2and wild type mice. Both groups also showed an increase in the proportion of irregular spines after stress, but a significant rise in filopodia was only seen in wild-type animals (Fig. 5B).
Changes in dendritic spine density or morphology may strongly modify electrophysiological properties of neurons [25]. Thus, we examined whether lipocalin-2-induced changes in dendritic spine phenotype could alter neuronal excitability in current clamp recordings. We found that neurons from the basolateral amygdala of Lcn-22/2 mice were more excitable and fired more action potentials than neurons from wild-type mice under the same conditions (Fig. 6A–C), consistent with a higher number of dendritic spines in Lcn-2 deficient animals.
Figure 2. General characterisation of restraint stress affected transcripts. Stress affected transcripts divided according to their protein product function (A) and localisation (B).
Discussion
Stressful events activate multiple metabolic pathways enforcing neuroplastic changes on synaptic and neuronal levels to enhance learning and memory [26], [27]. Nonetheless, prolonged or traumatic stress may lead to maladaptive forms of neuroplasticity and thus affect learning and memory [28], [29], [30].
The basolateral amygdala plays a role in processing and storing emotional aspects of experiences, allowing fast recognition and classification of experiences as positive or aversive, and facilitating an appropriate response to environmental stimuli. As such, detection and characterisation of specific neuromodulators affect-ing amygdala function may provide a target for drug design in conditions such as depression [31] or post-traumatic stress disorder
[4]. To identify candidate neuromodulators we undertook genome-wide microarray assay and found that the transcript for lipocalin-2 showed the highest level of upregulation in response to restraint stress in the mouse amygdala.
Lipocalin-2 is a member of a small extracellular protein family, binding and transporting small hydrophobic molecules such as bilins, retinoids, lipids and steroids [32], [33], [34]. Lipocalins share similar protein architecture and to some degree amino acid sequence homology [16], [35]. They play important role in diverse processes including cell viability, cancer invasiveness, apoptosis and angiogenesis [36], [37], [38], [39].
In the central nervous system, it has been shown that lipocalin-2 is a modulator of deramification and apoptosis of activated microglial cells [40], reactive astrocytosis in response to brain
Figure 3. Alternative splicing analysis.Example of alternative splicing analysis of Lcn-2 (A,B) and Cdkn1a (C,D) genes expressed in response to restraint stress. Analysis of mean signal intensities read from probe sets annotated to 59, 39untranslated regions (UTRs) and exons of Lcn-2 (a’ and a’’ respectively) and Cdkn1a transcripts (c’ and c’’ respectively) revealed no alternative splicing events in Lcn-2 transcript. Analysis of Cdkn1a transcript revealed reduced level of expression of probe set 5530406 annotated to untranslated exon 2 (Cdkn1a transcript variant 2, NM_001111099) in both control and stressed animals suggesting tissue specific alternative splicing unrelated to stress. Scatter plots of summarised intensities of all probe sets annotated to Lcn-2 (B) and Cdkn1a (D) transcripts revealed two relatively separate populations of stress related data points and no outliers significantly affecting splice variant analysis. Each point represents the mean of all probe set intensities annotated to the gene of interest from one array. Data presented as mean6SEM.
injury [21] and increased plasma Lcn-2 levels have been shown to positively correlate with mild cognitive impairment [41]. Increased levels of lipocalin-2 considered together with its iron transport abilities may partially explain the accumulation of iron in brain associated with Alzheimer’s disease [42], Parkinson’s disease [43] and multiple sclerosis [44]. Devireddy and colleagues [45] showed that Lcn-2 binds to extracellular iron and is transported into cells where it releases iron for storage. However, low extracellular iron levels cause internalisation of free Lcn-2 (Apo-Lipocalin), which
then binds intracellular iron and transports it to the extracellular space. In neurons, this decrease of internal iron concentration activatesBim, a proapoptotic member of theBcl-2family of
cell-death regulators, and induces apoptosis.
Psychological stress triggers changes in neuronal morphology in stress-processing brain areas like the basolateral amygdala and hippocampus. Vyas and colleagues [46] have shown that chronic unpredictable stress causes atrophy of dendritic processes in
Table 1.List of amygdalar transcripts affected by acute restraint-stress.
Gene Symbol Entrez_gene_id P-value Adjusted P-valueBH Adjusted P-valueB Log (Fold-Change)
Fkbp5 14229 3.69E-09 2.35E-05 4.52E-05 1.49
Xdh 22436 4.01E-09 2.35E-05 4.90E-05 1.37
Cdkn1A 12575 5.76E-09 2.35E-05 7.05E-05 1.54
Mfsd2A 76574 3.01E-08 9.20E-05 3.68E-04 1.23
Pnpla2 66853 4.91E-08 1.20E-04 6.01E-04 0.91
Plin4 57435 7.83E-08 1.60E-04 0.001 1.359
Sult1A1 20887 2.24E-07 3.78E-04 0.003 1.232
2010002N04Rik 106878 2.47E-07 3.78E-04 0.003 0.980
Lcn2 16819 7.97E-07 0.001 0.010 1.547
Acer2 230379 8.55E-07 0.001 0.010 0.768
Fmo2 55990 1.33E-06 0.001 0.016 0.759
Angptl4 57875 1.72E-06 0.002 0.021 0.928
Arrdc2 70807 2.01E-06 0.002 0.025 0.648
Hif3A 53417 2.05E-06 0.002 0.025 0.779
Tlr7 170743 3.40E-06 0.003 0.042 1.303
Htra1 56213 3.77E-06 0.003 0.046 0.671
Cmtm3 68119 5.00E-06 0.004 0.061 0.706
Pla2G3 237625 5.56E-06 0.004 0.068 0.615
Ucp2 22228 6.17E-06 0.004 0.076 0.932
Mertk 17289 7.22E-06 0.004 0.088 0.717
Map3K6 53608 8.41E-06 0.005 0.103 0.647
Slc2A1 20525 1.08E-05 0.006 0.133 0.912
Tsc22D3 14605 1.36E-05 0.007 0.166 0.871
Slc24A4 238384 1.42E-05 0.007 0.174 0.491
Nfkbia 18035 1.86E-05 0.009 0.228 0.853
Pkp2 67451 3.64E-05 0.017 0.445 0.816
Klf15 66277 3.72E-05 0.017 0.455 0.652
Sgk1 20393 4.19E-05 0.018 0.513 0.900
Dio2 13371 6.20E-05 0.026 0.758 0.839
Lfng 16848 6.59E-05 0.026 0.806 0.561
Slc38A5 209837 6.69E-05 0.026 0.818 20.570
Nr4A1 15370 7.07E-05 0.027 0.865 20.492
Klk1B11 16613 9.70E-05 0.034 1.000 20.911
Dclre1B 140917 9.75E-05 0.034 1.000 0.690
Usp54 78787 9.76E-05 0.034 1.000 0.614
Npas4 225872 9.94E-05 0.034 1.000 20.608
Olfr146 258742 1.30E-04 0.043 1.000 20.602
Camk1G 215303 1.35E-04 0.043 1.000 0.594
The list of transcripts affected by restraint stress as compared to control (stress-naı¨ve) mice. Genes are organised by statistical significance (lowest to highest p-value). P-values were adjusted according to the Benjamini & Hochberg (BH) or Bonferroni (B) method. n = 5 microarrays per group, each microarray chip hybridised with pulled
hippocampal CA3 pyramidal neurons accompanied by hypertro-phy of dendritic processes in basolateral amygdala.
We have previously shown Lcn-2 gene to be upregulated in the hippocampus following stress, and that cultured hippocampal neurons treated with Lcn-2 purified protein had a reduced dendritic spine density [19]. We also found that lipocalin-2 affects spine density and morphology by changing the actin turnover within spines, an effect which was dependent on Lcn-2 iron binding ability.
Here we have shown that stress-naı¨ve Lcn-2 knockouts have a higher spine density compared to WT mice in the amygdala (as also described in the hippocampus), and this is associated with an increase in neuronal excitability. However, there are several important differences in the phenotype of stress-induced changes in neuronal morphology between the hippocampus and amygdala in Lcn-22/2and wild-type mice.
In the amygdala, there is no significant increase in spine density after acute stress in Lcn-22/2mice, but stress does increase spine density in wild-type mice by 15–20% (to a level comparable to seen in pre-stress Lcn-2 knockouts). By comparison in the hippocampus, both Lcn-22/2 and wild-type mice show an increase in spine density following acute stress. In the hippocampal CA3 region, this increase is similar in magnitude in both groups, while in CA1 neurons the increase is greater in Lcn-22/2 mice compared to that seen in wild-types [19].
Acute stress also has a differential effect on the expressed dendritic spine phenotype. In the amygdala, stress causes a re-duction of mushroom spines and a concomitant increase in stubby, thin and irregular spines in both Lcn-2 knockouts and wild-type mice, and increased filopdia in wild-type mice only. Post-stress hippocampi of lipocalin-2 knockouts show an increase in mushroom spines in CA1 and CA3 neurons, and a concomitant reduction in stubby and thin spines. In contrast, wild-type hippocampi showed an increase in stubby and thin spines in CA1 and CA3 regions without any change in mushroom spine frequency after stress.
The increase in the number of immature, neuroplastic spines (filopodia and thin) which are believed to have a potential role in memory formation [47] as well as a concomitant decrease in mushroom spines (believed to be responsible for memory storage) in wild-type amygdala after stress suggests their involvement in fear memory selection. Based on those findings we hypothesize that decrease in percentage of mushroom synapse-prone spines may be a part of adaptation process leading to decrease fear/stress associated memories while a plastic population of thin and filopodia spines kept in a ‘‘potential state’’ to form mushroom spines represents the reserve neural substrate for memory formation and storage. The absence of a rise in filopodia in Lcn-2 knockout mice may account for previous findings which show that they are more anxious in response to stress when compared to wild-type controls [19], suggesting enhanced
Table 2.Statistical analysis of over-represented Gene Ontology groups of restraint-stress regulated transcripts.
Gene Ontology subcategory Expected gene number Observed gene number Adjusted p-value
Cellular process 9.8499 22 0.0001
Metabolic process 6.2689 18 0.0001
Regulation of biological quality 1.2781 9 0.0002
Positive regulation of cellular process 1.4402 9 0.0005
Positive regulation of metabolic process 0.7786 7 0.0006
Cytoplasmic part 3.6616 13 0.0011
Positive regulation of biological process 1.618 9 0.0012
Cellular metabolic process 5.2917 15 0.0024
Response to chemical stimulus 0.972 7 0.0027
Protein binding 4.6657 14 0.0029
Positive regulation of macromolecule metabolic process 0.7006 6 0.0041
Positive regulation of cellular metabolic process 0.7214 6 0.0049
Catalytic activity 4.2409 13 0.0054
Cytosol 0.4925 5 0.0086
Response to stress 1.1836 7 0.0093
Cytoplasm 5.9065 15 0.0094
Cell part 12.533 22 0.0102
Cell 12.534 22 0.0103
Intracellular part 8.4557 18 0.0104
Intracellular 8.6594 18 0.0147
Response to stimulus 2.3055 9 0.0196
Regulation of apoptosis 0.6096 5 0.0232
Regulation of programmed cell death 0.6174 5 0.0246
Regulation of cell death 0.6286 5 0.0267
Sixteen Gene Ontology (GO) subcategories were over-represented in the group of 38 stress-affected genes. Only GO categories with 5 or more stress affected genes are shown. The p-values were adjusted according to the Bonferroni’s method. The subcategories were ordered accordingly to p-values.
emotionality and/or memory storage. In addition to our findings in the hippocampus, the evidence presented here suggests that the basolateral amygdala of lipocalin-2 deficient mice may also contribute to increased anxiety-like behaviour through aberrant dendritic spine plasticity and higher neuronal excitability.
Lipocalin-2 affects spine density, electrophysiological properties of neurons as well as stress-related animal behaviour and in future it will be crucial to clarify the metabolic pathways involved in this phenomenon. As such, performing microarray analysis in control and stressed lipocalin-2 knockouts and comparing to our own data could help identify co-regulated transcripts which are key in regulating responses to stress and anxiety.
In summary, distinct, region-specific neuronal changes pro-duced by lipocalin-2 upon stress in the amygdala and hippocam-pus contribute to our understanding of adaptive and maladaptive processes that may underlie the development of stress-related psychiatric disorders.
Materials and Methods
Animals
Ethic statement. The experiments were approved by the UK Home Office and the UoL Ethical Committee.
Experiments were performed on three-month old male wild-type (C57/BL6) or Lcn-22/2 mice (generous gift of Dr. Alan Aderem) [17] backcrossed to C57/BL6. Mice were genotyped as described [17]. Animals were housed three to five per cage in a colony room with a 12 hour light/dark cycle (lights on at 7AM) withad libitumaccess to commercial chow and tap water.
Restraint Stress
Prior to experiments mice were kept undisturbed for one week in their home cages. Restraint stress was performed during the light period of the circadian cycle as described [48]. Control animals were left undisturbed, and stressed animals were subjected to a six hour restraint stress session either once or on three consecutive days in a separate room. The mice were placed in their home cages in wire mesh restrainers secured at the head and tail ends with clips. A single session of restraint stress was applied before microarray studies, qRT-PCR analysis and western blotting whereas 3 consecutive restraint sessions were performed prior to spine density and morphology studies.
Microarray Study
Amygdalae were dissected from wild-type mice, either naı¨ve or subjected to a 6 hour restraint stress (15 animals per group) using a dissecting microscope in ice-cold ACSF buffer (25 mM glucose, 115 mM NaCl, 1.2 mM NaH2PO4?H2O, 3.3 mM KCl, 2 mM
CaCl2, 1 mM MgSO4, 25.5 mM NaHCO3, pH 7.4). Tissue
samples were kept submerged in RNAlater (Invitrogen) at220uC before later processing Total RNA was extracted (RNeasy Lipid Tissue Mini Kit, Qiagen) and the ribosomal fraction reduced (RiboMinus Kit, Invitrogen). RNA integrity has been verified by electrophoresis using Agilent Bioanalyser 2100 (Agilent Technol-ogies). RNA pulled from 3 animals has been reverse-transcribed and hybridized with GeneChip Mouse Exon 1.0 ST Array (Affymetrix). The quality of the Mouse Exon 1.0 ST Array data was checked according to the Affymetrix guidelines using the Expression Console software (Affymetrix). The microarray analysis method was performed using a combination of Affymetrix
Figure 4. Lipocalin-2 is upregulated by psychological stress in mouse amygdala.Psychological stress induces lipocalin-2 gene expression N = 5, ** p,0.01 (A) followed by protein synthesis (BandC); R-Lcn-2– recombinant lipocalin-2 N = 3, ** p,0.01. Data are expressed as mean6SEM. Panel C consist representative Western blot. Triple immunohistochemistry revealed (D) that Lcn-2 (green) is localised mostly within and nearby of neurons (a and e) co-localised with neuronal marker (b and f) NeuN (red) and to lesser extend with astrocyte marker (purple) GFAP (c and g) in the nucleus of basolateral amygdala. The secondary antibody showed no signal resulting from nonspecific binding (h). LA, Lateral Amygdala; BLA, Basolateral Amygdala; CA, Central Amygdala. Quantitative RT-PCR reaction confirmed lack of expression of Lcn-2 gene in Lcn-22/2animals (E).
Powertools, Partek Genomic Suite (Partek, St. Louis, MO, USA), R platform, Bioconductor, and Limma [49] software. The general schema of analysis followed is as previously described [50]. The CEL files were read and processed with apt-probeset-summarize, and normalized using Robust Multichip Average-Sketch. Only the probes from the core annotation set with cross hybridization values of 1 were used. If at least half of the probes for a gene were not detected above background (p,0.05) in at least three arrays from one class the gene was dropped from further analysis (reducing the total number of genes studied from 23,332 to 12,230 which is in line with the number of genes expected to be expressed in the brain). Partek Genomic Suite was used for primary component analysis and alternative splicing analysis, Apt-Midas was used for verification of differential splicing events, and Limma was used to look for differential gene expression with Benjamini and Hochberg or Bonferroni corrections applied to all p-values. CEL files has been deposited at MAGE-TAB ArrayExpress (http://www.ebi.ac. uk/cgi-bin/microarray/magetab.cgi, accession number E-MTAB-1519).
Gene function and gene product localisation analysis was performed using MGI Gene Ontology GO Slim Chart Tool (http://www.informatics.jax.org/gotools/MGI_GO_Slim_Chart. html) with default parameters. The gene under- and over-representation analysis was performed using Gene Trail software [51] (http://genetrail.bioinf.uni-sb.de/index.php) with the mini-mal number of genes per group set as 5 and Bonferroni correction of p-values.
qRT-PCR
Control and stressed mice were anaesthetised intraperitoneally using sodium pentobarbital (50 mg/kg) and perfused transcar-dially with ice cold PBS. The brains were removed and dissected in ice-cold PBS using a vibrating microtome (Campden Instru-ments). The amygdalae were dissected from a coronal slice20.58 to 22.3 mm relative to Bregma. Samples were submerged in RNAlater (Invitrogen) at 220uC, homogenised in QIAzol lysis reagent (QIAgen) and total RNA was isolated (RNeasy Lipid tissue mini kit, QIAgen). A total of 2mg of RNA from each sample was converted to cDNA using Superscript III (Invitrogen) and oligo (dT) primers according to manufacturer’s instructions. To verify the microarray data RNA samples from 5 control and 5 stressed animals (i.e. 5 out of 15 for each group) used previously for array hybridisation were randomly chosen, reverse-transcribed and used as templates for qRT-PCR.
qRT-PCR for Lcn-2 was performed using Chromo4/PTC-200 thermal cycler (MJ research) as follows: 95uC for 15 minutes, 94uC for 15 seconds, 55uC for 30 seconds, steps 2–4 were repeated 40 times, 72uC for 30 seconds. The following primers were used for Lcn-2 gene expression quantification: 59 -CCCCATCTCTGCT-CACTGTC and 59-TTTTTCTGGACCGCATTG. The Cdkn1a, Fkbp5, Xdh and Sult1a1 were quantified using primers: 59-AAAGTGTGCCGTTGTCTCTTC and 59 -CAAAGTTC-CACCGTTCTCG, 59-CCCTGGTGAAGATGCAGAG and 59-GGGGTCAATGCCAAACTTAG, 59 -CTCCAAGTAT-GACCGCCTTC and 59-TCCTATGCCTTCCACAGTTG, 59 -GCTCAGAACCCCAGCAAC and 59
-CTCCATTGTCTCCG-Figure 5. Lipocalin-2 regulates basal and stress-induced changes in dendritic spine density. Dendritic spine density in DiI-labeled neurons was analyzed in basolateral amygdala of wild-type and Lcn-22/2mice before and after restraint stress. (A) Stress caused an increase in spine density in the neurons of BLA in wild-type mice reaching density observed in Lcn-2-deficient stress naı¨ve mice. (B) Stress induced also significant decrease in proportion of mushroom spines observed in both wild-type and Lcn-22/2strains. Those changes were accompanied by increase in other morphological groups of spines (B). Panel C represents the example of DiI stained neurons. *p,0.05; **p,0.01; ***p,0.001. Data are expressed as mean6SEM.
CAAAG respectively. No-template control reactions were run in parallel.
Western Blotting
Control and stressed mice (different than in microarray study) were anaesthetised intraperitoneally using sodium pentobarbital and perfused transcardially with ice cold PBS. The brains were removed and the amygdalae dissected as above, homogenized in 0.1 M Tris, 0.1% Triton X-100, pH 7.4, containing protease inhibitors (Complete, Roche) and the protein concentration was adjusted to 2 mg/ml using the Bradford method (Pierce). Reduced (DTT) and denatured (100uC for 5 minutes) samples (40mg per lane) were subjected to SDS-PAGE electrophoresis and transferred onto nitrocellulose membrane. After blocking (5% skim milk for 1 h at RT) and washing with TBS-T (365 mins) the membranes were probed with goat anti-Lcn-2 antibody (R&D, 1:500) over-night at 4uC. The membranes were then washed in PBS-T (3610
min) before incubation with a relevant HRP-conjugated secondary antibody (Vector Labs, 1:1000, 1 hr, RT). The signal was developed, after washing with TBS-T (6610 min), using a Western
Blot Luminol Reagent (Santa Cruz). To normalise the results the membranes were stripped, blocked, washed as above and re-blotted using mouse anti-b-actin antibody (Sigma, 1:2500, 1 hr, RT).
Immunohistochemistry
Mice were anaesthetised with sodium pentobarbital and transcardially perfused with ice-cold phosphate buffered saline (PBS) containing protease inhibitors (Complete, Roche) followed by ice-cold 4% paraformaldehyde (Sigma) in PBS. The brains were dissected and fixed in 4% paraformaldehyde in PBS
overnight at 4uC. The paraformaldehyde was washed out and 70mm thick coronal sections were collected using vibrating blade microtome. Brain sections were preincubated in PBS-T (PBS solution containing 0.5% bovine serum albumin, 0.02% Triton X-100 and normal goat serum (1:500) for 5 hours at room temperature. Sections were then incubated with goat anti-Lcn-2 antibody (R&D, 1:500) along with the mouse anti-NeuN (1:200, Chemicon) and chicken anti-GFAP (1:1000, Dako) overnight at 4uC in PBST. Next, the sections were washed for 8–10 hours with PBS-T and incubated overnight with appropriate AlexaFluor secondary antibodies (1:500, Molecular Probes) in the same buffer. Control sections were processed as above but the primary antibodies were omitted. Sections were then washed in PBS-T for 5 hours, mounted on glass slides using Vectamount medium (Vector Laboratories), and photographed using Zeiss LSM 5 Exciter confocal microscope.
Electrophysiology
Whole-cell recordings in current clamp configuration: coronal slices (250mm) were obtained from 10–20 days old mice. The animals were anaesthetized with ketamine/xylazine (2:1 ratio; 2.4ml/g i.p.). Neurons were visualized by infrared videomicro-scopy (CCD camera KP-M2RP) and recordings made from somata of principal neurons of the basal nucleus of the amygdala (n = 14 and n = 15 respectively). Principal neurons and interneur-ons were distinguished by their morphological and electrophysi-ological properties. Only neurons with a resting membrane potential below 250 mV were used. The cell membrane was clamped at280 mV. Input resistance and instantaneous frequen-cy were derived from traces in which cells were injected with 200 ms current pulses (2100 to+600 pA: 50 pA increments). The
Figure 6. Region-specific control of neuronal excitability by lipocalin-2.Current-clamp experiments revealed that neuronal firing rate in the basolateral amygdala is higher in Lcn-22/2mice when compared to Lcn-2+/+animals. Voltage responses were recorded by current steps from2100 to+600 pA in 50 pA (starting membrane potential280 mV) from principal neurons of the basal nucleus of the amygdala. Number of action potential spikes was counted as a function of depolarizing current injection (A). Disruption of the lipocalin-2 gene significantly increased action potential firing rate in Lcn-22/2animals (p,0.01 at 150 pA; p,0.05 at 200 pA). PanelBshows a significant increase in the mean input resistance in Lcn-22/2mice compared to wild-type animals. *p,0.05; PanelCis example of neuronal firing trace. Data are expressed as mean6SEM.
recording electrodes were borosilicate glass pipettes (2–4 MV) filled with the following solution (in mM): K-gluconate (130), KCl (4), EGTA (0.5), HEPES (10), glucose (5). ACSF composition (in mM): NaCl (124); KCl (5); NaH2PO4 (1.25); D-glucose
(10);NaHCO3 (26); CaCl2 (2); MgSO4 (1). All the experiments
were performed at 25uC. The recordings were amplified (multi-clamp 700b Axon instruments), filtered (10 kHz), digitized 50 kHz (digidata 1440A Axon instruments) and stored in a PC. pClamp 10 (Axon Instruments) and Origin 7 (Microcal Inc.) software were used during data acquisition and analysis.
DiI Labelling
DiI labelling was performed as previously described [52]. Briefly, the animals were anaesthetised and transcardially perfused with PBS followed by 1.5% paraformaldehyde. The brains were dissected and kept for 1 hour in 1.5% paraformaldehyde at RT and 170mm coronal slices containing the amygdalae were cut on vibrating microtome. DiI cristals (Molecular Probes) were applied using borosilicate glass pipette and the slices were kept for 24 hours at RT. Sections were then fixed with 4% paraformaldehyde for 35 min, mounted on slides and dendritic tree visualized using Zeiss LSM5 Exciter confocal microscope. Spine densities were estimat-ed along 650–1015mm of secondary/tertiary dendritic branches per group. 550–800 spines per group were analyzed to assess spine
morphology: mushroom spines: ,2mm in length, .0.5mm in width and are connected to the dendritic shaft by a narrower portion (neck); stubby spines:,2mm in length,.0.5mm in width and lack a defined neck; thin spines:,2mm in length,,0.5mm in width and have a neck; filopodia:.2mm in length,,0.5mm in width and do not have a distinct spine head; irregular spines have more than one necks and/or heads. The researches analysing the spine density and morphology were unaware of tissue genotype and stress status.
Statistics
Student t-test or analysis of variance (ANOVA) followed by Tukey’s post-test were used as appropriate. P values of less than 0.05 were considered significant.
Acknowledgments
We thank Dr. Alan Aderem for Lcn-22/2mice.
Author Contributions
Conceived and designed the experiments: RP. Performed the experiments: MM AES ES. Analyzed the data: MM AES EB ES NS RP. Wrote the paper: MM RSS RP.
References
1. Roozendaal B, McEwen BS, Chattarji S (2009) Stress, memory and the amygdala. Nat Rev Neurosci 10: 423–433.
2. Pawlak R, Magarinos AM, Melchor J, McEwen B, Strickland S (2003) Tissue plasminogen activator in the amygdala is critical for stress-induced anxiety-like behavior. Nat Neurosci 6: 168–174.
3. Attwood BK, Bourgognon JM, Patel S, Mucha M, Schiavon E, et al. (2011) Neuropsin cleaves EphB2 in the amygdala to control anxiety. Nature 473: 372– 375.
4. Cui H, Sakamoto H, Higashi S, Kawata M (2008) Effects of single-prolonged stress on neurons and their afferent inputs in the amygdala. Neuroscience 152: 703–712.
5. Lee EH, Hsu WL, Ma YL, Lee PJ, Chao CC (2003) Enrichment enhances the expression of sgk, a glucocorticoid-induced gene, and facilitates spatial learning through glutamate AMPA receptor mediation. Eur J Neurosci 18: 2842–2852. 6. Surjit M, Ganti KP, Mukherji A, Ye T, Hua G, et al. (2011) Widespread negative response elements mediate direct repression by agonist-liganded glucocorticoid receptor. Cell 145: 224–241.
7. Harada A, Shiosaka S, Ishikawa Y, Komai S (2008) Acute stress increases neuropsin mRNA expression in the mouse hippocampus through the glucocorticoid pathway. Neurosci Lett 436: 273–277.
8. Shimizu C, Yoshida S, Shibata M, Kato K, Momota Y, et al. (1998) Characterization of recombinant and brain neuropsin, a plasticity-related serine protease. J Biol Chem 273: 11189–11196.
9. Revest JM, Di Blasi F, Kitchener P, Rouge-Pont F, Desmedt A, et al. (2005) The MAPK pathway and Egr-1 mediate stress-related behavioral effects of glucocorticoids. Nat Neurosci 8: 664–672.
10. Chwang WB, O’Riordan KJ, Levenson JM, Sweatt JD (2006) ERK/MAPK regulates hippocampal histone phosphorylation following contextual fear conditioning. Learning & memory 13: 322–328.
11. Ferland CL, Schrader LA (2011) Regulation of histone acetylation in the hippocampus of chronically stressed rats: a potential role of sirtuins. Neuroscience 174: 104–114.
12. Gupta S, Kim SY, Artis S, Molfese DL, Schumacher A, et al. (2010) Histone methylation regulates memory formation. The Journal of neuroscience : the official journal of the Society for Neuroscience 30: 3589–3599.
13. Lee CT, Ma YL, Lee EH (2007) Serum- and glucocorticoid-inducible kinase1 enhances contextual fear memory formation through down-regulation of the expression of Hes5. J Neurochem 100: 1531–1542.
14. Bird AD, Tan KH, Olsson PF, Zieba M, Flecknoe SJ, et al. (2007) Identification of glucocorticoid-regulated genes that control cell proliferation during murine respiratory development. J Physiol 585: 187–201.
15. Owen HC, Roberts SJ, Ahmed SF, Farquharson C (2008) Dexamethasone-induced expression of the glucocorticoid response gene lipocalin 2 in chondrocytes. Am J Physiol Endocrinol Metab 294: E1023–1034.
16. Flower DR, North AC, Sansom CE (2000) The lipocalin protein family: structural and sequence overview. Biochim Biophys Acta 1482: 9–24. 17. Flo TH, Smith KD, Sato S, Rodriguez DJ, Holmes MA, et al. (2004) Lipocalin 2
mediates an innate immune response to bacterial infection by sequestrating iron. Nature 432: 917–921.
18. Tong Z, Wu X, Ovcharenko D, Zhu J, Chen CS, et al. (2005) Neutrophil gelatinase-associated lipocalin as a survival factor. Biochem J 391: 441–448. 19. Mucha M, Skrzypiec AE, Schiavon E, Attwood BK, Kucerova E, et al. (2011)
Lipocalin-2 controls neuronal excitability and anxiety by regulating dendritic spine formation and maturation. Proc Natl Acad Sci U S A 108: 18436–18441. 20. McEwen BS (2007) Physiology and neurobiology of stress and adaptation:
central role of the brain. Physiol Rev 87: 873–904.
21. Lee S, Park JY, Lee WH, Kim H, Park HC, et al. (2009) Lipocalin-2 is an autocrine mediator of reactive astrocytosis. The Journal of neuroscience : the official journal of the Society for Neuroscience 29: 234–249.
22. Hirase H (2005) A multi-photon window onto neuronal-glial-vascular commu-nication. Trends Neurosci 28: 217–219.
23. Bourgin C, Murai KK, Richter M, Pasquale EB (2007) The EphA4 receptor regulates dendritic spine remodeling by affecting beta1-integrin signaling pathways. J Cell Biol 178: 1295–1307.
24. Mitra R, Jadhav S, McEwen BS, Vyas A, Chattarji S (2005) Stress duration modulates the spatiotemporal patterns of spine formation in the basolateral amygdala. Proceedings of the National Academy of Sciences of the United States of America 102: 9371–9376.
25. Noguchi J, Matsuzaki M, Ellis-Davies GC, Kasai H (2005) Spine-neck geometry determines NMDA receptor-dependent Ca2+signaling in dendrites. Neuron 46: 609–622.
26. Shors TJ (2001) Acute stress rapidly and persistently enhances memory formation in the male rat. Neurobiology of learning and memory 75: 10–29. 27. Conboy L, Sandi C (2010) Stress at learning facilitates memory formation by
regulating AMPA receptor trafficking through a glucocorticoid action. Neuropsychopharmacology 35: 674–685.
28. Holscher C (1999) Stress impairs performance in spatial water maze learning tasks. Behav Brain Res 100: 225–235.
29. de Quervain DJ, Roozendaal B, McGaugh JL (1998) Stress and glucocorticoids impair retrieval of long-term spatial memory. Nature 394: 787–790. 30. Park CR, Zoladz PR, Conrad CD, Fleshner M, Diamond DM (2008) Acute
predator stress impairs the consolidation and retrieval of hippocampus-dependent memory in male and female rats. Learning & memory 15: 271–280. 31. Guilloux JP, Douillard-Guilloux G, Kota R, Wang X, Gardier AM, et al. (2012) Molecular evidence for BDNF- and GABA-related dysfunctions in the amygdala of female subjects with major depression. Mol Psychiatry.
32. Riihimaki-Lampen LH, Vainio MJ, Vahermo M, Pohjala LL, Heikura JM, et al. (2010) The binding of synthetic retinoids to lipocalin beta-lactoglobulins. J Med Chem 53: 514–518.
33. Campanacci V, Bishop RE, Blangy S, Tegoni M, Cambillau C (2006) The membrane bound bacterial lipocalin Blc is a functional dimer with binding preference for lysophospholipids. FEBS Lett 580: 4877–4883.
34. Flower DR (1996) The lipocalin protein family: structure and function. Biochem J 318 (Pt 1): 1–14.
36. Chudzinski-Tavassi AM, Carrijo-Carvalho LC, Waismam K, Farsky SH, Ramos OH, et al. (2010) A lipocalin sequence signature modulates cell survival. FEBS Lett 584: 2896–2900.
37. Leng X, Ding T, Lin H, Wang Y, Hu L, et al. (2009) Inhibition of lipocalin 2 impairs breast tumorigenesis and metastasis. Cancer Res 69: 8579–8584. 38. Liu Z, Yang A, Wang Z, Bunting KD, Davuluri G, et al. (2011) Multiple
apoptotic defects in hematopoietic cells from mice lacking lipocalin 24p3. J Biol Chem 286: 20606–20614.
39. Brown LJ, Alawoki M, Crawford ME, Reida T, Sears A, et al. (2010) Lipocalin-7 is a matricellular regulator of angiogenesis. PLoS One 5: e13905.
40. Lee S, Lee J, Kim S, Park JY, Lee WH, et al. (2007) A dual role of lipocalin 2 in the apoptosis and deramification of activated microglia. J Immunol 179: 3231– 3241.
41. Choi J, Lee HW, Suk K (2011) Increased plasma levels of lipocalin 2 in mild cognitive impairment. J Neurol Sci 305: 28–33.
42. Antharam V, Collingwood JF, Bullivant JP, Davidson MR, Chandra S, et al. (2012) High field magnetic resonance microscopy of the human hippocampus in Alzheimer’s disease: quantitative imaging and correlation with iron. Neuroimage 59: 1249–1260.
43. Sian-Hulsmann J, Mandel S, Youdim MB, Riederer P (2011) The relevance of iron in the pathogenesis of Parkinson’s disease. J Neurochem 118: 939–957. 44. LeVine SM (1997) Iron deposits in multiple sclerosis and Alzheimer’s disease
brains. Brain research 760: 298–303.
45. Devireddy LR, Gazin C, Zhu X, Green MR (2005) A cell-surface receptor for lipocalin 24p3 selectively mediates apoptosis and iron uptake. Cell 123: 1293– 1305.
46. Vyas A, Mitra R, Shankaranarayana Rao BS, Chattarji S (2002) Chronic stress induces contrasting patterns of dendritic remodeling in hippocampal and amygdaloid neurons. The Journal of neuroscience : the official journal of the Society for Neuroscience 22: 6810–6818.
47. Dumitriu D, Hao J, Hara Y, Kaufmann J, Janssen WG, et al. (2010) Selective changes in thin spine density and morphology in monkey prefrontal cortex correlate with aging-related cognitive impairment. J Neurosci 30: 7507–7515. 48. Pawlak R, Rao BS, Melchor JP, Chattarji S, McEwen B, et al. (2005) Tissue
plasminogen activator and plasminogen mediate stress-induced decline of neuronal and cognitive functions in the mouse hippocampus. Proceedings of the National Academy of Sciences of the United States of America 102: 18201– 18206.
49. Smyth GK (2004) Linear models and empirical bayes methods for assessing differential expression in microarray experiments. Stat Appl Genet Mol Biol 3: Article3.
50. Lockstone HE (2011) Exon array data analysis using Affymetrix power tools and R statistical software. Brief Bioinform 12: 634–644.
51. Keller A, Backes C, Al-Awadhi M, Gerasch A, Kuntzer J, et al. (2008) GeneTrailExpress: a web-based pipeline for the statistical evaluation of microarray experiments. BMC Bioinformatics 9: 552.