O. Demir et alii, Frattura ed Integrità Strutturale, 35 (2016) 340-349; DOI: 10.3221/IGF-ESIS.35.39
340
Focussed on Crack Paths
Investigation of mixed mode-I/II fracture problems -
Part 2: evaluation and development of mixed mode-I/II fracture
criteria
O. Demir
Department of Mechanical Engineering, Sakarya University, 54187, Sakarya, Turkey
Department of Mechanical and Manufacturing Engineering, Bilecik Şeyh Edebali University, 11230, Bilecik, Turkey [email protected]
A. O. Ayhan
Department of Mechanical Engineering, Sakarya University, 54187, Sakarya, Turkey [email protected]
ABSTRACT. In this study, experimental and numerical results of compact tension shear (CTS) specimen and a new specimen type under plane mixed mode (Mode-I/II) loading conditions are compared with existing in-plane mixed mode fracture criteria to investigate and understand the nature of fracture behavior properly. The material used in numerical and experimental analyses is Al 7075-T651 aluminum machined from rolled plates in the L-T rolling direction (crack plane is perpendicular to the rolling direction). In Part 1 of the study, results from numerical and experimental analyses are given. Having computed the mixed mode stress intensity factors from the numerical analyses, fracture loads are predicted and compared with different mixed mode-I/II fracture criteria. The experimental and numerical results show that many criteria are in good agreement with each other for predominately mode I to moderate mixed mode conditions. However, existing criteria increasingly differ from the experimental measurements for highly mode-II conditions. Using the computational and experimental results obtained, improved empirical mixed mode I/II fracture criteria for fracture condition and angle are also proposed.
KEYWORDS. Fracture; Mixed Mode; Mode-I/II; Compact Tension Shear; Fracture Criteria.
INTRODUCTION
lthough many fracture mechanics problems seen in practice can adequately be analyzed by taking into account mode-I conditions, there are still many problems that are subjected to mixed mode loading, for which mode-I analysis approaches are not sufficient. The mode mixity of the problem can be due to orientation of an initial defect existing in the structure due to imperfections or processes such as manufacturing operations. Another source of mixed mode loading on the crack is due to the nature of loads that exist on the structure. For such situations, analyses of the cracked structure under mixed mode loads and related criteria for fracture conditions are needed. The most basic type of mixed mode fracture is mode-I/II, in which both mode-I (opening) and mode-II (shearing) loads act on the crack tip.
O. Demir et alii, Frattura ed Integrità Strutturale, 35 (2016) 340-349; DOI: 10.3221/IGF-ESIS.35.39
341
There are various studies that exist in the literature for mixed mode-I/II fracture. One of the most common fracture criterion for in-plane mixed mode problems is maximum tangential (circumferential) stress (MTS), which was proposed by Erdogan and Sih [1]. This criterion assumes that, crack propagation starts from the crack tip radially when the tangential stress reaches a maximum value and exceeds a critical value or if an equivalent stress intensity factor (Keq) reaches the fracture toughness (KIC) propagation becomes unstable and fracture occurs. In this criterionKeq and crack deflection angle are given by:
2
0 0
0 3
cos cos sin
2 2 2
eq I II IC
K K K K
(1)
2 2 2
0 2 2
3 8
arccos
9
II I I II
I II
K K K K
K K
(2)
Another common fracture criterion developed by Sih [2], is minimum strain energy density criterion. It is based on the elastic energy density. According to this criterion crack extends in the direction of minimum strain energy density factor and if the minimum strain energy density factor reaches a critical value, which depends on material, crack becomes unstable. Substituting the stress intensity factor, kI and kII into the following equations crack deflection angle, θ, can be
obtained:
2
2I I II II
2 cosθ 1 sinθk 2 2 cos 2θ 1 cosθ k k 1 6cosθ sinθ k 0
(3)
2
2I I II II
2 cos 2θ 1 cosθ k 2 1 sinθ4 sin 2θ k k 1)cosθ 6cos 2θk 0
(4)
Nuismer [3] and Hussain [4] expressed the maximum energy release rate criterion according to the Griffith’s theory [5] in several different forms. According to this criterion, crack propagates in the direction that strain energy release rate is maximum and crack becomes unstable if the maximum strain energy release rate exceeds a critical value. Crack deflection angles obtained from maximum circumferential stress criterion and maximum strain energy release rate criterion are the same. Consequently, the results of crack deflection angles according to Erdogan and Sih, and Nuismer and Hussain criterion are identical.
Koo and Choy [6] developed the maximum tangential strain criterion proposed by Chang [7] and expressed a new criterion called maximum tangential strain energy density criterion. Initial crack growth occurs in the direction of maximum tangential strain energy density factor and if the factor reaches a critical value crack initiation occurs. The tangential strain energy density factor C and coefficients are defined by:
2 2
11 1k 12k k1 2 22k2
C b b b (5)
11 1/ 64 (1 cos )( 2 cos )
b
12 1/ 64 (sin 3 / 2 3cos )
b (6)
222 1/ 64 (3sin )( 3cos )
b
where =3-4 for plane strain and =(3- )/(1+ ) for plane stress conditions, is Poisson's ratio and is shear modulus. Then the crack initiation angle θ can be obtained by:
0 C
and
2
2 0
C
(7)
O. Demir et alii, Frattura ed Integrità Strutturale, 35 (2016) 340-349; DOI: 10.3221/IGF-ESIS.35.39
342
For the prediction of fracture limit the determination of equivalent stress intensity factor (SIF) is essential. Several criteria exist to compute the equivalent SIF. One of them is Erdogan and Sih criterion. An equivalent SIF was given in Eq. (1). Pook [8] developed an in plane mixed mode criterion and proposed the following Eq. (8) that equivalent SIF can be obtained from the equation with substituting the KIand KII SIF.
1
2 2
th th th
0.08 0.83 0.75
II I I
K K K
K K K
(8)
Tanaka [9] introduced the concept of the equivalent SIF for mixed mode conditions and the equivalent SIF was defined by:
1
4 4 4
eq I 8 II
K K K
(9)
Another criterion developed for in plane mixed mode-I/II problems is Richard criterion [10, 11]. Richard proposed an equivalent SIF and crack deflection angle formulation and verified the formulations by a large number of experiments [12]. According to this criterion, if the proposed equivalent SIF exceeds a critical value, unstable crack growth occurs. The equivalent SIF and crack deflection angle were given by:
2 2
eq 1
1
4( )
2 2
I
I II IC
K
K K K K (10)
2
0 155.5 83.4
II II
I II I II
K K
K K K K
(11)
α1 is a material parameter describes the ratio of KIC/KIICand generally taken as 1.155.
In this study, fracture experiments of CTS specimen and a new type of specimen called T-specimen, which has smaller dimensions and requires less material, are conducted to check the validity of some of the existing criteria for mixed mode-I/II fracture conditions and to develop a further refined mode-mode-I/II fracture criterion. In Part 1 of the study, details and results of the finite element models including fracture submodels of CTS specimen and description of the test procedure for CTS and T-specimens are given. The outline of this paper is as follows: In the next section, experimental results of CTS and T-specimen are given. This is followed by comparisons of the experimental results with existing criteria and development of an improved mode-I/II fracture criteria.
EXPERIMENTAL RESULTS OF MODE-I/II FRACTURE TESTS
his section deals with experimental results of mode-I/II fracture tests of CTS and T-specimen. In the first sub-section, experimental results of CTS specimen are given in terms of fracture loads, crack lengths and crack deflection angles for all tests under different loading angles. The second sub-section contains experimental results of T-specimen under different loading angles performed.
Results of CTS Specimen Experiments
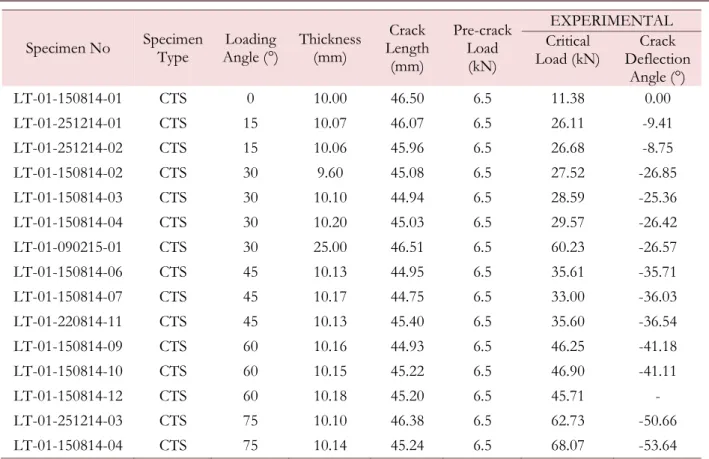
In this sub-section, results from the in-plane mixed mode fracture tests of CTS specimen are presented for different loading angles. In Part 1 of this article, details of the experimental set-up, including materials and equipment used, specimen preparation and testing procedure, are explained. Tab. 1 summarizes different cases tested. Critical fracture loads are determined by load-displacement curves and crack deflection angles are measured from the fracture surfaces. Also, a 25 mm-thick CTS specimen is tested for 30° loading angle and its results are given in the table.
O. Demir et alii, Frattura ed Integrità Strutturale, 35 (2016) 340-349; DOI: 10.3221/IGF-ESIS.35.39
343
Specimen No Specimen
Type
Loading Angle (°)
Thickness (mm)
Crack Length
(mm)
Pre-crack Load
(kN)
EXPERIMENTAL Critical
Load (kN)
Crack Deflection
Angle (°)
LT-01-150814-01 CTS 0 10.00 46.50 6.5 11.38 0.00
LT-01-251214-01 CTS 15 10.07 46.07 6.5 26.11 -9.41
LT-01-251214-02 CTS 15 10.06 45.96 6.5 26.68 -8.75
LT-01-150814-02 CTS 30 9.60 45.08 6.5 27.52 -26.85
LT-01-150814-03 CTS 30 10.10 44.94 6.5 28.59 -25.36
LT-01-150814-04 CTS 30 10.20 45.03 6.5 29.57 -26.42
LT-01-090215-01 CTS 30 25.00 46.51 6.5 60.23 -26.57
LT-01-150814-06 CTS 45 10.13 44.95 6.5 35.61 -35.71
LT-01-150814-07 CTS 45 10.17 44.75 6.5 33.00 -36.03
LT-01-220814-11 CTS 45 10.13 45.40 6.5 35.60 -36.54
LT-01-150814-09 CTS 60 10.16 44.93 6.5 46.25 -41.18
LT-01-150814-10 CTS 60 10.15 45.22 6.5 46.90 -41.11
LT-01-150814-12 CTS 60 10.18 45.20 6.5 45.71 -
LT-01-251214-03 CTS 75 10.10 46.38 6.5 62.73 -50.66
LT-01-150814-04 CTS 75 10.14 45.24 6.5 68.07 -53.64
Table 1: Experimental results of CTS specimen obtained from the mixed mode fracture tests.
Results of T-Specimen Experiments
Tab. 2 summarizes experimental studies of 25 mm-thick T-specimen performed under different loading cases. As mentioned in Part 1 of this paper that loading requirements of 25 mm-thick T-specimens under all loading cases are lower than 10 mm-thick CTS specimens.
Specimen No Specimen
Type
Loading Angle (°)
Thickness (mm)
Crack Length
(mm)
Pre-crack Load (kN)
EXPERIMENTAL
Critical Load (kN)
Crack Deflection Angle (°)
T-LT-01-251214-01 T 0 24.87 26.03 10.5 19.60 0.00
T-LT-01-180115-12 T 15 25.00 26.93 10.5 19.80 -11.73
T-LT-01-180115-13 T 15 24.98 26.34 10.5 19.70 -9.34
T-LT-01-180115-14 T 30 24.98 26.21 10.5 23.07 -21.95
T-LT-01-180115-15 T 30 25.00 26.90 10.5 20.64 -18.07
T-LT-01-251214-02 T 45 25.00 25.24 10.5 28.09 -26.26
T-LT-01-251214-03 T 45 25.01 25.46 10.5 29.21 -24.15
T-LT-01-251214-04 T 60 24.96 27.13 10.5 33.59 -33.69
T-LT-01-090215-18 T 60 25.00 26.58 10.5 34.76 -36.41
T-LT-01-180115-17 T 75 25.03 26.89 10.5 54.31 -50.19
T-LT-01-220215-22 T 75 24.96 26.70 10.5 55.04 -53.17
O. Demir et alii, Frattura ed Integrità Strutturale, 35 (2016) 340-349; DOI: 10.3221/IGF-ESIS.35.39
344
MODE-I/II FRACTURE CRITERION DEVELOPMENT
n this section, development of a mixed mode-I/II fracture criterion by making use of SIFs from finite element models and experimental results and comparisons with other existing criteria are presented. In the first sub-section, details of mode-I/II fracture criterion development is presented. In the second sub-section, comparisons of developed and some of the existing mode-I/II fracture criteria in terms of fracture loads are presented. This is followed by comparisons of the developed criterion with other criteria in the literature in terms of crack deflection angles.
Procedure for Mode-I/II Fracture Criterion Development
In an effort to develop an improved empirical mixed mode-I/II fracture criterion, mixed mode SIFs obtained from detailed finite element models of CTS specimen and fracture results from the tests for different loading angles are used. These data are used in a regression analysis using DatafitTM [13], from which the empirical mixed mode-I/II fracture
criterion formula is determined by performing regression analysis (curve fitting).
Comparisons of Mode-I/II Fracture Criteria In Terms of Fracture Loads
In this subsection, the predicted fracture load values from the developed criterion are compared with other existing criteria in the literature. Applying the method mentioned above, equivalent stress intensity factor (Keq) in the developed criterion is defined by:
2 3
eq I II II II
K a (b K ) (c / K ) (d / K ) (e / K ) (12)
This equation is developed by using CTS specimen data obtained for 15°, 30°, 45°, 60° and 75° loading cases. 0° loading case data is excluded to develop the improved in-plane mixed mode-I/II equivalent SIF equation. Coefficients in Eq. (12) are given in Tab. 3.
a b c d e
3.0731 1.0311 -7.3269 5.7100 -1.4163
Table 3: Coefficients of developed equivalent SIF equation (CTS specimen data used).
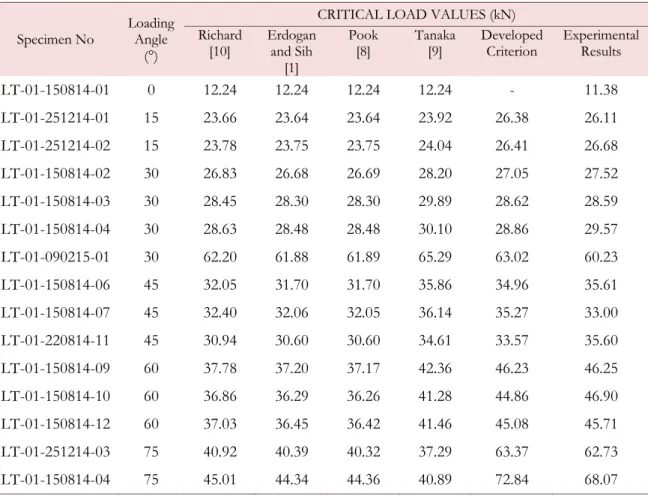
Experimental loads and predicted fracture loads obtained from the developed criterion for the CTS specimen along with other existing criteria in the literature for different loading cases are given in Tab. 4. The results are also plotted and shown in Fig. 1.
It can be seen from the Fig. 1 that for Erdogan and Sih, Richard and Pook criteria, divergence occurs after 45° loading case and increases with increasing loading angle. Tanaka criterion is good agreement with the experimental results up to 60° loading case but the criterion does not produce accurate result for 75° loading case. Critical load values obtained from the developed criterion and experimental results are almost identical with an average error rate of 2.8% for all loading angles performed.
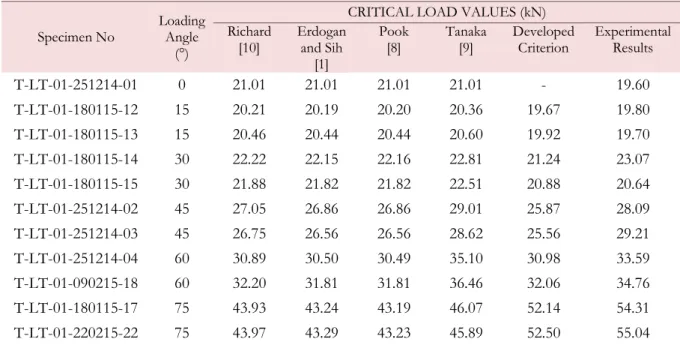
Experimental and predicted T-specimen fracture load values obtained from the developed criterion along with other existing criteria in the literature for different loading cases are given in Tab. 5. Critical load values of T-specimen according to developed criterion are acquired by substituting mixed mode SIFs obtained from detailed finite element analyses of T-specimen for different loading angles in the equivalent SIF equation developed by using aonly CTS specimen data.
Comparisons of experimental and predicted critical fracture load values of T-specimen are presented in Fig. 2. As can be seen in the figure, all criteria are in good agreement with the experimental results up to 60° loading case. Divergence occurs after 60° loading case for existing criteria. Critical load values obtained from the developed criterion and experimental results are almost identical with an average error rate of 5.5% for all loading angles performed. Thus, criterion is validated with T-specimen fracture results. Furthermore, T-specimen is also proposed as a new specimen type, since its experimental results are validated with the developed and existing criteria.
O. Demir et alii, Frattura ed Integrità Strutturale, 35 (2016) 340-349; DOI: 10.3221/IGF-ESIS.35.39
345 Specimen No
Loading Angle
(°)
CRITICAL LOAD VALUES (kN) Richard
[10]
Erdogan and Sih
[1]
Pook [8]
Tanaka [9]
Developed Criterion
Experimental Results
LT-01-150814-01 0 12.24 12.24 12.24 12.24 - 11.38
LT-01-251214-01 15 23.66 23.64 23.64 23.92 26.38 26.11
LT-01-251214-02 15 23.78 23.75 23.75 24.04 26.41 26.68
LT-01-150814-02 30 26.83 26.68 26.69 28.20 27.05 27.52
LT-01-150814-03 30 28.45 28.30 28.30 29.89 28.62 28.59
LT-01-150814-04 30 28.63 28.48 28.48 30.10 28.86 29.57
LT-01-090215-01 30 62.20 61.88 61.89 65.29 63.02 60.23
LT-01-150814-06 45 32.05 31.70 31.70 35.86 34.96 35.61
LT-01-150814-07 45 32.40 32.06 32.05 36.14 35.27 33.00
LT-01-220814-11 45 30.94 30.60 30.60 34.61 33.57 35.60
LT-01-150814-09 60 37.78 37.20 37.17 42.36 46.23 46.25
LT-01-150814-10 60 36.86 36.29 36.26 41.28 44.86 46.90
LT-01-150814-12 60 37.03 36.45 36.42 41.46 45.08 45.71
LT-01-251214-03 75 40.92 40.39 40.32 37.29 63.37 62.73
LT-01-150814-04 75 45.01 44.34 44.36 40.89 72.84 68.07
Table 4: Experimental and predicted CTS specimen fracture load values obtained from the developed criterion with other existing
criteria in the literature.
O. Demir et alii, Frattura ed Integrità Strutturale, 35 (2016) 340-349; DOI: 10.3221/IGF-ESIS.35.39
346
Specimen No
Loading Angle
(°)
CRITICAL LOAD VALUES (kN) Richard
[10]
Erdogan and Sih
[1]
Pook [8]
Tanaka [9]
Developed Criterion
Experimental Results
T-LT-01-251214-01 0 21.01 21.01 21.01 21.01 - 19.60
T-LT-01-180115-12 15 20.21 20.19 20.20 20.36 19.67 19.80
T-LT-01-180115-13 15 20.46 20.44 20.44 20.60 19.92 19.70
T-LT-01-180115-14 30 22.22 22.15 22.16 22.81 21.24 23.07
T-LT-01-180115-15 30 21.88 21.82 21.82 22.51 20.88 20.64
T-LT-01-251214-02 45 27.05 26.86 26.86 29.01 25.87 28.09
T-LT-01-251214-03 45 26.75 26.56 26.56 28.62 25.56 29.21
T-LT-01-251214-04 60 30.89 30.50 30.49 35.10 30.98 33.59
T-LT-01-090215-18 60 32.20 31.81 31.81 36.46 32.06 34.76
T-LT-01-180115-17 75 43.93 43.24 43.19 46.07 52.14 54.31
T-LT-01-220215-22 75 43.97 43.29 43.23 45.89 52.50 55.04
Table 5: Experimental and predicted T-specimen fracture loads obtained from the developed criterion along with other existing
criteria in the literature.
Figure 2: Comparisons of experimental and predicted T-specimen fracture load values.
Comparisons of Mode-I/II Fracture Criteria In Terms of Crack Deflection Angle
In this subsection, the predicted crack deflection angles from the developed criterion are compared with other existing criteria in the literature. In an effort to develop an improved empirical mode-I/II crack deflection angle equation, mixed mode SIFs obtained from detailed finite element models of CTS and T-specimen and crack deflection angles obtained from the experiments for different loading angles are used. Developed crack deflection angle equation is given by:
2 3 4 5 2 3 4 5
0 a bln(KI) cln(KI) dln(KI) eln(KI) f ln(KI) gKII hKII iKII jKII kKII
(13)
0° loading case data is excluded as is the case with the development of equivalent SIF equation to develop the improved in-plane mixed mode-I/II crack deflection angle equation. Coefficients in Eq. (13) are given in Tab. 6.
a b c d e f g h i j k
-0.7907 2.0365 -3.4144 2.2844 -0.5928 0.0465 1.1736 -2.6539 1.8244 -0.5330 0.0565
O. Demir et alii, Frattura ed Integrità Strutturale, 35 (2016) 340-349; DOI: 10.3221/IGF-ESIS.35.39
347
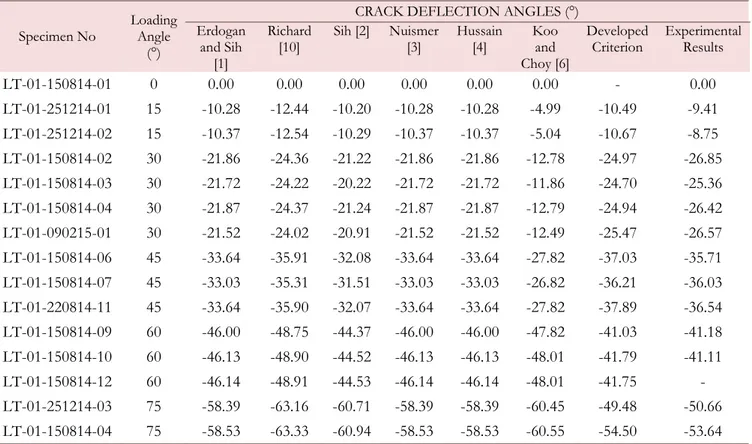
Experimental and predicted CTS specimen crack deflection angles obtained from the developed criterion with other existing criteria in the literature for different loading cases are given in Tab. 7. Comparison of this data is also presented as a graph in Fig. 3.
Specimen No
Loading Angle
(°)
CRACK DEFLECTION ANGLES (°) Erdogan
and Sih [1]
Richard [10]
Sih [2] Nuismer [3]
Hussain [4]
Koo and Choy [6]
Developed Criterion
Experimental Results
LT-01-150814-01 0 0.00 0.00 0.00 0.00 0.00 0.00 - 0.00
LT-01-251214-01 15 -10.28 -12.44 -10.20 -10.28 -10.28 -4.99 -10.49 -9.41
LT-01-251214-02 15 -10.37 -12.54 -10.29 -10.37 -10.37 -5.04 -10.67 -8.75
LT-01-150814-02 30 -21.86 -24.36 -21.22 -21.86 -21.86 -12.78 -24.97 -26.85
LT-01-150814-03 30 -21.72 -24.22 -20.22 -21.72 -21.72 -11.86 -24.70 -25.36
LT-01-150814-04 30 -21.87 -24.37 -21.24 -21.87 -21.87 -12.79 -24.94 -26.42
LT-01-090215-01 30 -21.52 -24.02 -20.91 -21.52 -21.52 -12.49 -25.47 -26.57
LT-01-150814-06 45 -33.64 -35.91 -32.08 -33.64 -33.64 -27.82 -37.03 -35.71
LT-01-150814-07 45 -33.03 -35.31 -31.51 -33.03 -33.03 -26.82 -36.21 -36.03
LT-01-220814-11 45 -33.64 -35.90 -32.07 -33.64 -33.64 -27.82 -37.89 -36.54
LT-01-150814-09 60 -46.00 -48.75 -44.37 -46.00 -46.00 -47.82 -41.03 -41.18
LT-01-150814-10 60 -46.13 -48.90 -44.52 -46.13 -46.13 -48.01 -41.79 -41.11
LT-01-150814-12 60 -46.14 -48.91 -44.53 -46.14 -46.14 -48.01 -41.75 -
LT-01-251214-03 75 -58.39 -63.16 -60.71 -58.39 -58.39 -60.45 -49.48 -50.66
LT-01-150814-04 75 -58.53 -63.33 -60.94 -58.53 -58.53 -60.55 -54.50 -53.64
Table 7: Comparison of the predicted crack deflection angles using the developed criterion and comparison with other existing criteria in the literature.
It can be seen from the Fig. 3 that all criteria show a similar tendency for all loading cases except Koo and Choy criterion. When compared with experimental results, crack deflection angles obtained from the criteria, except Koo and Choy criterion, show a similar tendency up to 60° loading case and divergence occurs after 60° loading case for all criteria. Crack deflection angle values obtained from the developed criterion and experimental results are almost identical with an average error rate of 5.13% for all loading angles performed.
O. Demir et alii, Frattura ed Integrità Strutturale, 35 (2016) 340-349; DOI: 10.3221/IGF-ESIS.35.39
348
In Tab. 8, for the T-specimen experimental and predicted crack deflection angles obtained from the developed criterion using the CTS specimen data and predictions of other existing criteria in the literature for different loading cases are given.
Specimen No Loading Angle (°)
CRACK DEFLECTION ANGLES (°) Erdogan
and Sih [1]
Richard [10]
Sih [2] Nuismer [3]
Hussain [4]
Koo and Choy [6]
Developed Criterion
Experimental Results
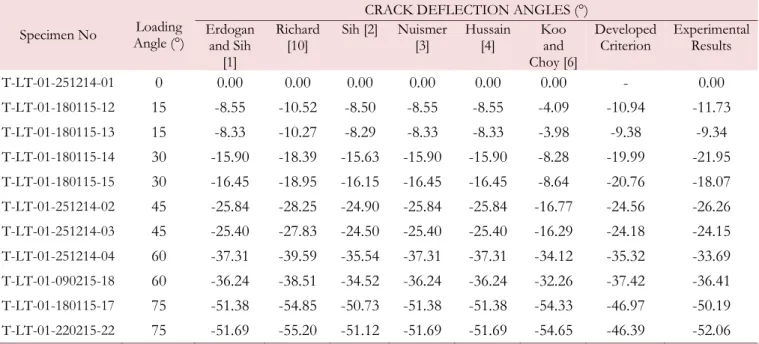
T-LT-01-251214-01 0 0.00 0.00 0.00 0.00 0.00 0.00 - 0.00 T-LT-01-180115-12 15 -8.55 -10.52 -8.50 -8.55 -8.55 -4.09 -10.94 -11.73 T-LT-01-180115-13 15 -8.33 -10.27 -8.29 -8.33 -8.33 -3.98 -9.38 -9.34 T-LT-01-180115-14 30 -15.90 -18.39 -15.63 -15.90 -15.90 -8.28 -19.99 -21.95 T-LT-01-180115-15 30 -16.45 -18.95 -16.15 -16.45 -16.45 -8.64 -20.76 -18.07 T-LT-01-251214-02 45 -25.84 -28.25 -24.90 -25.84 -25.84 -16.77 -24.56 -26.26 T-LT-01-251214-03 45 -25.40 -27.83 -24.50 -25.40 -25.40 -16.29 -24.18 -24.15 T-LT-01-251214-04 60 -37.31 -39.59 -35.54 -37.31 -37.31 -34.12 -35.32 -33.69 T-LT-01-090215-18 60 -36.24 -38.51 -34.52 -36.24 -36.24 -32.26 -37.42 -36.41 T-LT-01-180115-17 75 -51.38 -54.85 -50.73 -51.38 -51.38 -54.33 -46.97 -50.19 T-LT-01-220215-22 75 -51.69 -55.20 -51.12 -51.69 -51.69 -54.65 -46.39 -52.06
Table 8: Comparison of the predicted crack deflection angles using the developed criterion and comparison with other existing criteria in the literature, T-specimen.
Comparison of experimental and predicted crack deflection angles for the T-specimen are presented in Fig. 4. As can be seen in the figure, all criteria show a similar tendency with each other and experimental results for all loading cases, except Koo and Choy criterion. Crack deflection angle values obtained from the developed criterion and experimental results are very close with an average error of 6.25% for all loading angles studied.
Figure 4: Comparisons of experimental and predicted crack deflection angles - T-specimen.
CONCLUSIONS
O. Demir et alii, Frattura ed Integrità Strutturale, 35 (2016) 340-349; DOI: 10.3221/IGF-ESIS.35.39
349
Fracture load results showed that many criteria are in good agreement with each other for predominately mode I to moderate mixed mode conditions, but that the existing criteria increasingly differ from the experimental measurements for highly mode-II conditions.
ACKNOWLEDGEMENTS
he financial support by The Scientific and Technological Research Council of Turkey (TÜBİTAK) for this study under project no 113M407 is gratefully acknowledged.
REFERENCES
[1] Erdogan, F., Sih, G.C., On the Crack Extension in Plane Loading and Transverse Shear, J. Basic Eng., 85 (1963) 519-527.
[2] Sih, G.C., Macdonald, B., Fracture Mechanics Applied to Engineering Problems-Strain Energy Density Fracture
Criterion, Eng. Fract. Mech., 6 (1974) 361-386.
[3] Nuismer, R.J., An energy release rate criterion for mixed mode fracture, Int J Fatigue, 11 (1975) 245-250.
[4] Hussain, M.A., Pu, S.U., Underwood, J., Strain energy release rate for a crack under combined mode I and II, ASTM STP, 560 (1974) 2-28.
[5] Griffith, A., The phenomena of flow and rupture in solids, Philosophical Transactions of the Royal Society of
London, A 221 (1920) 163-198.
[6] Koo, J.M., Choy, Y.S., A new mixed mode fracture criterion: maximum tangential strain energy density criterion, Eng. Fract. Mech., 39 (1991) 443-449.
[7] Chang, K.J., On the maximum strain criterion—A new approach to the angled crack problem, Eng. Fract. Mech., 14
(1981) 107-124.
[8] Carlson, R.L., Kardomateas, G. A., Introduction to Fatigue in Metals and Composites, First ed., London, UK, (1996). [9] Tanaka, K., Fatigue crack propagation from a crack inclined to the cyclic tensile axis, Eng. Fract. Mech., 6 (1974)
493-507.
[10]Richard, H.A., Bruchvorhersage bei überlagerter Normal- und Schubbeanspruchung von Rissen, VDI-Verlag,
Düsseldorf, (1985).
[11]Richard, H.A., In: Structural failure, product liability and technical insurance, Rossmanith (Ed.), Inderscience
Enterprises Ltd., Genf., (1987).
[12]Richard, H.A., Theoretical crack path determination, International Conference on Fatigue Crack Paths, Parma (Italy), (FCP 2003), conference chairmen: A. Carpinteri, L.P. Pook.
[13]DataFit 9 Tutorials, Oakdale Engineering, Oakdale, PA 15071.