M. Bozkurt et alii, Frattura ed Integrità Strutturale, 35 (2016) 350-359; DOI: 10.3221/IGF-ESIS.35.40
350
Focussed on Crack Paths
Finite element modeling and experimental studies on
mixed mode-I/III fracture specimens
M. Bozkurt, A. O. Ayhan, M. F. Yaren, S.
İ
riç
Department of Mechanical Engineering, Sakarya University, 54187, Sakarya, Turkey
[email protected], [email protected], [email protected], [email protected]
ABSTRACT. In this study, finite element modeling and experimental studies on a mode-I/III specimen similar to the compact tension specimen are presented. By using bolts, the specimen is attached to two loading apparatus that allow different levels of mode-I/III loading by changing the loading holes. Specimens having two different thicknesses are analyzed and tested. Modeling, meshing and the solution of the problem involving the whole assembly, i.e., loading devices, bolts and the specimen, with contact mechanics are performed using ANSYSTM.
Then, the mode-I/III specimen is analyzed separately using a submodeling approach, in which three-dimensional enriched finite elements are used in FRAC3D solver to calculate the resulting stress intensity factors along the crack front. In all of the analyses, it is clearly shown that although the loading is in the mode-I and III directions, mode-II stress intensity factors coupled with mode-III are also generated due to rotational relative deformations of crack surfaces. The results show that the mode-II stress intensity factors change sign along the crack front and their magnitudes are close to the mode-III stress intensity factors. It is also seen that magnitudes of the mode-III stress intensity factors do not vary much along the crack front. Fracture experiments also performed and, using the stress intensity factors from the analyses and crack paths and surfaces are shown.
KEYWORDS. Fracture; Mixed Mode; Mode-I/III; Compact Tension Tear; Finite Element Method.
INTRODUCTION
ajority of fracture mechanics problems seen in practice are type of mode-I. However, there are still many problems that include mixed mode loading. In that case, mode-I analysis approaches are not sufficient. One of the basic types of mixed mode fracture is mode-I/III, in which both mode-I (opening) and mode-III (tearing) loads act near the crack region.
M. Bozkurt et alii, Frattura ed Integrità Strutturale, 35 (2016) 350-359; DOI: 10.3221/IGF-ESIS.35.40
351
study, it was also pointed out that mode-III loads near the crack regions lead to factory-roofing type of ridges and thus friction between the two fracture surfaces. On the other hand Kikuchi et al. investigate of effect on KIII on fatigue crack growth behavior and they showed that crack growth rate near the deepest point of the surface crack decreased [4]. Wei et al. investigated mixed-mode crack growth in ductile sheets experimentally and computationally [5]. Tearing fracture experiments on thin-sheet specimens under combined in-plane and out-of-plane loadings were carried out. To apply load on specimen, they designed an apparatus that allows different loading angles.
In this study, systematic finite element analyses of a mode-I/III experimental system are performed. This system is composed of compact tension tearing (CTT) specimen, loading apparatus, bolts and pins. Using the results from analyses of the assembly for different mode-I/III mixity angles and different specimen thicknesses, corresponding fracture analyses are also performed on the specimen submodel and three-dimensional mixed mode stress intensity factors are computed. Fracture experiments are also conducted to check the validity of analysis results. The outline of the paper is as follows: In the next section, details of the finite element models including fracture submodels are given. This is followed by description of the test procedure, the corresponding experimental results and mixed mode fracture criteria comparisons. Finally, conclusions drawn from the studies are presented.
FINITE ELEMENT MODELING OF MODE-I/III FRACTURE
n this section, details and results of the finite element models are presented. First, finite element models, boundary conditions and loads are described. In the second subsection, results of the finite element models in terms of stress intensity factors are presented.
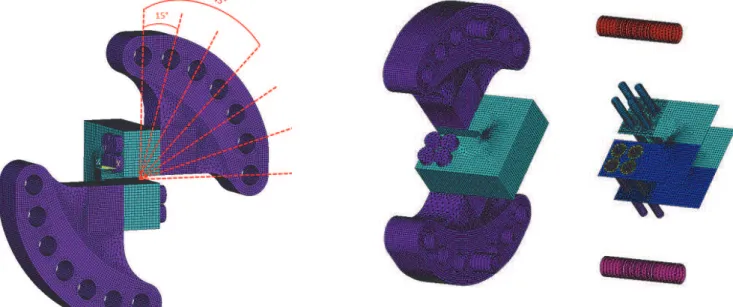
Figure 1: Finite element model of the mode-I/III fracture test system.
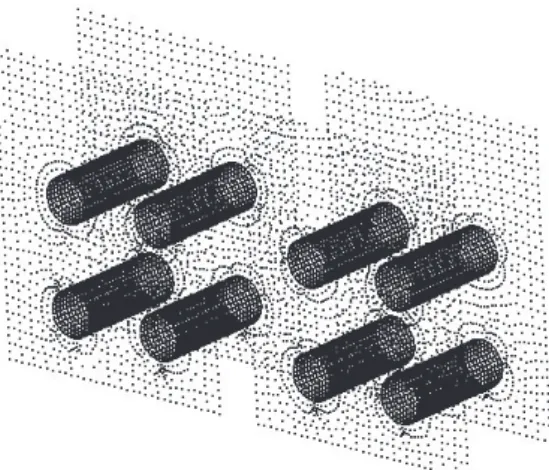
Figure 2: Contact surfaces on the mode-I/III fracture test system.
Description of Finite Element Models
In Fig.1, overall and exploded views of the solid model for mixed mode-I/III test assembly are shown. Mode-I/III finite element model is shown in Fig. 1. The assembly is similar to that of Wei et al [5], who used thin specimens. In the current study, mode-I / III model is designed for 7 different mixed mode loading angles (0°, 15°, 30°, 45°, 60°, 75° and 90 °). The other difference is that thicker specimens under linear elastic fracture conditions are used, i.e., t=25mm, 20mm, 12.5mm. Loading axis passes through the center of the specimen at any given loading angle. Loading apparatus are connected to the specimen with 8 bolts, 4 bolts for each apparatus.
Contacts applied to the mode I/III finite element model are shown in Fig. 2. Bonded always contact type is used between the surfaces under bolt heads and the speciment surfaces, as the bolts are hardly tightened in the experiment. To simulate threaded connections between bolt threads and the matching hole surfaces on the apparatus, bonded always contact type
M. Bozkurt et alii, Frattura ed Integrità Strutturale, 35 (2016) 350-359; DOI: 10.3221/IGF-ESIS.35.40
352
is also used for these surface couples. Between the bolt surfaces and hole surfaces on the specimen standard contact with friction is used. Finally, the standard contact type with friction is also used between the loading pins and the surfaces of the loading holes on the apparatus.
Figure 3: Decription of boundary conditions for mode-I/III fracture test system.
In Fig. 3, the boundary conditions and loads applied on the model are shown. As shown in the figure, side surfaces of the the upper pin is fixed, while those surfaces of the lower pin are allowed to move only in the vertical direction with a total of 10 kN load applied in the same direction. This model, which contains the described contact definitions, boundary conditions and loads, is solved within ANSYS [6]. Then, the compact tension tearing specimen is isolated, its displacements on the connecting surfaces are re-applied to it and re-solved as a fracture mechanics problem using FRAC3D, i.e., submodeling of the CTT specimen is done. From this analysis mixed mode stess intensity factors are obtained. Fig. 4 shows a sample node set of the CTT specimen submodel wıth displacement boundary conditions.
Figure 4: Sample node set of the CTT specimen submodel wıth displacement boundary conditions.
M. Bozkurt et alii, Frattura ed Integrità Strutturale, 35 (2016) 350-359; DOI: 10.3221/IGF-ESIS.35.40
353 Figure 5: Analysis procedure with a process map
Results of Finite Element Models
In this subsection, results from mode-I/III fracture analyses are presented for different loading angles and different specimen thicknesses. Deformed shapes and equivalent stress distributions are shown in Fig. 6 (θ=45° and t=25 mm).
Figure 6: Deformed shapes and equivalent stress distrubitions for θ=45°.
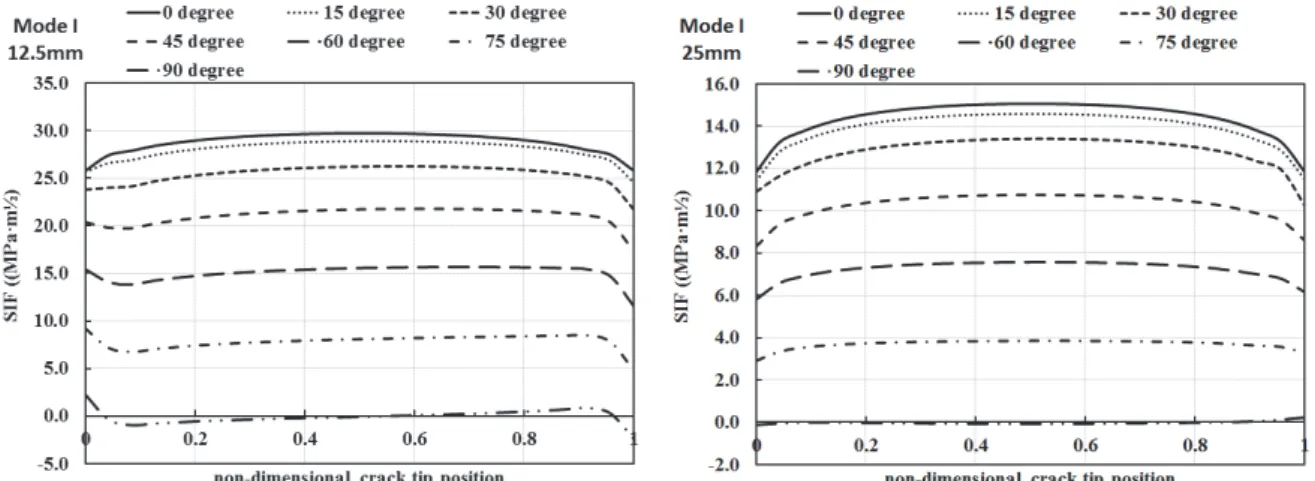
As a demonstration case, Fig. 7 shows distributions of three-dimensional stress intensity factors for two different specimen thicknesses t=25 mm and t=12.5 mm (θ=45°). It can be seen from this figure that, when the thickness is reduced from 25 mm to 12.5 mm, mode-I SIF increases two times, while mode-II and mode-III SIFs increase nearly 3.5 and 2.5 times, respectively. The reason that mode-II and mode-III SIFs don’t increase 2 times as mode-I SIF is that mode-III loading causes the CTT specimen to bend in the tearing direction and that bending deflection and the moment of inertia do not change linearly with specimen thickness.
M. Bozkurt et alii, Frattura ed Integrità Strutturale, 35 (2016) 350-359; DOI: 10.3221/IGF-ESIS.35.40
354
all the loading angle cases presented in Fig. 8-10, the ratios of SIF changes described for Fig. 7 due to thickness changes remain the same, showing consistency in the results.
Figure 7: Mixed mode SIF results for 45 degrees loading angle.
Figure 8: Mode-I SIF distributions for different loading angles (t = 25 mm and t = 12.5 mm).
M. Bozkurt et alii, Frattura ed Integrità Strutturale, 35 (2016) 350-359; DOI: 10.3221/IGF-ESIS.35.40
355 Figure 10: Mode-III SIF distributions for different loading angles (t = 25 mm and t = 12.5 mm).
It is also observed from Figs. 8-10 that as loading angle changes from θ=0° to θ=90°, the rate of decrease in mode-I SIF increases while the rates of increases for mode-II and mode-III SIFs decrease. It should also be noted that although there is no mode-II component of the external loading on this model, due to mode-III loading relative rotational deformations of the two crack surfaces take place and that because of the thickness of the specimen mode-II stress intensity factor is also generated in a coupled manner. It is seen from Fig. 9 that, except near the free-surfaces where the solutions are not treated to be accurate due to free-surface effects, the mode-II SIF changes almost linerarly along the cracks front and changes sign from back surface to the front surface. Because of this bahavior of mode-II SIF, cracks deflections on the back and front surfaces of the specimen are expected to be in opposite directions, i.e., one is upward and the other is downward or vice versa.
EXPERIMENTAL STUDIES ON MODE-I/III FRACTURE
his section deals with experimental studies on mode-I/III fracture test system. In the first section, details of the experimental set-up, including materials and equipment used, specimen preparation and testing procedure, are explained. The second subsection contains experimental results in terms of fracture loads, crack lengths and pictures of the broken samples for from the tests performed.
Description of The Experimental Set-Up
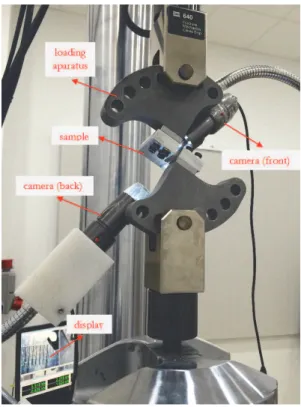
The experiments are performed on a 100 kN - 1100 N·m MTS axial-torsional fatigue test machine. In Fig.11, overall view of the experimental set-up and the equipment used is shown. As seen from this figure, the test assembly consists of the mode-I/III CTT specimen (Al 7075-T651), the loading apparatus (St 4140), the pins (HSS), the bolts (steel) and two cameras that monitor and record the crack tips on the front and back specimen surfaces. As seen from the figure, the loading apparatus are designed to test ther CTT specimen for different mode mixity angles (θ = 0°, 15°, 30°, 45°, 60°, 75°, 90°). Back and front surface crack tips are monitored and recorded by two microscop cameras. Crack length is measured using a scale with half milimeter divisions pasted on the specimen. Before fracture toughness and crack growth tests, a 1.3-mm precrack is generated for each specimen under mode-I loading. After the fracture of the specimen, actual crack length is determined according to ASTM-E399 using the digitial top views of the specimen and measuring the crack length digitally. Fracture load is determined as required by ASTM-E399.
According to ASTM E399-12, fatigue precrack must be generated under 0.8KQ [8]. In the experimental studies, maximum pre-crack K values are near half KIC with R-ratio (Kmin/Kmax) equals 0.1.
Results of Experiments
Here, results from the mixed mode-I/III fracture tests are presented for different loading angles. Tab. 1 summarizes different cases tested. During fracture toughness tests, axial loading rate is adjusted to stay witin the limits set by ASTM E399, i.e., 0.55 MPa(m)0.5/s ≥K/t ≥ 2.75 MPa(m)0.5/s. Fracture loads are also determined according to ASTM E399.
M. Bozkurt et alii, Frattura ed Integrità Strutturale, 35 (2016) 350-359; DOI: 10.3221/IGF-ESIS.35.40
356
It can be observed from Tab. 1 that repeated fracture tests yield consistent and repeatable fracture load values. In Fig. 12., a load displacement curve is shown for =45o and resulting fracture surface are shown. As can be seen from this figure, due to different signs of mode-II SIF on two sides of the specimen crack deflection angles are opposite to each other, i.e., upward in one side and downward in the other side.
Figure 11: Mode-I/III fracture test experiemntal set-up.
(a) (b)
M. Bozkurt et alii, Frattura ed Integrità Strutturale, 35 (2016) 350-359; DOI: 10.3221/IGF-ESIS.35.40
357
No Load Angle
Thickness
(mm) PQ (N)
Crack Length
(mm)
No Load Angle
Thickness
(mm) PQ (N)
Crack Length
(mm)
1 0 12.5 9264 24.2 10 45 12.5 10879 25.7
2 0 12.5 9100 25.6 11 45 25 23384 26.8
3 0 12.5 8900 25.8 12 45 25 23816 26.6
4 15 12.5 9343 25.9 13 60 12.5 13395 25.6
5 30 12.5 9931 25.9 14 60 12.5 13251 25.5
6 30 12.5 9873 26.2 15 60 25 26218 26.5
7 30 25 20715 26.1 16 60 25 27181 26.4
8 30 25 19686 26.5 17 75 12.5 14389 25.9
9 45 12.5 10957 25.7 18 90 12.5 14419 25.4
Table 2: Summary of mode-I/III fracture toughness tests.
COMPARISONS WITH MIXED MODE FRACTURE CRITERIA
n an effort to assess and compare with the existing mixed mode fracture criteria, three-dimensional stress intensity factors from the finite element analyses are combined with the experimental measurements and are applied to some of the existing criteria in the literature.
Comparisons with Some Existing Mixed Mode Fracture Criteria,
= 45oAs explained in a previous section, taking into account detailed three-dimensional finite element analyses along with submodeling of the CTT specimen, stress intensity factors were computed. Having computed the stress intensity factors, their values are used in different criteria from the literature to predict the mixed mode fracture load. The predicted fracture load is, then, compared with that obtained from the experiment, which reflects the analyzed problem. In what follows, application of this procedure to the case of = 45o and t = 25 mm and t = 12.5 mm is explained and results are provided in tables.
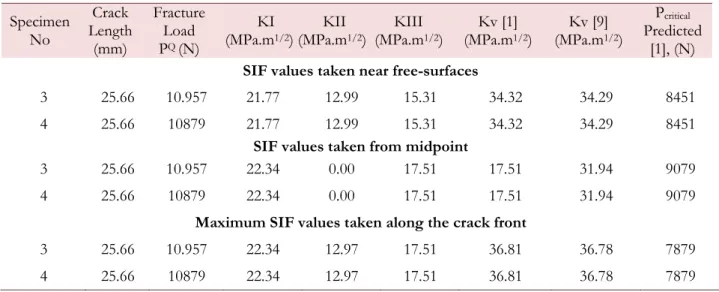
Since precrack lengths, which are measured after the tests, are not the same for all cases, additional analyses with a = 26 mm and 27 mm are also performed using the procedure decscribed in the previous section. Then, based on the pre-crack lengths measured, stress intensity factors are interpolated to reflect the actual crack length and the test conditions. The computed SIF values, then, are used in Richard’s [1] and Pook’s [9] 3D empirical fracture criteria to calculate an equivalent stress intensity factor, Kv. Fracture toughness of the Al-7075 used in this study is 29.1 MPa.m1/2 (taken as 29 MPa.m1/2). Predicted critical load values are determined by using the fracture toughness of the material and the calculated Kv values from the finite element analyses and the criteria used.
Using the procedure explained above, the comparison results for t = 25 mm are summarized in Tab. 3. In this table, crack length and fracture loads are test data. KI, KII, KIII are calculated SIF values for the crack length measured after the experiment. Kv values are the equivalent SIFs using two different criteria. As seen in the table, the predicted fracture loads are not very different between the first two cases, i.e., when SIFs are taken near the surface or at the mid-section. However, when maximum SIF components along the crack front are taken, regardless of their co-location on the crack front, the predicted fracture loads change considerably and become further away from the fracture load obtained from the tests. It is also observed from the table that, considerable difference exist between experimental and predicted fracture loads. Similar observations can also be made from Tab. 4 for the case of t = 12.5 mm, with the exception that predicted fracture loads are closer to experimental values than for the case of t = 25 mm. This point, along with opportunities for improved criteria, will be looked at as part of the future study.
M. Bozkurt et alii, Frattura ed Integrità Strutturale, 35 (2016) 350-359; DOI: 10.3221/IGF-ESIS.35.40 358 Specimen No Crack Length (mm) Fracture Load PQ (N)
KI KII KIII (MPa.m1/2) (MPa.m1/2) (MPa.m1/2)
Kv [1] (MPa.m1/2)
Kv [9] (MPa.m1/2)
Pcritical Predicted
[1], (N)
SIF values taken near free-surfaces
1 26.76 23384 11.52 4.39 6.77 16.00 15.99 18124
2 26.60 23816 11.48 4.25 6.77 15.89 15.88 18252
SIF values taken from midpoint
1 26.76 23384 12.07 0.00 7.74 15.85 15.85 18292
2 26.60 23816 12.02 0.00 7.72 15.79 15.79 18367
Maximum SIF values taken along the crack front
1 26.76 23384 12.07 4.39 7.74 17.09 17.09 16966
2 26.60 23816 12.02 4.25 7.72 16.96 16.95 17101
Table 3: Comparisons with existing criteria for Mode-I/III test - = 45o, t = 25 mm.
Specimen No Crack Length (mm) Fracture Load PQ (N)
KI KII KIII (MPa.m1/2) (MPa.m1/2) (MPa.m1/2)
Kv [1] (MPa.m1/2)
Kv [9] (MPa.m1/2)
Pcritical Predicted
[1], (N)
SIF values taken near free-surfaces
3 25.66 10.957 21.77 12.99 15.31 34.32 34.29 8451
4 25.66 10879 21.77 12.99 15.31 34.32 34.29 8451
SIF values taken from midpoint
3 25.66 10.957 22.34 0.00 17.51 17.51 31.94 9079
4 25.66 10879 22.34 0.00 17.51 17.51 31.94 9079
Maximum SIF values taken along the crack front
3 25.66 10.957 22.34 12.97 17.51 36.81 36.78 7879
4 25.66 10879 22.34 12.97 17.51 36.81 36.78 7879
Table 4: Comparisons with existing criteria for Mode-I/III test - = 45o, t = 12.5 mm.
CONCLUSIONS
umerical and experimental studies for mode-I/III fracture were performed in this study. Numerical analyses of the mixed mode test system, which involved apparatus and a Compact Tension Tearing specimen, and mode-I/III fracture experiments were done. The computed stress intensity factors are used to compare predicted fracture loads with experiments using some of the existing criteria. Results showed that predicted fracture loads are somewhat reasonably close to experimental measurements, but opportunities exist to further refine the predictions in terms of modeling and criteria development.
ACKNOWLEDGEMENTS
he financial support by The Scientific and Technological Research Council of Turkey (TÜBİTAK) for this study under project no 113M407 is gratefully acknowledged.
N
M. Bozkurt et alii, Frattura ed Integrità Strutturale, 35 (2016) 350-359; DOI: 10.3221/IGF-ESIS.35.40
359 REFERENCES
[1] Richard, H. A., Schramm B., Schitmeisen N.H., Cracks on mixed mode loading – Theories, experiments, simulations. Int. J. of Fat., 62 (2014) 93-105. DOI: 10.1016/j.ijfatigue.2013.06.019.
[2] Ayatollahi, M. R., Saboori B., A new fixture for fracture tests under mixed mode I/III loading. European. J. of Mech. – A/Solids., 51 (2015) 67-76. DOI: 10.1016/j.euromechsol.2014.09.012.
[3] Dhondt, G., Application of the finite element method to mixed-mode cyclic crack propagation, Int. J. of Fat., 58 (2014) 2-11. DOI: 10.1016/j.ijfatigue.2013.05.001.
[4] Kikuci, M., Wada, Y., Ohdama, C., Effect of KIII on fatigue crack growth behavior, J. of Eng. Mater. and Techn., 134 (2012) 51–59. DOI: 10.1115/1.4006978.
[5] Wei, Z., Deng X., Sutton M. A., Yan, J., Cheng, C. S., Zavattieri, P., Modeling of mixed-mode crack growth in ductile thin sheets under combined in-plane and out-of-plane loading. Engng Fract. Mech., 78 (2011) 3038-3101. DOI: 10.1016/j.engfracmech.2011.09.004.
[6] ANSYS, Version 12.0 Ansys Inc., Canonsburg PA, USA; (2009).
[7] Ayhan, A.O., Nied H. F., Stress intensity factors for three-dimensional surface cracks using enriched finite elements. Int. J. Numer. Meth. Eng., 54 (2002) 899-921. DOI: 10.1002/nme.459.
[8] Amer. Soc. for Test. and Mater. E399-12; Standard Test Method for Linear-Elastic Plane-Strain Fracture Toughness KIC of Metallic Materials