Annales
Geophysicae
Pre-noon high-latitude auroral arcs as a manifestation of the
interchange instability
A. E. Kozlovsky1,2, V. V. Safargaleev3, J. R. T. Jussila2, and A. V. Koustov4
1Sodankyl¨a Geophysical Observatory, Sodankyl¨a, FIN-99600, Finland
2Department of Physical Sciences, University of Oulu, Oulu, FIN-90014, Finland 3Polar Geophysical Institute, Apatity, 184200, Russia
4Department of Physics and Engineering Physics, University of Saskatchewan, Saskatoon, SK S7N 5E2, Canada
Received: 21 November 2002 – Revised: 12 March 2003 – Accepted: 17 April 2003
Abstract. On 7 December 2000, TV ASC camera in Barentsburg (Svalbard) observed pre-noon (at 09:00– 10:00 MLT) rayed auroral arcs, which occurred at the pole-ward edge of the auroral oval after an IMF transition from
By-dominated (By = +8.8, Bz = +4.3) to strongly north-ward dominated (By = +2.7, Bz = +8.6). The arcs ap-peared from the area of enhanced luminosity seen in the western (nightside) horizon, and developed to the east, pro-gressing at a velocity of about 1.5 km/s. Simultaneously, the arcs were drifting poleward at a velocity of 300–500 m/s, whose value was equal to the F-region ionospheric plasma drift velocity observed by the Incoherent Scatter Radar (ESR). The arc appearance and motion corresponded well to the poleward expansion of the auroral oval following the IMF shift, which was observed by the UVI on board the Polar satellite. The observed auroras were associated with closed LLBL indicated by the particle precipitation data from DMSP satellites showing also several-keV electrons of PS origin. The observations allow us to suggest that the arcs arise due to the interchange instability that starts to develop at the boundary between the magnetospheric plasma and the magnetosheath flux tubes entering the closed magneto-sphere due to the reconnection beyond the cusp after the IMF changes. The interchange instability can be suggested as a possible mechanism for the formation of the LLBL.
Key words. Magnetospheric physics (auroral phenomena; magnetopause, cusp and boundary layers; magnetospheric configuration and dynamics)
1 Introduction
1.1 Characteristics of morning auroral arcs
During magnetically quiet intervals, high-latitude east-west elongated faint multiple auroral arcs typically occur in
Correspondence to:A. E. Kozlovsky ([email protected])
the morning sector, as was shown by Defense Meteorog-ical Satellite Program (DMSP) auroral images (Meng and Lundin, 1986). Characteristics of the high-latitude discrete auroras in the 03:00–09:00 magnetic local time (MLT) sec-tor have been investigated in detail by Shiokawa et al. (1995, 1996, 1997), who used observations from ground-based sta-tions at magnetic latitudes (MLAT) of 78◦and 84◦in Canada. Shiokawa et al. (1996, 1997) have been calling these dis-crete auroras Sun-aligned arcs. By means of ground-based observations from Svalbard (at around 76◦ MLAT),
Sand-holt et al. (1998) presented a classification of auroral forms in the dayside ionosphere, where the Sun-aligned arcs in the 06:00–09:00 MLT sector are referred to as type 4 pre-noon arcs. Later, conjugated observations with Polar satel-lite were used to study the morning arcs in the context of the magnetosphere-ionosphere coupling at the 09:00– 10:00 MLT (Ober et al., 2000; Farrugia et al., 2000).
The above-mentioned studies suggest the following main characteristics of the morning high-latitude auroral arcs. These discrete auroras occur during northward interplane-tary magnetic field (IMFBz >0) as rayed multiple arcs lo-cated poleward of the diffuse aurora. The length of the arcs is typically a few hundred kilometers. The arcs are located on closed magnetic field lines and associated with particle precipitations from the boundary plasma sheet (BPS) (Ober et al., 2000) or from the low-latitude boundary layer (LLBL) (Shiokawa et al., 1997). The green (557.7 nm) emission in the arcs is larger than the red (630.0 nm) emission, suggest-ing precipitation of accelerated electrons. Most of the ob-served arcs drifted poleward with a velocity of the order of 500–1000 m/s (Shiokawa et al., 1995, 1997).
recon-PMAFs occur during southward IMF and correspond to type 1 in the classification of Sandholt et al. (1998).
The Sun-aligned arcs may occur within the large local time sector, from the early morning (∼03:00 MLT) magne-tospheric domain related to the magnetotail, to the pre-noon (around 09:00 MLT) region controlled by the solar wind-magnetosphere coupling. However, it is not known where the boundary is between the auroras that originated from the nightside and the dayside. For clarity, we specify that in the present study we shall pay most attention to the pre-noon (dayside) auroras.
1.2 Mechanisms of the formation of the high-latitude pre-noon auroral arcs
Several physical mechanisms have been suggested to explain the origin of the pre-noon auroral arcs. In the following we enumerate these mechanisms, indicating what type of result-ing arc motion there would be. We examine the motion along the north-south direction (i.e. across the stretching of the arcs), and the propagation of the arcs in the east-west direc-tion. The latter corresponds to the development or longitudi-nal expansion of the arc-like structures.
1. Lundin and Evans (1985) proposed a local injection of magnetosheath plasma into the dayside boundary layer as the dynamo process powering the high-latitude auro-ral arcs. The excess drift velocity of the injected mag-netosheath plasma relative to the background magne-tospheric plasma drives the local MHD dynamo. The dynamo region is capable of driving field-aligned cur-rents that couple to the ionosphere, where the upward current is associated with the auroral arcs. The arcs are expected to drift in the north-south direction following the ambient plasma convection, and to propagate west-ward.
2. Flow shear between the plasma sheet and the LLBL (at the inner edge of the LLBL) may cause the Kelvin-Helmholtz (K-H) instability, which produces local plasma irregularities, giving rise to the auroral arcs (Sh-iokawa et al., 1996). This mechanism implies that the LLBL should flow antisunward, in the same direction as the external magnetosheath flow which drives it. The plasma irregularities detached from the shear region
westward inside the LLBL.
3. The Kelvin-Helmholtz instability, acting at the magne-topause or at the inner edge of the LLBL, or both, can launch a fast magnetoacoustic wave across the mag-netic field lines. In the non-uniform background field and plasma environment of the magnetosphere, the fast magnetoacoustic wave couples its energy to an Alfv´en wave. This standing Alfv´en wave resonates on the L-shell which matches its frequency. Farrugia et al. (2000) discussed this model in connection with the pre-noon pulsating arcs. The field-aligned currents associated with the excited field line resonance (FLR) toroidal Alfv´en oscillations may produce the auroral arc. The position of such an arc is determined by the local FLR frequency, so one should not expect any regular motion of the arc in the north-south direction.
4. Kozlovsky and Kangas (2002) proposed one more model based on the FLR oscillations to explain dayside poleward moving auroral arcs on closed field lines. The FLR oscillations at the near-cusp L-shells can be excited by the Alfv´en impulse associated with the convection disturbance, which follows after variations in interplan-etary parameters. The period of the FLR increases with latitude, so even if FLR were excited at the same phase at all L-shells, a phase difference should later appear between the oscillations of neighboring L-shells. The phase difference first arises at lowest L-shells, where the periods are smallest, and then propagates to higher lat-itudes. The phase difference is connected with a shear in the east-west plasma flow, which results in the strips of field-aligned electric current stretched along the lat-itude. The strips of upward field-aligned current may be associated with auroral arcs. These arcs propagate poleward at the velocity, which would not show any de-pendence on the ionospheric plasma convection along the same direction.
(e.g. Kozlovsky and Lyatsky, 1994; Lyatsky and Sibeck, 1997). In Sect. 3 we shall discuss the interchange insta-bility in more detail.
Table 1 summarizes the above consideration about the ex-pected motion of the arcs generated due to various mecha-nisms. One can see that the north- or southward arc motion with respect to the ambient plasma convection is an impor-tant parameter indicating the mechanisms’ actions. One of the aims of the present study is to compare the velocity of the pre-noon arcs with the ionospheric plasma drift velocity mea-sured by the European Incoherent Scatter Radar (EISCAT). Earlier such studies were carried out for the near-noon arcs (Kozlovsky and Kangas, 2002) and the nightside arcs (Ko-zlovsky et al., 2001 and references therein).
One more goal is to investigate the arising of the pre-noon arcs and their development in the context of the magneto-spheric dynamics. The dayside auroral configuration is con-trolled by IMF (Sandholt et al., 1998). Hence, observations during the IMF change can be important to understand the aurora development and, in particular, the propagation along the east-west direction. Finally, we aim to select a proper mechanism to explain the origin of the observed pre-noon arcs.
2 Observations
The Polar Geophysical Institute (PGI) all-sky TV camera in Barentsburg on Svalbard (BAB, 78.1◦N, 14.2◦E) monitored
auroras during the polar winter of 2000–2001. Corrected ge-omagnetic latitude (MLAT) of the camera was 75.2◦, and
local magnetic noon occurred at about 08:52 UT (MLT≈ UT + 3 h). The European Incoherent Scatter Radar on Sval-bard (ESR) observed ionospheric ion velocity in the F-region over Svalbard. The radar is located in Longyearbyen (LYR, 78.2◦N, 15.8◦E). We have studied the TV camera data before local noon (06:00–10:00 MLT), during the intervals when the plasma velocity data were available, and looked for cases of pre-noon auroral arcs. In the present study we have used observations made on 7 December 2000. The ESR antenna was pointed toward 24◦, to the west of
geo-graphic north, at an elevation of 30◦, which allowed
line-of-sight ion velocity observations from 78− −80◦ MLAT at
the altitude of 200–300 km. For monitoring of the geophys-ical background we used solar wind data from the Wind and ACE satellites, global ultraviolet auroral images from the Po-lar satellite, particle precipitation data from the Defense Me-teorological Satellite Program (DMSP) satellites, and ground magnetic field data from the International Monitor for Auro-ral Geomagnetic Effects (IMAGE) magnetometer network.
In addition, data from the Super Dual Auroral Radar Net-work (SuperDARN) were used for monitoring the large-scale ionospheric plasma convection patterns. SuperDARN is a network of high-frequency (HF) coherent radars pro-viding measurements of the ionospheric plasma drift in a significant portion of the high-latitude ionosphere. In the
Northern Hemisphere, the radars cover magnetic latitudes of 65◦ − −85◦ and more than half of the globe in longi-tude. A detailed description of the system was given by Greenwald et al. (1995). The SuperDARN radars are sen-sitive to F-region electron density irregularities with scale sizes of 10–15 m. At the F-region heights, such irregulari-ties move with the convection velocity (E×Bdrift), so that the Doppler shift of received signals is the line-of-sight com-ponent of the convection velocity. By combining the mea-surements from all radars, a global scale convection map can be obtained. In the present study, we consider data from six radars located in Canada (Saskatoon, Kapuskasing, and Goose Bay), Iceland (Stokkseyri and Pykkvybaer), and Fin-land (Hankasalmi). The radars are positioned along∼ 60◦
geomagnetic latitude in the longitudinal range from 47◦W
to 103◦E (AACGM).
2.1 Observations from the space: IMF changing and con-traction of the polar cap
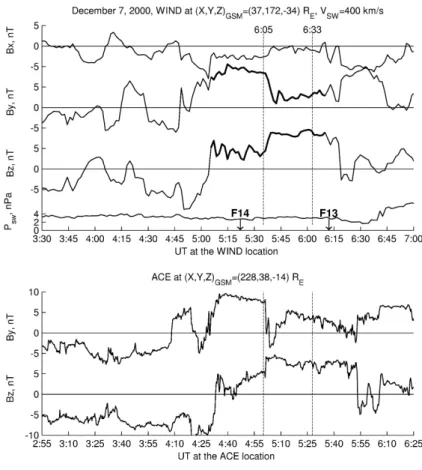
Figure 1 shows the IMF and the solar wind pressure (Psw) data obtained from the Wind satellite on 7 December 2000. At about 05:35 UT the satellite observed the IMF changing from aBy-dominated (By= +8.8 andBz= +4.3, averaged over 05:05–05:35 UT) to strongly northward (By = +2.7 andBz = +8.6, averaged over 05:40–06:10 UT). The Wind satellite was located atXGSM = 37RE,YGSM = 172RE, andZGSM = −34RE. Solar wind velocity was stable and equal to 400 km/s. The ACE satellite located atXGSM = 228RE,YGSM=38RE, andZGSM= −14REobserved this IMF changing at about 04:50 UT (bottom panel in Fig. 1), which is 35 min earlier than the observation by the Wind satellite. We estimated the transit time of the solar wind from the satellites to the Earth’s bowshock subsolar point (at 14.6RE) under the assumption that solar wind features tend to be aligned with the IMF. Such a method was described, for example, by Lockwood et al. (1989) and Liou et al. (1998). The total delay time to the ionosphere is the sum of this tran-sit time plus 5 min for passing the magnetosheath and 2-min Alfv´en transit time to reach the ionosphere (Lockwood et al., 1989), which gives the delay times of 30 and 68 min for the Wind and ACE satellites, respectively. The calculated delay times agree well with the 35-min delay between the satel-lites. Thus, the IMF-associate changes occurred in the day-side magnetosphere and ionosphere just after 06:05 UT.
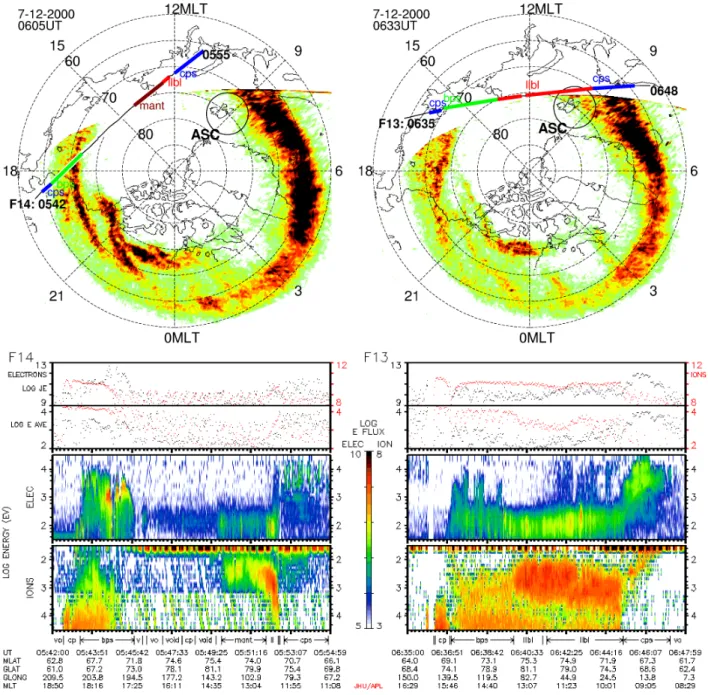
The IMF changing was associated with poleward shrink-age of the dayside auroral oval observed by the ultravio-let imager (UVI) on the Polar satellite. Two UV frames presented in Fig. 2 were obtained during dominant posi-tive IMFBy and strongly northward IMFBz conditions at 06:05 and 06:33 UT, respectively. Vertical dashed lines in Fig. 1 indicate the interplanetary parameters corresponding to these two frames. At around 10:00 MLT, the poleward edge of the luminosity progressed from 73◦ to 77◦MLAT
during 06:05–06:33 UT, and the corresponding progression from 72◦to 75◦MLAT was observed in the evening sector
Fig. 1.Top panel: the interplanetary pa-rameters measured by the Wind satel-lite. Bottom panel: the IMF measured by the ACE satellite. The transit times of the IMF disturbance from the satel-lites to the Earth’s polar cap ionosphere were 30 and 68 min for the Wind and ACE satellites, respectively. Vertical dashed lines indicate the interplanetary parameters corresponding to the Polar UVI frames in Fig. 2. Arrows indicate times of the DMSP satellites.
A contraction of the open polar cap area was shown by the particle precipitation data from F14 and F13 DMSP satel-lites, obtained at around 05:50 and 06:40 UT, respectively. These times (indicated by arrows in Fig. 1) approximately correspond to the Polar UVI frames in Fig. 2. Trajectories of the satellites are shown in the frames, where different col-ors along the trajectories indicate precipitations from differ-ent magnetospheric regions. The magnetospheric boundaries were identified using algorithms of Newell et al. (1991) from the DMSP spectrograms shown in the bottom of Fig. 2. For dominant positive IMFByat 05:50 UT, mantle precipitations showed the open-closed magnetic field boundary around the local noon at 73◦MLAT, and a narrow (∼ 1◦ in latitude) LLBL was equatorward of it. Later, during strong northward IMFBz, the LLBL expands poleward reaching at 06:40 UT at a latitude of 76◦CGM, at least.
2.2 Reconfiguration of the magnetospheric convection Imaging the large-scale convection has been done using the fitting technique described by Ruohoniemi and Baker (1998). This method derives large-scale convection maps based on all the available line-of-sight velocity data obtained from the six SuperDARN radars. The measurements are used to deter-mine a solution for the distribution of electrostatic potential expressed as a series expansion in spherical harmonics. The addition of data from a statistical model constrains the solu-tion in regions of no data coverage.
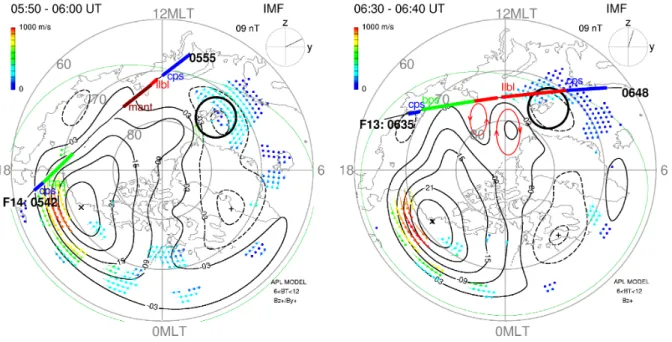
Figure 3 presents the global convection patterns averaged over 10 min for theBy-dominated (left panel) and strongly northward (right panel) IMF conditions. The solid (dotted) contours are associated with positive (negative) values of the electrostatic potential, and the contour interval is 6 kV. Ve-locity vectors implied by the fitting are plotted at the points where constraining velocity data were provided by either the measurements or the model. Trajectories of the DMSP satel-lites and the precipitations from the different magnetospheric regions are shown in the same way as in Fig. 2.
The convection diagrams in Fig. 3 can be interpreted in the terms of well-known IMF-dependent patterns of the magne-tospheric convection (e.g. Reiff and Burch, 1985).
For the dominant positive IMFBy(left diagram), the west-ward convection in the noon sector in the areas polewest-ward of the mantle precipitation (inside the polar cap) suggests the lobe convection cell (Reiff and Burch, 1985). After the IMF turning to a strongly northward orientation, a “four-cell” con-vection pattern has been established with a sunward flow in the cusp region, right panel in Fig. 3. We indicate by red ellipses in Fig. 3 the polar cap convection cells that are con-sistent with the SuperDARN potential contours.
Fig. 2. Two UV frames obtained duringBy-dominated (left) and strongly northward (right) IMF conditions. Trajectories of the DMSP satellites are shown on the frames, where different colors along the trajectories indicate precipitations from different magnetospheric regions. The magnetospheric boundaries were identified using algorithms of Newell et al. (1991) from the DMSP spectrograms shown in the bottom panels.
tubes (closed LLBL) drifting westward were observed in this region. One can suggest that these flux tubes contain the magnetosheath plasma captured after the reconnection be-yond the cusp.
2.3 Auroral observations from ground
The ASC TV camera in Barentsburg allowed for detailed studies of the auroral oval poleward shrinkage. The ASC observations agree with the Polar UVI data. Circles at about 09:00 MLT on the UVI frames (Fig. 2) show the camera’s
field-of-view. Before the IMF turning (during dominant IMF
By) the camera observed a single rayed arc in the south at about 73◦MLAT. After the IMF turning to strongly north-ward, auroral rays started to appear at higher latitudes, form-ing the rayed arcs propagatform-ing northward. A frame in Fig. 4 demonstrates a typical example of such an aurora.
Fig. 3. Global convection patterns averaged over 10 min for theBy-dominated (left panel) and strongly northward (right panel) IMF conditions. The solid (dotted) contours are associated with positive (negative) values of the electrostatic potential, and the contour interval is 6 kV. Velocity vectors implied by the fitting are plotted at points where constraining velocity data were provided by either measurements or the model. Trajectories of the DMSP satellites and the precipitations from different magnetospheric regions are shown in the same way as in Fig. 2. The polar cap convection cells are represented by red ellipses in the right panel.
that the auroras are located at heights of 145 to 180 km with the main maximum of occurrence at 150 km. Later, Jack and Hallinan (1994) analyzed videotapes of auroras from space shuttle missions and have obtained the same value of 150± 10 km for the lower edge of the auroral rays in the 09:00– 10:30 MLT sector. This value of 150 km is assumed in the present study for the rayed auroral arcs at 06:05–06:40 UT.
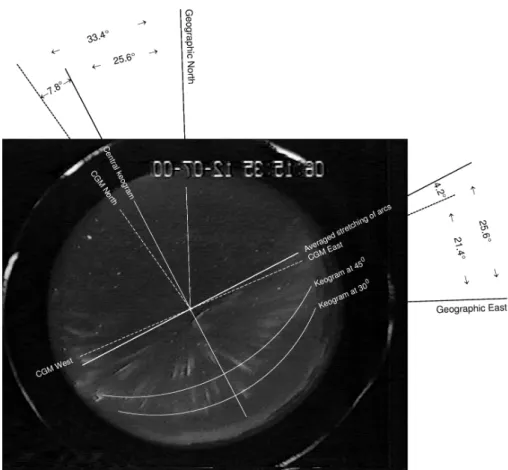
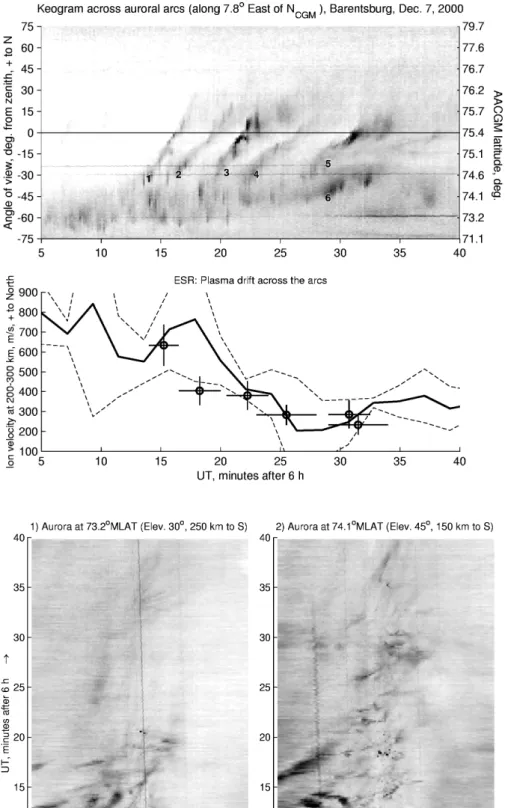
We have observed that the arcs were stretched at an aver-aged angle of (25.6±7.7)◦, from geographic east to north. Figure 4 shows the averaged orientation of the arcs in both geographic and geomagnetic (CGM) frames. Then we made a keogram across the averaged stretching (indicated as a cen-tral keogram in Fig. 4) to study the northward motion of the arcs. This keogram presented in Fig. 5 (top panel) demon-strates poleward propagation of the auroral forms (rayed arcs) that originated after the IMF turning to strongly north-ward. These multiple arcs followed each other at a spatial separation of the order of 80 km. Six arcs (indicated by num-bers in the keogram) were identified, and velocities of their poleward propagation were calculated from the keogram. Open circles and crosses at the bottom panel in Fig. 5 show values of these velocities and the errors estimated, respec-tively.
At the same time, the ESR radar measured the line-of-sight ionospheric plasma velocity at the elevation of 30◦ to the horizon. The radar was pointed at the azimuth of−24◦, which is at a small angle of 1.6◦to the keogram line, so the
ionospheric plasma velocity component across the arc could be derived with a good accuracy. Assuming the field-aligned ion velocity to be zero, we calculated this component of the
plasma drift velocity averaged over the height range of 200– 300 km. The drift velocity was measured just poleward of the discrete auroral forms (at 78–80◦MLAT), so it was prob-ably not affected much by small-scale disturbances associ-ated with the auroral rays. We consider this velocity value as representing the large-scale plasma convection in the re-gion of observations. The poleward plasma flow observed by ESR agrees with the SuperDARN global convection patterns (Fig. 3). However, the ESR observations are more reliable and allow for better temporal resolution.
In Fig. 5 (bottom panel), the plasma velocity component (solid line) is presented together with the velocities of the arcs drifting along the same direction. Dashed lines represent the velocity error range, which the value includes the mea-surement errors and also the uncertainties due to unknown field-aligned and across-beam components. Figure 5 shows that the arcs moved northward with the velocities in a range of 250–650 m/s, whose values corresponded well to the iono-spheric plasma drift velocity in the same direction.
Fig. 4.All-sky TV camera frame demonstrating a typical example of the pre-noon rayed auroral arcs. The averaged orientation of the arcs in both geographic and geomagnetic (CGM) frames is shown.
image). A typical velocity of the eastward propagation was of the order of 1.5 km/s (e.g. auroras at 06:07–06:15 UT and 06:16–06:20 UT in the left and right keograms, respectively, in Fig. 6). This propagation should be attributed to the mo-tion of the eastern end of the rayed arc rather than the moving of the individual rays forming the arc. Indeed, the rays are pulsating so that an individual ray may be observed during as short a time as a few seconds. In addition, large changes in the intensity may be associated with changes in the height of the luminosity. Therefore, it would be practically impossible to estimate the velocities of the rays.
We should also note that the eastward motion of the arc could not be explained by the apparent phase propagation due to a non-zero angle between the keogram line and the stretching of the arc. Indeed, to explain the eastward prop-agation as slow as 1.5 km/s, the angle should be of the or-der of 15–20◦for the northward velocities of 400–650 m/s,
observed at 06:15–06:20 UT. However, such an angle value is well outside of the 7.7◦ uncertainty in the orientation of
the arcs, so one suggests that the keograms in Fig. 6 show the true eastward propagation (or development) of the auro-ral arcs. Indeed, the keograms illustrate the eastward motion of auroras observed by the ASC and UVI.
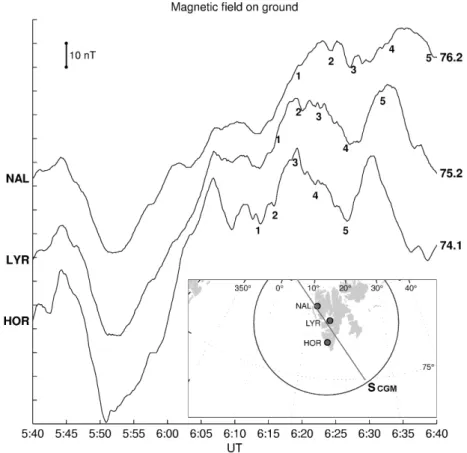
Ground-based magnetic observations were made at the IMAGE magnetometer network, which is shown in Fig. 7.
We used the data from three observatories, Hornsund, Longyearbyen, and Ny ˚Alesund, whose CGM latitudes are indicated on the right side in Fig. 7. Here, we consider the only magnetic field horizontal component across the stretch-ing of the auroral arcs (northward along the central keogram line in Fig. 4). This component responds to the Hall cur-rents along the arcs and represents variations in the westward plasma flow. Figures at the magnetograms in Fig. 7 indicate the times when the arcs with corresponding numbers (see Fig. 5) were located at the CGM latitude of a given obser-vatory. One can see that the arcs were associated with weak (of a few nT in amplitude) magnetic pulsations at a period of the order of 100–200 s. The poleward drift of the auroral arcs was accompanied by the propagation of the pulsation activity to higher latitudes. Below we consider the magnetic pulsa-tions in more detail, however, first we discuss the motion of the auroral arcs and the possible mechanisms for their origin.
3 Interpretation: The interchange instability
Ta-Fig. 5.Top panel: The keogram demon-strating poleward propagation of the au-roral forms (rayed arcs) originated af-ter the IMF turning to strongly north-ward. These arcs followed each other at a spatial separation of the order of 80 km. Six arcs (indicated by num-bers) were identified, and velocities of their poleward propagation were cal-culated from the keogram. Bottom panel: The plasma velocity component (solid line) is presented together with the velocities of the arcs drifting along the same direction (open circles and crosses). Dashed lines represent the ve-locity error range, whose value includes the measurement errors and also the un-certainties because of unknown field-aligned and across-beam components.
Fig. 7. Ground magnetic data from three observatories, Hornsund, Longyearbyen, and Ny Alesund,˚ of the IMAGE magnetometer network. Geomagnetic (CGM) latitudes of the observatories are indicated on the right side. Figures at the magnetograms indicate times when the arcs with corresponding numbers (Fig. 5) were located at CGM latitude of given observatory.
ble 1, the FLR excited by a convection disturbance (#4) or the interchange instability (#5) might allow for the observed motion of the auroras. If the arcs were generated due to the FLR mechanism, the northward propagation at the convec-tion velocity would be a random coincidence. Moreover, the FLR model does not imply any east-west propagation. Fi-nally, the arcs generated by the FLR are expected in a region of diffuse auroral luminosity (Kozlovsky and Kangas, 2002), which is not the case of the present study. Thus, the FLR model should be rejected, and the only interchange instabil-ity (#5) can be considered to explain the observed arcs.
The interchange instability may develop at the magneto-spheric boundaries separating plasmas of different energies. There is a certain analogy to the Rayleigh-Taylor instabil-ity. In some papers the terms “flute” (e.g. Pochotelov et al., 1980) or “ballooning” (e.g. Miura et al., 1989) are used. The interchange instability may develop if
dP /dW >−γ P /W, (1)
where W is a volume of the magnetic flux tube with unit magnetic flux,P is the plasma pressure, andγ is the adia-batic exponent (Kadomtsev, 1988).
Condition (1) may be satisfied at the plasma boundaries, where a gradient of the plasma pressure exists. Such a bound-ary appears in the dayside magnetosphere during northward IMFBz, when magnetosheath flux tubes enter the magneto-sphere due to the lobe reconnection beyond the cusp. The boundary between the newly-captured magnetosheath flux
tubes and other magnetospheric flux tubes may be unstable with respect to the interchange instability (Song and Russell, 1992).
If the angle between∇P and∇W is non-zero, then the interchange instability develops at the growth rate given by Volkov and Maltsev (1986):
Ŵ= |(ez·(∇W× ∇P ))| 46PBi
tanα 2
, (2)
whereBi is the ionospheric magnetic field magnitude,β is the gas-to-magnetic pressure ratio, 6P is the ionospheric Pedersen conductance, ez is the unit vector directed along the magnetic field, and α is the angle between two gradi-ents,∇(P Wγ)and∇(P−β/2W ). The angle αis non-zero in all the cases when∇P × ∇W 6=0. The instability splits the plasma-sheet plasma into tongue-like jets of rapid plasma flow, which can be associated with auroral arcs. The growth rate depends on the orientation of the developing structures having a maximum for the structures stretched along a bisec-tor of angleα.
Ŵσk=γ × 1+
σk (6P +6⊥/2) ×
1−1 4(k
2r2
i)+O(k4R4i)
, (3)
wherekis a wave number, σkand6⊥ are the field-aligned
conductivity and transverse conductance in the acceleration region, respectively, b is a vertical size of the acceleration region, andri is an averaged ion Larmor radius. Due to the dependence on the wave number, the most rapidly develop-ing structures are those havdevelop-ing a spatial period of the order of tens kilometres at the ionosphere level, whose value is close to the 80-km spatial periodicity of the pre-noon arcs in Fig. 5. The multiple auroral arcs originating due to the inter-change instability are associated with a periodical spatial structure in the electric fields and currents. When drifting northward, such a structure produces magnetic pulsations on the ground. For the observed spatial periodicity of 80 km, and northward velocity of 0.7–0.3 km/s, periods of the mag-netic pulsations on the ground should be of the order of 100– 300 s. Such pulsations were actually observed in the vicinity of the pre-noon auroral arcs (Fig. 7). However, magnetome-ters give an averaged effect from ionospheric currents in a latitudinal range of about 200 km, which include several 80-km spatial structures. Due to the averaging, the ground mag-netic effect is small.
To explain the basic idea of the interchange instability, we have used the simple model developed by Volkov and Malt-sev (1986) and Volkov (1988). This model implies a quasi-dipole magnetic field and a quasi-isotropic plasma distribu-tion. In general, stability and growth of the interchange and ballooning modes depend on the particular magnetic field and flow configuration, and spatial characteristics can also depend on the specific magnetic, pressure, and flow con-figuration. There is a wealth of literature during the past decade considering various aspects of these modes (see, for instance: Lakhina et al., 1990; Lee and Min, 1996; Miura, 2000; Ferri`ere, 2001, and references therein). However, even the simple approach presented by Volkov and Maltsev (1986) and Volkov (1988) suggests a good qualitative explanation for the experimental results of our study.
To summarize this section, the interchange instability can explain the following characteristics of pre-noon auroral arcs observed in the present study: origin during northward IMF, east-west orientation, spatial period, motions, ground-based magnetic signatures, and location in the vicinity of the
of the former (during strong IMFBy) polar cap boundary. Such a region was identified from the DMSP particle pre-cipitation data as a thick (from 76◦ to 70◦MLAT) LLBL
crossed at 06:40–06:44 UT (Fig. 2, right panels), that was shown by the precipitating ions at around one keV energies. Just equatorward of the LLBL, several-keV electrons show the magnetospheric plasma sheet (CPS). Due to the dense plasma of magnetosheath origin, the pressure is higher in the LLBL (Song and Russell, 1992), and the ∇(P Wγ) is pointed toward the LLBL at the plasma-sheet-LLBL bound-ary. Thus, the angleαin Eq. (2) is small. In such a case, the interchange instability creates east-west aligned struc-tures. These multiple structures are “tongues” of alternat-ing plasma flows: “tongues” of newly-captured plasma pen-etrate into the plasma sheet (westward), whereas “tongues” of the magnetospheric (CPS) plasma flows penetrate into the region of the newly-captured flux tubes (eastward). Corre-spondingly, a flow shear occurs between the contra-directed “tongue-like” structures. Hence, these structures can be as-sociated with field-aligned currents. The field-aligned cur-rents flowing from the ionosphere may cause auroras (e.g. Swift, 1981), and, additionally, the Kelvin-Helmholtz insta-bility may be responsible for the auroral fine structures in the shear region. The east-west aligned auroral arcs appear to develop away from the plasma-sheet-LLBL boundary. This development in the east-west direction is due to the smaller scale arc-associated plasma flows, rather than the large-scale westward convection observed in Fig. 3.
One can suppose that the auroral structures might develop in both sides from the boundary. The structures developing into the LLBL are observed as the poleward shrinkage of the auroral oval. In the case presented here, the plasma sheet was associated with the bright auroral oval, so auroral signa-tures of the interchange instability could not be observed on the bright background. This bright auroral oval was proba-bly associated with the substorm activity before the reported observations. However, in some other cases the auroral sig-natures of the interchange instability may be observed in the plasma sheet, if the auroral background is not so intense. In-deed, Ober et al. (2000) observed pre-noon discrete auroras as related to the boundary plasma sheet (BPS).
pre-noon part of the LLBL, which is seen in the right spectrogram in Fig. 2. On the other hand, the captured magnetosheath plasma penetrates into the plasma sheet. Indeed, on its defi-nition, the LLBL consists of a mixture of the magnetosheath and magnetospheric plasmas (Newell et al., 1991). Our ob-servations and interpretation agree well with the idea of Song and Russell (1992), who suggested the interchange instabil-ity as a possible mechanism for the LLBL formation during northward IMF. The pre-noon auroral arcs can be a visible manifestation of the instability.
Finally, we should mention that earlier Safargaleev et al. (2003) suggested the interchange instability to explain the origin of the high-latitude auroral arcs in the pre- and post-midnight sectors (after 18:00 MLT and before 06:00 MLT, re-spectively). These arcs were observed propagating westward and eastward in the pre-midnight and post-midnight sectors, respectively. The arc propagation corresponded to the az-imuthal expansion from the active auroras like the auroral bulge or WTS observed around midnight. The arcs drifted pole- or equatorward at the velocity whose value was close to one of the convection velocities in the same direction. Thus, characteristics of these arcs are similar to ones obtained in the present study for pre-noon arcs. Safargaleev et al. (2003) suggested that the nightside substorm activity is associated with the reconfiguration of the plasma and magnetic fields, which leads to changes in the angle between∇P and∇W
and, hence, the interchange instability development. This idea agrees with the result of Shiokawa et al. (1997), who re-ported that most of the earlier morning (04:00–08:00 MLT) Sun-aligned arcs occurred around the end of substorm-like magnetic activity. These earlier morning arcs are proba-bly related to substorm-associated reconfigurations in the nightside magnetosphere, whereas the pre-noon auroras are due to the dayside reconfigurations following interplanetary changes. However, both types of auroral arcs could be gen-erated due to the interchange instability.
5 Summary and conclusions
We have investigated high-latitude pre-noon multiple rayed auroral arcs, which occurred at the poleward edge of the auroral oval after the IMFBz turning from By-dominated (By = +8.8, Bz = +4.3) to strongly northward (By = +2.7, Bz = +8.6). The arcs were monitored at 09:00– 10:00 MLT on 7 December 2000 by the all-sky TV camera in Barentsburg, Svalbard (around 75◦MLAT). At the same time, the EISCAT radar located at Svalbard observed the F-region ionospheric plasma flow just poleward of the F-region of the auroral arcs. Our observations can be summarized as follows:
1. The arcs appeared from the area of enhanced luminosity seen in the western (nightside) horizon, and developed to the east, progressing at a velocity of about 1.5 km/s. 2. Simultaneously, the arcs were drifting poleward at a
ve-locity of 300–500 m/s, whose value was equal to the
F-region ionospheric plasma drift velocity observed by the radar.
3. The arc appearance and motion corresponded well to the poleward expansion of the auroral oval following the IMFBz turning to strongly northward, which was observed by the UVI on board Polar satellite.
4. The observed auroras were associated with closed LLBL indicated by the particle precipitation data from DMSP satellites also showing several-keV electrons of the plasma-sheet origin.
5. The arcs were associated with weak (of a few nT in am-plitude) magnetic pulsations at a period of the order of 100–200 s. Poleward drift of the auroral arcs was ac-companied by the propagation of the pulsation activity to higher latitudes. A period of the magnetic pulsa-tions corresponds to the observed poleward motion of the spatially periodical 80-km structure formed by the multiple arcs.
The observations allow us to suggest that the arcs arise due to the interchange instability that starts to develop at the boundary between the magnetospheric plasma and the mag-netosheath flux tubes entering the magnetosphere due to the reconnection beyond the cusp after the IMF Bz changing. Our observations and interpretation agree well with the idea of Song and Russell (1992), who suggested the interchange instability as a possible mechanism for the LLBL formation during northward IMF.
Acknowledgements. We thank A. Roldugin (PGI) for the BAB TV data of good quality and N. Safargaleeva (PGI Data Center) for the assistance in the TV data selection. We are indebted to the Direc-tor and staff of EISCAT for operating the facility and supplying the data. EISCAT is an International Association supported by Finland (SA), France (CNRS), the Federal Republic of Germany (MPG), Japan (NIPR), Norway (NFR), Sweden (NFR), and the United Kingdom (PPARC). We thank the Coordinated Data Analysis Web (CDAWeb) and the data providers G. Parks (U. Washington) for the Polar Ultraviolet Imager data, R. Lepping (NASA/GSFC) for the Wind magnetic field data, K. Ogilvie (NASA GSFC) for the Wind solar wind data, and N. Ness (Bartol Research Institute) for the ACE magnetic field data. We thank the Finnish Meteorolog-ical Institute and other institutes who maintain the IMAGE mag-netometer array. The DMSP particle detectors were designed by Dave Hardy of AFRL, and data obtained from JHU/APL. We thank Dave Hardy, Fred Rich, and Patrick Newell for its use. We thank all participants of the SuperDARN project who collected data used in this study. Fruitful discussions of the issues related to the paper with M. Watanabe are appreciated. Work of A. V. Koustov was sup-ported by a grant from NSERC (Canada). The Finnish Academy of Science and Letters Vilho, Yrj¨o and Kalle V¨ais¨al¨a Foundation sup-ported work of A. E. Kozlovsky and J. R. T. Jussila.
What is their exact definition? Eos Trans. AGU, 82, 420–421, 2001.
Frank, L. A., Craven, J. D., Gurnett, D. A., Shawhan, S. D., Burch, J. L., Winningham, J. D., Chappell, C. R., Waite, J. H., Maynard, N. C., Sugiura, M., Weimer, D. R., Heelis, R. A., Peterson, W. K., and Shelley, E. G.: The theta aurora, J. Geophys. Res., 91, 3177–3224, 1986.
Greenwald, R. A., Baker, K. B., Dudeney, J. R., Pinnock, M., Jones, T. B., Thomas, E. C., Villain, J.-P., Cerisier, J.-C., Senior, C., Hanuise, C., Hunsucker, R. D., Sofko, G., Koehler, J., Nielsen, E., Pellinen, R., Walker, A. D. M., Sato, N., and Yamagishi, Y.: DARN/SuperDARN: A global view of high-latitude convection, Space Sci. Rev., 71, 763–796, 1995.
Jack, T. M. and Hallinan, T. J.: Measurement of auroral rays from the space shuttle, J. Geophys. Res., 99, 8865–8872, 1994. Kadomtsev, B. B.: Collective phenomena in plasma, Nauka,
Moscow, 1–304, 1988.
Kozlovsky, A. and Kangas, J.: Motion and origin of noon high-latitude poleward moving auroral arcs on closed magnetic field lines, J. Geophys. Res., 107(2), SMP1, 1–13, 2002.
Kozlovsky, A., Lakkala, T., Kangas, J., and Aikio, A.: Response of the quiet auroral arc motion to ionospheric convection variations, J. Geophys. Res., 106, 21 463–21 474, 2001.
Kozlovsky, A. E. and Lyatsky, W. B.: Instability of the magnetosphere-ionosphere convection and formation of auroral arcs, Ann. Geophysicae, 12, 636–641, 1994.
Lakhina, G. S., Hameiri, E., and Mond, M.: Ballooning instability of the earth’s plasma sheet region in the presence of parallel flow, J. Geophys. Res., 95, 10 441–10 448, 1990.
Lee, D.-Y. and Min, K. W.: On the possibility of the MHD-ballooning instability in the magnetotail-like field reversal, J. Geophys. Res., 101, 17 347–17 354, 1996.
Liou, K., Newell, P. T., Meng, C.-J., Brittnacher, M., and Parks, G.: Characteristics of the solar wind controlled auroral emissions, J. Geophys. Res., 103, 17 543–17 557, 1998.
Lockwood, M., Sandholt, P. E., Cowley, S. W. H., and Oguti, T.: Interplanetary magnetic field control of dayside auroral activity and the transfer of momentum across the dayside magnetopause, Planet. Space Sci., 37, 1347–1365, 1989.
Lundin, R. and Evans, D. S.: Boundary layer plasmas as a source for high-latitude, early afternoon, auroral arcs, Planet. Space Sci., 33, 1389–1406, 1985.
Lyatsky, W. B. and Sibeck, D. G.: Central plasma sheet disruption and the formation of dayside poleward moving auroral events, J. Geophys. Res., 102, 17 625–17 630, 1997.
Meng, C.-I. and Lundin, R.: Auroral morphology of the midday
Sandholt, P. E., Farrugia, C. J., Weber, E. J., and Scudder, J. D.: Mapping prenoon auroral structures to the magnetosphere, J. Geophys. Res., 105, 27 519–27 530, 2000.
Pokhotelov, O. A., Buloshnikov, A. M., and Pilipenko, V. A.: Hy-dromagnetic stability of the outer boundary of trapped radiation, Geomagn. Aeron., Engl. Transl., 20, 289–292, 1980.
Reiff, P. H. and Burch, J. L.: IMFBy-dependent plasma flow and Birkeland currents in the dayside magnetosphere. II – A global model for northward and southward IMF, J. Geophys. Res., 90, 1595–1609, 1985.
Ruohoniemi, J. M. and Baker, K. B.: Large-scale imaging of high-latitude convection with Super Dual Auroral Radar Network HF radar observations, J. Geophys. Res., 103, 20 797–20 812, 1998. Safargaleev, V. V., Kozlovsky, A. E., Osipenko, S. V., and Tagirov, V. R.: Azimuthal expansion of high-latitude auroral arcs, Ann. Geophysicae, in press, 2003.
Sandholt, P. E., Farrugia, C. J., Moen, J., Noraberg, O., Lybekk, B., Sten, T., and Hansen, T.: A classification of dayside auroral forms and activities as a function of interplanetary magnetic field orientation, J. Geophys. Res., 103, 23 325–23 345, 1998. Shiokawa, K., Yumoto, K., Hayashi, K., Oguti, T., and McEwen, D.
J.: A statistical study of the motions of auroral arcs in the high-latitude morning sector, J. Geophys. Res., 100, 21 979–21 986, 1995.
Shiokawa, K., Yumoto, K., Nishitani, N., Hayashi, K., Oguti, T., McEwen, D. J., Kiyama, Y., Rich, F. J., and Mukai, T.: Quasi-periodic poleward motions of Sun-aligned auroral arcs in the high-latitude morning sector: A case study, J. Geophys. Res., 101, 19 789–19 800, 1996.
Shiokawa, K., Ogino, T., Hayashi, K., and McEwen, D. J.: Quasi-periodic poleward motions of morningside Sun-aligned arcs: A multievent study, J. Geophys. Res., 102, 24 325–24 332, 1997. Song, P. and Russell, C. T.: Model of the formation of the
low-latitude boundary layer for strongly northward interplanetary magnetic field, J. Geophys. Res., 97, 1411–1420, 1992. Starkov, G. V.: Auroral heights in the polar cap, Geomagn. Aeron.,
Engl. Transl., 8, 28–32, 1968.
Swift, D. W.: Mechanisms for auroral precipitation: A review, Rev. Geophys. Space Phys., 19, 185–211, 1981.
Volkov, M. A. and Maltsev, Yu. P.: Flute instability of the in-ner plasma sheet boundary, Geomagn. Aeron., Engl. Transl., 26, 671–673, 1986.