www.earth-surf-dynam.net/2/21/2014/ doi:10.5194/esurf-2-21-2014
©Author(s) 2014. CC Attribution 3.0 License.
Earth
Surface
Dynamics
Seismic constraints on dynamic links between
geomorphic processes and routing of sediment in a
steep mountain catchment
A. Burtin1, N. Hovius1, B. W. McArdell2, J. M. Turowski1, and J. Vergne3 1GeoForschungsZentrum, Helmholtz Centre Potsdam, Potsdam, Germany
2Swiss Federal Institute for Forest, Snow and Landscape Research WSL, Birmensdorf, Switzerland 3École et Observatoire des Sciences de la Terre, CNRS UMR7516, Strasbourg, France
Correspondence to:A. Burtin ([email protected])
Received: 30 October 2013 – Published in Earth Surf. Dynam. Discuss.: 15 November 2013 Revised: 7 January 2014 – Accepted: 13 January 2014 – Published: 23 January 2014
Abstract. Landscape dynamics are determined by interactions amongst geomorphic processes. These
interac-tions allow the effects of tectonic, climatic and seismic perturbations to propagate across topographic domains,
and permit the impacts of geomorphic process events to radiate from their point of origin. Visual remote sensing and in situ observations do not fully resolve the spatiotemporal patterns of surface processes in a land-scape. As a result, the mechanisms and scales of geomorphic connectivity are poorly understood. Because many surface processes emit seismic signals, seismology can determine their type, location and timing with a resolution that reveals the operation of integral landscapes. Using seismic records, we show how hillslopes and channels in an Alpine catchment are interconnected to produce evolving, sediment-laden flows. This is done for a convective storm, which triggered a sequence of hillslope processes and debris flows. We observe the evolution of these process events and explore the operation of two-way links between mass wasting and channel processes, which are fundamental to the dynamics of most erosional landscapes. We also track the characteristics and propagation of flows along the debris flow channel, relating changes of observed energy to the deposition/mobilization of sediments, and using the spectral content of debris flow seismic signals to
qualitatively infer sediment characteristics and channel abrasion potential. This seismological approach can help to test theoretical concepts of landscape dynamics and yield understanding of the nature and efficiency
of links between individual geomorphic processes, which is required to accurately model landscape dynamics under changing tectonic or climatic conditions and to anticipate the natural hazard risk associated with specific meteorological events.
1 Introduction
Geomorphic processes seldom occur in isolation. Instead, multiple processes acting on different parts of the landscape
tend to occur together, in linked, two-way fashion during ge-omorphic events. The nature and efficiency of these
interac-tions determines landscape response to external forcing. Hill-slopes and channels in active landscapes are coupled through the effects of sediment transfer (Whipple, 2004). Hillslope
processes supply sediment to streams (Hovius et al., 2000), which use it to carve their channel beds (Sklar and Dietrich,
2001; Attal and Lavé, 2006; Turowski et al., 2007; Cook et al., 2013). Channel erosion, in turn, can undercut hillslopes and cause further slope erosion (Densmore et al., 1997). This two-way link between channels and slopes permits the tec-tonic deformation of river long profiles (Burbank et al., 1996; Snyder et al., 2000; Attal et al., 2008) and climatic forcing to affect erosion on adjacent hillslopes (Korup et al., 2010).
(Hartshorn et al., 2002; Stark et al., 2010). Even on the scale of an individual rainstorm, the transfer of sediment from hill-slopes to channels and the effects of the resultant flow on the
surrounding topography can propagate the impact of local-ized erosion to locations far outside its original footprint.
Despite their fundamental importance to the dynamics of landscapes, observational constraints on the links between geomorphic processes and the progress of eroded material are scarce (Yanites et al., 2011) because remote sensing and in situ monitoring of geomorphic activity do not have the required resolution. Remotely sensed imagery has a spatial resolution at the metre-scale (Hervas et al., 2003; Lin et al., 2004; Saba et al., 2010) but a temporal resolution that de-pends on the timing of overhead passage and also on cloud cover. This is not sufficient to constrain the way in which
individual processes are linked in a single geomorphic event. In contrast, ground-based monitoring that includes in situ ob-servations provides the required temporal characteristics but tends to have a spatial extent that does not cover geomor-phic process systems in their entirety (Itakura et al., 2005; McArdell et al., 2007). For example, downstream, in-channel monitoring can yield frequent and localized measurements of flow properties that result from the integration of various up-stream processes, but does not generally allow for this signal to be deconvolved in order to establish the pattern of geo-morphic activity in the contributing catchment. To improve constraints on landscape dynamics at the catchment scale, it is, therefore, required to have observations with a sufficient
spatial resolution to determine where individual geomorphic processes occur and a high temporal resolution constraining the timing of their occurrence as well as their interplay.
Seismological data have the potential to enhance high-resolution surveys of landscape dynamics. Like any en-vironmental process, geomorphic activity displacing mass along the Earth’s surface produces ground vibrations that are recorded at distant seismometers (Govi et al., 1993; Brodsky et al., 1999; Burtin et al., 2009; Lacroix et al., 2012). Seis-mic instruments operate with a high sampling rate, giving data coverage, potentially for years, at high temporal reso-lution. Moreover, with several sensors, the respective timing of seismic signals at individual stations allows the location of geomorphic sources. Finally, the amplitude and frequency characteristics of seismic signals allow the identification of individual processes (Huang et al., 2007; Burtin et al., 2013). Thus, where background seismic noise is weak relative to the geomorphic signal, seismic records can be used to re-solve erosion and sediment transport with useful spatiotem-poral detail. Such an approach has been used to study inci-dents of landslide motion (Deparis et al., 2008; Favreau et al., 2010), rock avalanches (Dammeier et al., 2011), debris flow (Itakura et al., 2005; Arattano and Marchi, 2008; Badoux et al., 2009) and bedload transport (Burtin et al., 2010, 2011; Hsu et al., 2011). However, these studies have not typically considered the interplay of different geomorphic processes
at the landscape scale. With a two-dimensional network of 1
Figure 1.The Illgraben catchment. Location of the Illgraben catch-ment (∼10 km2, outlined in black) in Switzerland (dot in the inset
map) and of the seismological stations deployed there during sum-mer 2011 (inverse triangles, labelled IGBnn), meteorological sta-tions from the Swiss Federal Institute for Forest, Snow and Land-scape Research WSL (circles, labelled ILLn), and check dam 29 (CD29, square) where the flow depth and bedload impact rates of the study were observed.
seismometers, it is possible to scan for patterns of geomor-phic activity across a landscape in continuous mode unlike any existing geomorphic technique (Burtin et al., 2013). We did this in the Illgraben, a steep mountain catchment in the Swiss Alps. With an array of ten instruments it was possi-ble to track sediment moving from hillslopes into and along channels, obtaining constraints on the two-way link that ex-ists between these two topographic domains. In addition, the analysis of seismic records along the main stream of the Ill-graben catchment permitted observation of the downstream evolution of flow events arising from headwater erosion.
2 Experiment settings
2.1 Study area
The Illgraben catchment supplies 5–15 % of the sediment load of the Rhone River (Schlunegger et al., 2012) from a small catchment area of about 10 km2 (Fig. 1). This high
yield reflects the large catchment relief of>2 km and slopes
with an average gradient of 40◦ in fractured sedimentary
slope of 16 % in bedrock that connects with the Rhone River across a debris fan with a gradient of 10 % (Badoux et al., 2009).
The channel is equipped with a debris flow monitoring system that uses geophone sensors bolted to three diff
er-ent check dams located inside the catchmer-ent. Sedimer-ent im-pacting, rolling or sliding on these check dams activates the geophones and if the recorded impulse rate exceeds a pre-determined threshold, an alarm is triggered (Badoux et al., 2009). In addition, flow depth is monitored with laser sensors and sediment impact frequency with force plates at the out-let of the debris fan (CD29, Fig. 1) (McArdell et al., 2007), and flow events are registered by video cameras at this site. The setup is complemented by three automatic weather sta-tions along an elevation transect in the catchment (ILL1-3, Fig. 1). This combination of frequent geomorphic events and existing instrumentation makes the Illgraben a suitable lo-cation for development and testing of seismic monitoring of geomorphic processes. For future deployment, seismic mon-itoring does not require this extreme rate of activity and can be used in locations where surface processes occur at more modest rates. Despite the anomalously high rate of erosion, the simple geomorphic structure, with a single trunk channel flanked by steep, dissected hillslopes, and the commonality of the dominant surface processes in the catchment should make our findings relevant and portable rather than unique. Notably, long-term observation of the Illgraben has given de-tailed insight into the meteorological preconditions for debris flow occurrence and flow mechanics (Schürch et al., 2011), but understanding of their origin and downstream evolution has remained difficult (Bennett et al., 2013).
2.2 Seismological data set
During the summer of 2011, we deployed ten seismometers in and around the Illgraben catchment (labelled IGB01 to IGB10 Fig. 1) in a 2-dimensional (2-D) geometry with an average instrument spacing of 2.88 km. Three stations were placed along the central channel to monitor flow processes, and the remaining seven were located in a ring that sur-rounded the catchment to record geomorphic activity on hill-slopes. With this configuration, we aimed to record the ac-tivity on hillslopes and survey the spatiotemporal behaviour of flows in the Illgraben main channel. The seismic instru-ments were intermediate band Güralp CMG-6TD (IGB01, IGB03 to IGB07), Güralp CMG-40T (IGB02) and short pe-riod Lennartz LE-3Dlite (IGB08 to IGB10) seismometers. With the exception of the CMG-40T instrument, which has a flat response in the [0.033–50] Hz frequency band, all in-struments had a flat response in at least the [1–100] Hz fre-quency band. This high-frefre-quency band is well suited to the study of geomorphic processes (e.g. Helmstetter and Garam-bois, 2010; Burtin et al., 2011). The sampling frequency rate was set to 200 samples per second (SPS) for the intermediate band sensors and 125 SPS for the short period instruments.
1
Figure 2.Spectral and temporal characterizations of surface pro-cesses.(a)Mean 10 min rainfall intensities recorded in the Illgraben
catchment (gauges ILL1–3) on 13 July 2011. The gray shaded interval delineates the occurrence of debris flows.(b–c)
Spectro-grams for the same time period of the seismic signals recorded at station IGB02, located along the main channel, and station IGB05, outside the catchment. The amplitude is given in decibel relative to the velocity.
The seismic stations recorded for up to 100 days, but here we focus on a single rainstorm on 13 July 2011, which had the largest daily cumulative rainfall of the summer with 27 mm (Fig. 2a). This storm caused a debris flow that triggered the warning system. The debris flow propagated through the Ill-graben catchment and over the debris fan and eventually en-tered the Rhone River.
2.3 Rainfall record
0.84 to 0.91. Therefore, the precipitation rates averaged over these three locations well illustrate the meteorological condi-tions of this day in the Illgraben catchment. Some precipita-tion occurred early in the day, preceding a convective rain-storm in the afternoon with 2/3 of the daily rainfall total
(Fig. 2a). Compared to historical records for the Illgraben, this convective storm with a total precipitation of 18 mm was not exceptional; similarly sized rain storms are not uncom-mon in the catchment during the summer season. Notably, the peak 10 min rainfall intensity of 2.6 mm, which was ob-served at the start of the storm, did not result directly in the occurrence of a debris flow. Instead, the debris flow warning system in the Illgraben was triggered in the later part of the storm, when 60 % (11 mm) of cumulative precipitation had already occurred.
3 Data processing
3.1 Spectral analysis
A time–frequency analysis of the continuous seismic data shows the main features of seismic signals (e.g. Burtin et al., 2008). Spectrograms were calculated with a power spec-tral density (PSD) approach. To compute the PSD of a time series, we first detrended the seismic signal, subtracted the mean, and deconvolved the instrument response. Then we used a multitaper method to estimate the power spectrum in one-minute time windows without overlap (Thomson, 1982). This PSD estimate offers a good frequency resolution despite
the use of short duration seismic signals, which decrease the number of computed frequencies in a spectrum.
3.2 Event location method
Spectrograms of our seismic records show a number of events with durations of no more than a few tens of sec-onds, high-frequency content, and complex source time func-tions. These are the principal seismic characteristics of rock-falls (Helmstetter and Garambois, 2010). Such rock-falls consti-tute well-defined sources of seismic energy, and it should be possible to determine their location. However, locating is made difficult by the high-frequency content and
com-plexities in the source time functions of the signals of rock-falls and other erosion processes, which suppress coherence of waves between stations (Burtin et al., 2009; Lacroix and Helmstetter, 2011). Moreover, it is not possible to consis-tently identify specific seismic wave types such as body or surface waves in the absence of constraints on the velocity structure of the survey area, precluding the drawing of ray paths in the medium. Nevertheless, the location of hillslope processes can be determined with methods based on cross-correlation of seismic waveforms or envelops. Two types of approaches exist. One employs the maximization of coherent seismic signals (waveforms or envelops) and is called beam-forming method (Almendros et al., 1999; Lacroix and
Helm-stetter, 2011). We employed another approach based on prob-ability density function, which is computationally cheaper. It uses the cross-correlation of seismic signals between sta-tions to determine the time delays that give optimally coher-ent observations across the instrumcoher-ent network (Burtin et al., 2009). Then the migration of these observed time delays, that is, the conversion from time to distance, can be used to retrieve the origin of an event. The cross-correlation of wave packets may include a combination of body and sur-face waves. For this reason, we preferred the use of a simple ballistic propagation, taking into account the topography in our migration procedure.
Specifically, forNavailable stations we first detrended the
vertical seismic signal, removed the mean and deconvolved the instrument response. Next, we identified the frequency band with the maximum signal-to-noise ratio (SNR) for a given event. This was done by exploring frequencies ranging from 1 to 45 Hz, the dominant frequency band for hillslope processes, with a bandwidth increasing from 0.5 to 10 Hz. The seismic signals were bandpass filtered and we kept the results with the highest average SNR for all stations com-bined. Prior to computation of time delays in the selected frequency band, we normalized the time series to their max-imum amplitude. For a pair of stations with indexi1andi2,
we cross-correlated the seismic recordings and determined the time delay dti1i2
obs that corresponds to the maximum
am-plitude of the correlation function envelope. The time range of exploration should take into account the distance between stationsi1andi2with respect to the topography dli1i2and the
presumed propagation velocityV. Therefore, it corresponds
to dti1i2
obs∈ h
−dli1i2/V,+dli1i2/Vi. (1)
With a set ofN(N−1)/2 time delays, we implemented a
mi-gration step to convert time delays into distances for the event location, using a ballistic propagation (constant velocity) that takes into account the topography of the Illgraben catchment. The ray paths were assumed to follow the surface topogra-phy if it is the shortest path, and otherwise to cut through substrate (Fig. S1).
For each grid point (x,y) of the domain, we compared the
calculated time delay dtcalcand the observed time delay dtobs
for an event source at the surface according to the probability density function
ρd(x,y,V)=
N−1
X
i1=1
N X
i2=i1+1
e −
(dticalc1i2−dtiobs )1i22
2σdt(V)2 , (2)
whereσdt(V) is the time error. We allowed this parameter to vary with the velocity in order to conserve a constant distance error of 0.2 km. A larger value would give event locations with a large uncertainty, whereas setting a smaller distance error might negatively affect the ability to properly locate
an event. Since the propagation velocity is unknown, we ex-plored a wide range of possible values, from 0.2–1.5 km s−1
for high-frequency seismic waves travelling near the surface. To increase the accuracy of the location method, we intro-duced an a priori probability density functionρm(x,y), which
is centred on the location of the station that first recorded the arrival of the event, following the expression
ρm(x,y)=e
−(
x−xfirststa)2+
y−ystaf irst
2
2σ2prior
. (3)
wherexfirststa andyfirststa are the coordinates of the seismic station,
andσprior is the error on the assumption. This error was set
at 1.60 km, the mean value of the inter-station distance of the three nearest stations of the Illgraben array. Hence, the final probability density functionρfinal(x,y,V) is given by the
relation
ρfinal(x,y,V)=ρd(x,y,V)×ρm(x,y). (4)
We then looked for the maximum amplitude ofρfinal(x,y,V)
to retrieve the best propagation velocity (Vbest) and location
of the event. To delimit the most likely location, we normal-izedρfinal(x,y,V) to the maximum amplitude and kept grid
points that exceeded an arbitrary, conservative threshold of 0.75 (note, 0.95 is customary in seismic location methods).
To determine the time delays between seismic stations, we tested two methods based on the cross-correlation of seismic waveforms and seismic envelopes commonly used for landslides and non-volcanic tremors (e.g. Burtin et al., 2009; Zhang et al., 2010). Differences between the use of
seismic waveforms and envelopes were generally but not al-ways small. Figure S2 shows the vertical seismic signals at two paired stations (IGB03-IGB04 and IGB01-IGB05) for a rockfall event (rock 1, see Sect. 4) to which we paid par-ticular attention, together with the cross-correlation of seis-mic waveforms and seisseis-mic envelopes. For the station pair IGB03-IGB04, the difference between the two methods was
only 0.14 s (Fig. S2e–f). For the pair IGB01-IGB05 and in the interval dtobs, which is coherent with the distance between
stations and the best fit velocity (0.5 km s−1
, see Sect. 4), the time difference was 0.42 s (Fig. S2g–h). A difference
of this magnitude has a limited impact on the accuracy of the location. However, the peak of amplitude of the cross-correlation function from envelopes was not located in the interval dtobsof exploration (Eq. 1). It registered instead with a delay of 7.6 s (Fig. S2h) and was not detectable on the cross-correlation function computed from the seismic wave-forms (Fig. S2g). This discrepancy is not problematic since the peak is out of the interval of exploration. However, for ballistic velocities of 0.2 and 0.3 km s−1, this peak coincided
with the best time delay for the pair IGB01-IGB05. This could give rise to merger or interference with peaks from other station couples and would influence the accuracy of event location. Although such a detailed analysis was not made systematically, we think that the observed behaviour may be representative. Since the use of a cross-correlation of seismic waveforms gave better constraints on the location,
we gave preference to this approach rather than the cross-correlation of seismic envelopes.
4 Rockfalls and flow pulses
4.1 Seismic signals and sources in the Illgraben
Daily spectrograms for 13 July 2011 at stations IGB02 and IGB05 illustrate the main characteristics of the seismic sig-nal in the Illgraben catchment (Fig. 2). Along the stream, IGB02 recorded episodes of elevated high-frequency seis-mic energy that are consistent with the occurrence of rain-fall. The episode with highest energy recorded at this station coincided with the convective afternoon storm and the en-suing flow sequence, which activated the debris flow detec-tion and warning system of the Illgraben at 17:15 local time. This time coincidence of meteorological events, seismically recorded activity and independent flow detection are initial evidence for a seismic signal induced by channel processes. Lasting for 6 h, the seismically recorded channel activity is likely to have included bedload-transporting flows as well as debris flows, both of which can be registered by the warning system (Badoux et al., 2009).
Away from the channel, stations like IGB05 did not ex-hibit such long period activity (Fig. 2). During the convective rainstorm, they recorded discrete bursts of high-frequency seismic energy (>1 Hz) lasting several tens of seconds. On
seismograms, these events have short, impulsive peaks as-sociated with multiple sources located at or near the sur-face. These characteristics are common for rockfalls and rock avalanches (Deparis et al., 2008; Helmstetter and Garambois, 2010; Dammeier et al., 2011). The potential increase of high-frequency seismic energy induced by the channel activity may prevent detecting the rockfall activity (Burtin et al., 2013). However, the stations deployed around the catchment, like IGB05, are not affected by such a source. Indeed, in
contrast to other locations like the Himalayas (Burtin et al., 2008) or Taiwan (Hsu et al., 2011), the Illgraben channel has a limited extent, which reduces its capacity to produce an el-evated background seismic noise. Therefore, the possible oc-currence of a debris flow does not alter our ability to detect a significant slope activity.
High-frequency seismic signals can also have an anthro-pogenic origin (McNamara and Bulland, 2004). However, short-duration human disturbances in the Illgraben catch-ment were mainly restricted to the occasional passage of hik-ers, whose signals are only recorded over distances of tens of metres from a station. Noise from traffic, construction and
1
Figure 3.Seismic records of principal geomorphic activity in the Illgraben associated with rainfall on July 13, 2011.(a)Mean of
10 min rainfall intensity recorded at stations ILL2 and ILL3, inside the Illgraben (see Fig. 1).(b–e)Spectrograms in decibel of the
ver-tical seismic signal at stations IGB07(b), IGB01(c), IGB02(d)
and IGB09(e). Note the downstream propagation of seismic energy
pulses 1–3. Propagation velocities ranged from 1.0–4.5 m s−1.
Ver-tical white lines on(c)delimit the time span of Fig. 4.
the spectrograms of stations IGB01 and IGB07 (Fig. 3), lo-cated inside and at the high western periphery of the catch-ment, respectively. For the day of study, two local earth-quakes were reported by the Swiss Seismological Service (SED). They both occurred in the morning at 04:30:59 UTC (Ml 0.7) and 05:56:24 UTC (Ml 1.2) at distances of 20 km and 28 km from the Illgraben catchment, respectively. There-fore, we can exclude local tectonic events as potential sources of the signals we recorded and as triggers of surface pro-cesses during the rainstorm.
4.2 Seismic anatomy of a debris flow sequence
Focusing on the flow sequence starting at 15:15 UTC, sta-tions along the channel recorded seismic activity with a broad high-frequency content ([1–50] Hz) that occurred in three main episodes (pulses 1–3, Fig. 3). Lasting about 10 min each, these seismic energy pulses were timed progressively later at consecutive stations along the channel, showing the downstream propagation of their source. The coincidence be-tween the occurrence of these propagating seismic pulses and debris flows reported by the warning system in the Illgraben
1
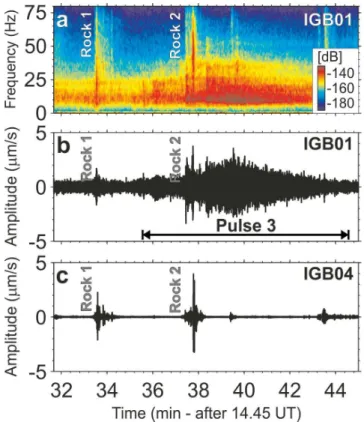
Figure 4.Linked mass wasting and channel flow in the upper Ill-graben during flow pulse 3.(a)Spectrogram of the vertical seismic
signal at station IGB01 during the flow pulse 3. The seismic en-ergy is given in decibel relative to the velocity. Two rock avalanches (rocks 1 and 2) caused a short, sharp increase of the seismic energy at high-frequency (>1 Hz). The gradual increase of the seismic
en-ergy over the time interval shown here reflects the increase of chan-nel activity and the approach and passage of a flow pulse.(b–c)
Vertical [1–50] Hz bandpass filtered seismograms at stations IGB01
(b)and IGB04(c). Note the absence of channel-induced seismic signals at station IGB04 and the prominence of signals from rock-falls 1 and 2 at both stations.
channel implies a link between them and we propose that the mobile seismic pulses represent the downstream propa-gation of three flow events. Furthermore, detailed analysis of the structure of these episodes reveals that at station IGB01, high on the central channel (Fig. 3c), the initial flow pulse had a gradual onset and was not clearly separated from the second pulse, even though they were so further downstream. In the upper Illgraben, the third flow pulse had a distinct and stronger seismic signal. Notably, this flow pulse was pre-ceded by a short duration signal with rockfall characteris-tics, which was recorded at most stations (rock 1 at∼33 min,
Fig. 4). The location of this event is key to understanding its possible connection to the third flow pulse.
1
Figure 5.Location of mass wasting events in the Illgraben.(a–c)
Probability density map (unit amplitude) for rock 1 location in the [29–29.5] Hz frequency band. Migration velocities are 0.2(a), 0.5 (b)and 1.0 km s−1
(c).(d) Migration velocity analysis where the maximum amplitude corresponds to the best fit propagation velocity (0.5 km s−1for rock 1).
The best-fit velocity for location of this event is 0.5 km s−1
, which is realistic for the propagation of shear or surface waves at shallow depths. The likely source area of rockfall rock 1 is connected to the uppermost section of the Illgraben channel, about 720 m upstream of station IGB01 (Fig. 6a). After a delay of about 160 s, an increase of seismic energy was observed at station IGB01, suggesting that rock 1 may have triggered flow pulse 3. The delay may reflect the time needed for the rockfall debris to become embedded within a channel flow and for that flow to arrive near IGB01.
During transit of flow pulse 3, a further significant, short duration event was detected at multiple stations (rock 2 at
∼37 min, Fig. 4). This rockfall was located adjacent to
the Illgraben channel, within a 400×750 m area of
uncer-tainty, about 650 m downstream of station IGB01 (Fig. 6a). The best-fit velocity for location of this second avalanche is 0.6 km s−1, which is consistent with the best-fit velocity for
rock 1. This event may have been caused by ground vibra-tions or bank erosion during the passage of the sediment-laden flow pulse, and resulted in an immediate and sustained increase of 5 % dB in the [9–12] Hz seismic energy recorded at station IGB01. We attribute this increase to a sudden addi-tion of sediment to the flow. Thus, our seismic data suggest that an effective, two-way link exists between the Illgraben
channel and the surrounding hillslopes, whereby mass wast-ing durwast-ing rainstorms can cause the constitution of a flow capable of transporting significant amounts of sediment, and this flow in turn can induce further mass wasting during
pas-1
Figure 6.Location of hillslope events.(a)The likely location of
mass wasting events related to pulse 3: rock 1 (red), rock 2 (green) and pulse 2 trigger event rock 0 (blue), all shown on a relief map of the Illgraben catchment. The colour patches indicate areas of equal probability for the event locations that correspond to the up-per 75 % of the dynamic range from the event probability density maps (Fig. 4). Events located upstream stand on large, active gullies connected with the main stream.(b)Locations of rock avalanches
(rocks 1 and 2), shown with the pathway of the flow pulse 3 with which they were associated (red curve). This series of events illus-trates the two-way link between channel and slope domains.
sage (Fig. 6). Independent evidence for the occurrence and location of the seismically detected rockfalls in this sequence does not exist. However, the initiation zone coincides with active slopes in which rock avalanches have been observed previously, including a 3–5×10⁶m3rock avalanche in 1961
(Gabus et al., 2008; Bennett et al., 2013).
1
Figure 7.Location of seismic events during the convective rain-storm of 13 July 2011. The most likely area of initiation (>0.75
of the dynamic range of the probability density function) for each event is represented in red. The station locations are indicated in in-verse triangles. In contrast to rock 1 and rock 2, this slope activity cannot be associated with the initiation or downstream propagation of three flow pulses observed in the main Illgraben channel during the storm.
Instead, erosion of sediment from the headwater channel bed after sufficient runoffhad accumulated may have caused this
pulse. Neither flow pulse 1 nor 2 triggered any obvious sec-ondary mass wasting during passage, but many other high-frequency short duration events were observed at most sta-tions (Fig. 3). To locate these events, we applied the proce-dure also used for events rocks 0–2. In all, we managed to lo-cate 12 further high-frequency short duration events. Within the bounds of uncertainty (>0.75 of the dynamic range of the
probability density function), most of them occurred within the Illgraben catchment (Fig. 7), many in the southeast flank, where intense erosion had been observed in previous years (Bennett et al., 2012). With temporal and frequency charac-teristics of rockfall events and in view of their spatial distri-bution in the Illgraben catchment, we have interpreted these events as rockfalls triggered by rainfall. One such event oc-curred in the immediate vicinity of the debris flow channel, close to the location of event rock 2 (Fig. 6), 38 min after the passage of the last flow pulse. This event may have been a bank collapse, involving colluvium exposed in the chan-nel flank, after the passage of multiple flow pulses. All other detected rockfalls occurred without evident connection with channel processes. This illustrates the complexity of the cou-pling of slope and channel processes and the diversity of mechanisms by which debris flows can arise in the Illgraben.
5 Channel Dynamics
5.1 Flow propagation velocity
Having considered mass wasting in the steep flanks of the Illgraben, we now turn to activity in the central channel of the catchment. The link between pulses of seismic energy recorded at stream-side stations and the flow propagation in the Illgraben channel can be used to infer some character-istics of the channel dynamics. To do this, we tracked the downstream progress and evolution of the three flow pulses with seismic data from stations IGB01, IGB02 and IGB09, located closest to the channel (Fig. 1). The propagation ve-locity of flow pulses in the Illgraben channel was estimated from the envelopes of seismic energy recorded along the main stream. Prior to computing the seismic envelopes, we bandpass filtered the seismic signals of each component (ver-tical, north and east) between 5 and 20 Hz. We then aver-aged the three components of a station, and the passage of a pulse was assumed to coincide with the peak amplitude of the seismic envelopes at a station. Distances along the Ill-graben channel were measured directly from ortho-rectified aerial photographs. For pulses 1 and 2, we fixed the start of propagation to match the pulse arrival at station IGB01. Flow pulse 3 is assumed to have started at the location and time of rockfall rock 1.
Seismically determined flow velocities ranged from 1.0– 4.5 m s−1 and are within the range of measured debris flow
velocities in the channel (0.8–7 m s−1) (Badoux et al., 2009).
The propagation velocity showed some spatial variations with lower values of∼1 m s−1inside the catchment (between
IGB01 and IGB02) than on the debris fan (∼4 m s−1, Fig. 8
and Table S3). This observation may indicate that the effects
of channel roughness dominated over those of channel slope in setting flow velocity. In contrast to this spatial pattern, the temporal variations were limited and the three flow pulses had similar velocity signatures.
5.2 Flow seismic energy
Despite the similarities in flow velocity, the energy level of seismic signals evolved between channel stations and dif-fered between flow pulses (Fig. 8b). To properly compare station observations recorded at different distances from
po-tential sources, in this case the stream, a first-order correction of the seismic energy must be applied, accounting for the ge-ometrical spreading of seismic waves (e.g. Aki and Richards, 1980). We estimated the seismic energy along the main chan-nel by power spectral density analysis and corrected for the travelled distance between a station and the channel as fol-lows. For each station and each flow pulse, we computed the average seismic energy in the [5–20] Hz frequency band and in a±30 s time window around the peak amplitude observed
1
Figure 8.Velocity and energy characteristics of the debris flow se-quence.(a)Downstream propagation of the three main flow pulses.
The propagation is defined with the recordings of seismic envelopes at side-stream stations IGB01, IGB02 and IGB09.(b)Mean seismic
energy of each flow pulse recorded at the same stations. The ampli-tude in decibel is corrected for the geometrical spreading of body waves.
was defined as the standard deviation from the mean seismic energy.
Taking the Illgraben channel as the principal source of en-ergy, we calculated the average distanceRfrom a station to
the nearest 250 m stream segment. We applied this value to correct the seismic energy according to the propagation of body waves (∼1/R2) because the channel stations are
rel-atively close to the potential seismic sources and the trav-elled ray paths can be assumed to be relatively uniform in the near field. The largest distance to the channel was 432 m, at station IGB01. Stations IGB02 and IGB09 had an equal distance to stream of 121 m, making it possible to compare these two stations without correction. A geometrical spread-ing correction that would apply to surface waves would not lead to drastic changes in the observed trends. Naturally, a full correction should also consider the anelastic properties of the medium that account for the frequency dependence of wave attenuation. However, in the absence of an estimate of quality factors and an attenuation law, we did not attempt this correction. For a first order estimate of the energy, the correc-tion for geometrical spreading and uniform anelastic medium
properties has to suffice at present. Hence, we do not
inter-pret the absolute seismic energy, but instead associate the rel-ative changes along the channel to the erosion, transfer and deposition of sediments. For the quantification of these chan-nel processes, a careful analysis of the seismic wave content must be carried out to properly interpret the seismic energy, which is outside the scope of this study.
According to our observations, the seismic energy of all three flow pulses increased by 30–35 % dB between IGB01 and IGB02, inside the Illgraben catchment. In contrast, on the debris fan between IGB02 and IGB09, the energy decreased by 18 % dB for flow pulse 1, and only by 5 % dB for the flow pulses 2 and 3 (Fig. 8b). These variations reflect the evolution of the flows along the channel, perhaps indicating changes in the frictional characteristics of flood flows or an increase of flow discharge due to erosion or decrease in discharge due to deposition, both of which have been documented on the fan of the Illgraben (Schürch et al. 2011; Berger et al., 2011) for debris flows and debris floods.
5.3 Comparison with in situ monitoring
A comparison of the recorded seismic signals of the flow pulses with data from in situ stream monitoring yields further information about the flow properties and their evolution. For this purpose, we used data on flow depth and particle impact rate from check dam 29 (CD29, Fig. 1), located 400 m down-stream of station IGB09. This distance implies a time delay between observations of flow pulses in the seismic data and flow depth and impact rate data. Moreover, a seismic sensor detects approaching flows before they reach the in-channel location nearest the station, giving rise to a progressive in-crease of registered seismic energy. In contrast, passage of a steep-fronted flow is registered as a sudden increase of flow depth at CD29. Acknowledging these differences, we
com-pare the flow characteristics inferred from seismic and in-stream observations.
The spectrograms at near-channel stations showed notable shifts in the frequency content of signals and variations of seismic energy during the sequence of flow pulses (Fig. 3). At station IGB09, flow pulse 1 had relatively little seismic energy below 15 Hz, whereas pulses 2 and 3 had more energy at lower frequencies and greater seismic amplitudes (Fig. 9). In contrast, the flow depth at CD29 was similar for pulses 1 and 2 (Fig. 9c), and it peaked between pulses 2 and 3 when the seismic energy reached a temporary low (between 65 and 70 min, Fig. 9b). In addition, the flow depth of pulse 3 was relatively small, 45 % below the peak value, whereas seis-mic amplitude increased by 130 % for the same period. These comparisons indicate that there is no direct relation between seismic signals and the flow level, and that other flow at-tributes might be involved.
bedload impact rate, 20 times less than flow pulse 2, even though these flows had similar depths and velocities (Figs. 9d and 8a, respectively). Meanwhile, the seismic amplitude in-creased by 215 % at IGB09 from flow pulse 1 to flow pulse 2. Flow pulse 3 had a moderate seismic amplitude and bed-load activity. Thus, the recorded seismic amplitudes are in qualitative agreement with bedload observations rather than with flow depth. However, a clear relation between seismic amplitude and bedload impact rate is difficult to define
be-cause it is likely to be prone to grain size effects on the
fre-quency content of the seismic signal. Moreover, the duration of a flow pulse can influence the seismic energy delivered in the streambed. A sharp, strong seismic peak can have a to-tal energy equivalent to that of a long and smooth seismic pulse. Along the 4.25 km channel reach between IGB01 and IGB09, the three flow pulses had a similar seismic duration of 11 min (±104 s), with limited fluctuations of 5, 16 and
14 % (standard deviation) for pulses 1, 2 and 3, respectively (Fig. S4). Therefore, possible effects of stretching in time of
the flow pulses can be discarded. The video camera located at CD29 recorded the passage of the debris-flow sequence. With a sampling rate of one picture per second, we noticed an elevation of flow level, as indicated by the flow height data set (Fig. 9c), but we could not extract additional information that could help to decipher the bedload fluctuation as shown by the impact rate data set (Fig. 9d).
If bedload transport has a dominant contribution to the seismic energy recorded along the Illgraben main stream, then the frequency pattern of the seismic signal should reflect an addition or loss of large sediment particles in the flow be-cause large sediment particles produce lower frequency sig-nals than small particles (Huang et al., 2007). At IGB09, flow pulse 1 had the lowest amplitude and little seismic energy below 15 Hz. These observations indicate a paucity of coarse bedload in the flow, which agrees with the fact that this flow pulse had low bedload impact rates at CD29 despite its rel-atively large discharge. Notably, pulse 1 underwent a strong reduction of seismic energy (18 % dB) across the fan, where the channel bed gradient decreases from 16 to 10 %, likely reflecting progressive deposition of sediment in the lower channel reach. This may have affected the coarsest sediment
fraction in the first instance, explaining the subdued seismic activity in the channel on the distal part of the fan.
Despite a similar flow depth to flow pulse 1, flow pulse 2 had the highest seismic amplitude, with significant signal at frequencies below 15 Hz at station IGB09. Comparison of the seismic signal envelopes at IGB02 and IGB09 in the de-bris fan confirms the decay of amplitude for flow 1, whereas flow 2 remains the highest peak of the sequence (Fig. S4b– c). We attribute this to a greater sediment concentration and a high transport rate of coarse bedload in flow pulse 2. The increase of seismic energy, indicating higher impact energy, during pulse 2 highlights a higher potential for channel bed abrasion at the base of this denser flow. For pulse 3, the inter-pretation of available data is less straightforward. This pulse
1
Figure 9.Flow pulse characteristics on the distal fan.(a)
Spectro-gram in decibel of the vertical seismic signal at station IGB09 dur-ing passage of flow pulses 1–3.(b)[5–50] Hz vertical seismic
en-velop at IGB09 showing three flow pulses.(c)Raw (black line) and
30 s smoothed (red line) flow depth data recorded at CD29, 400 m downstream of IGB09 (2 min at established flow speed).(d)
Bed-load impact rates recorded at CD29.
had the second highest seismic amplitude of the main flow sequence on this day with a substantial signal below 15 Hz, reflecting a substantial bedload transport rate. However, the pulse had only a limited flow depth and moderate bedload impact rates. Lower than expected impact rates may have resulted from a debris flow with different internal
organiza-tion of the bedload material and/or from the way in which
6 Conclusions
Geomorphic processes generate seismic signals with distinct and different characteristics in the amplitude- and
frequency-time domains, reflecting their mechanisms, granulometry, timing, location and velocity. Recording such signals with a two-dimensional seismological array, we have mapped the spatiotemporal patterns of geomorphic activity in the Swiss Illgraben, a steep mountain catchment with high erosion rates. Our array consisted of stations deployed around the catchment and along the main channel, allowing recognition, location and tracking of rockfalls on slopes as well as flow pulses in the central channel and revealing the links between individual processes. This has been done for a single convec-tive storm.
During this storm on 13 July 2011, three separate flow pulses occurred within the Illgraben main channel, each with a significant sediment load and with the characteristics of a debris flow for at least part of the surveyed channel length. These pulses did not have common starting conditions, ei-ther in terms of precipitation, or in terms of the trigger mech-anism. The first flow pulse started without detected precur-sor activity on catchment hillslopes, instead mobilizing sed-iment already present in the channel. In contrast, the other two pulses were triggered by rockfalls in the steep head-water slopes. Within the Illgraben catchment, we noticed a systematic energy increase along the bedrock channel, pre-sumably in response to the entrainment of channel bed mate-rial (pulse 1) and/or hillslope inputs (pulses 2 and 3). During
pulse 3, passage of the flow appeared to trigger a secondary mass wasting event on an adjacent hillslope. On the debris fan, pulse 1 underwent a decrease of seismic energy, whereas pulses 2 and 3 maintained their high level of energy. These trends may reflect changes in the sediment load of the prop-agating flows. The seismic records and independently mea-sured particle impact rates suggest that pulse 1 had a dimin-ished coarse sediment load, possibly causing change from a debris flow into a hyper-concentrated flow on the lower part of the debris fan. Pulses 2 and 3 maintained their energy and thus their character across the fan. Thus, our seismic observa-tions suggest that within the time span of a single convective rainstorm, dynamic links exist between a channel and the ad-jacent hillslopes that can determine the onset and evolution of bedload transport in mountain catchments, and that sedi-ment erosion and deposition during downstream propagation of these flows affect their density and rheology, and likely
also their potential for erosion by particle impacts.
By recording frequency-specific amplitude information, seismic instruments register at distance many aspects of flow processes that can be confirmed with in situ observations from force plates. For many hillslope processes, such as rock-falls, quantitative in situ observation is disproportionately more difficult, and seismic records may provide insights into
their mechanisms that are hard to obtain in other ways. More-over, this seismological approach is effective on the
land-scape scale. The ensemble of seismic observations, made on individual, naturally occurring geomorphic process events that are tracked from inception to near termination, can reveal the ways in which separate landscape elements interact un-der specific meteorological conditions and how geomorphic events are constituted by multiple surface process manifesta-tions with causal links. Thus, seismology, pursued with two-dimensional instrument networks, makes it possible for the first time to monitor distributed surface process activity with sufficient spatial as well as temporal resolution to observe
and constrain the dynamics of erosional landscapes.
With telemetry and automated analysis of seismic data, this approach may give significant early warning capabilities in settings where natural hazard monitoring is now limited to localized downstream observations. Finally, combined seis-mological and meteorological monitoring of upland catch-ments over multiple annual cycles stands to yield funda-mental, quantitative constraints on the role of weather as a driver of erosion and insights into the role of climate and cli-mate change in landscape evolution. Such long-term surveys should include independent constrains on slope activity, like laser scanning, to verify locations of erosion and deposition and to calibrate the conversion from measured seismic en-ergy to mass of rock or sediment displaced. This conversion is essential to achieving the goal of knowing the timing and location of geomorphic events in a landscape and how much material is involved.
Supplementary material related to this article is available online at http://www.earth-surf-dynam.net/2/ 21/2014/esurf-2-21-2014-supplement.pdf.
Acknowledgements. This study was supported by the AXA
Research Fund and the Isaac Newton Trust of the University of Cambridge. We thank the SEIS-UK equipment pool (NERC) and the École et Observatoire des Sciences de la Terre of Strasbourg for providing the seismic instruments, the WSL for logistic support and M. Raymond Pralong, K. Steiner, N. Federspiel, T. Glassey and F. Dufour for help in the field. Thanks are also due to A. Helm-stetter, M. Attal, L. Hsu and the associate editor J. Braun for their comments and suggestions, which have improved the clarity of the paper.
The service charges for this open access publication have been covered by a Research Centre of the Helmholtz Association.
Edited by: J. Braun
References
Arattano, M. and Marchi, L.: Systems and sensors for debris-flow monitoring and warning, Sensors, 8, 2436–2452, doi:10.3390s8042436, 2008.
Attal, M. and Lavé, J.: Changes of bedload characteristics along the Marsyandi River (central Nepal): Implications for understand-ing hillslope sediment supply, sediment load evolution along flu-vial networks, and denudation in active orogenic belts, edited by: Willett, S. D., Hovius, N., Brandon, M. T., and Fisher, D., Spec. Pap. Geol. Soc. Am., 398, 143–171, 2006.
Attal, M., Tucker, G. E., Whittaker, A. C., Cowie, P. A., and Roberts, G. P.: Modeling fluvial incision and transient landscape evolution: Influence of dynamic channel adjustment, J. Geophys. Res., 113, F03013, doi:10.1029/2007JF000893, 2008.
Badoux, A., Graf, C., Rhyner, J., Kuntner, R., and McArdell, B. W.: A debris-flow alarm system for the Alpine Illgraben catchment: design and performance, Nat. Hazards, 49, 517–539, 2009. Bennett, G. L., Molnar, P., Eisenbeiss, H., and McArdell, B. W.:
Erosional power in the Swiss Alps: characterization of slope fail-ure in the Illgraben, Earth Surf. Process. Landforms, 37, 1627– 1640, doi:10.1002/esp.3263, 2012.
Bennett, G. L., Molnar, P., McArdell, B. W., Schlunegger, F., and Burlando, P.: Patterns and controls of sediment production, trans-fer and yield in the Illgraben, Geomorphology 188, 68–82, 2013. Berger, C., McArdell, B. W., and Schlunegger, F.: Direct measure-ment of channel erosion by debris flows, Illgraben, Switzerland, J. Geophys. Res., 116, F01002, doi:10.1029/2010JF001722, 2011.
Brodsky, E. E., Kanamori, H., and Sturtevant, B.: A seismically con-strained mass discharge rate for the initiation of the May 18, 1980 Mount St. Helens eruption, J. Geophys. Res., 104, 29, 387–29, 1999.
Burbank, D. W., Leland, J., Fielding, E., Anderson, R. S., Brozovic, N., Reid, M. R., and Duncan, C.: Bedrock incision, rock uplift and threshold hillslopes in the northwestern Himalayas, Nature, 379, 505–510, 1996.
Burtin, A., Bollinger, L., Vergne, J., Cattin, R., and Nábˇelek, J. L.: Spectral analysis of seismic noise induced by rivers: A new tool to monitor spatiotemporal changes in stream hydrodynamics, J. Geophys. Res., 113, B05301, doi:10.1029/2007JB005034, 2008.
Burtin, A., Bollinger, L., Cattin, R., Vergne, J., and Nábˇelek, J. L.: Spatiotemporal sequence of Himalayan debris flow from analysis of high-frequency seismic noise, J. Geophys. Res., 114, F04009, doi:10.1029/2008JF001198, 2009.
Burtin, A., Vergne, J., Rivera, L., and Dubernet, P.-P.: Location of river induced seismic signal from noise correlation functions, Geophys. J. Int., 182, 1161–1173, 2010.
Burtin, A., Cattin, R., Bollinger, L., Vergne, J., Steer, P., Robert, A., Findling, N., and Tiberi, C.: Towards the hydrologic and bed load monitoring from high-frequency seismic noise in a braided river: the “torrent de St Pierre”, French Alps, J. Hydrol., 408, 43–53, 2011.
Burtin, A., Hovius, N., Milodowski, D. T., Chen, Y.-G., Wu, Y.-M., Lin, C.-W., Chen, H., Emberson, R., and Leu, P.-L.: Continu-ous catchment-scale monitoring of geomorphic processes with a 2-D seismological array, J. Geophys. Res., 118, 1956–1974, doi:10.1002/jgrf.20137, 2013.
Cook, K. L., Turowski, J. M., and Hovius, N.: A demonstration of the importance of bedload transport for fluvial bedrock erosion
and knickpoint propagation, Earth Surf. Process. Landforms, 38, 683–695, doi:10.1002/esp.3313, 2013.
Dammeier, F., Moore, J. R., Haslinger, F., and Loew, S.: Characterization of alpine rockslides using statistical anal-ysis of seismic signals, J. Geophys. Res., 116, F04024, doi:10.1029/2011JF002037, 2011.
Deparis, J., Jongmans, D., Cotton, F., Baillet, L., Thouvenot, F., and Hantz, D.: Analysis of rock-fall and rock-fall avalanche seismo-grams in the French Alps, Bull. Seismol. Soc. Am., 98, 1781– 1796, 2008.
Densmore, A. L., Anderson, R. S., McAdoo, B. G., and Ellis, M. A.: Hillslope evolution by bedrock landslides, Science, 275, 369– 372, 1997.
Favreau, P., Mangeney, A., Lucas, A., Crosta, G., and Bouchut, F.: Numerical modeling of landquakes, Geophys. Res. Lett., 37, L15305, doi:10.1029/2010GL043512, 2010.
Gabus J. H., Weidmann, M., Bugnon P.-C., Burri, M., Sartori, M., and Marthaler, M.: Geological Map of Sierre 1:25 000 (LK 1278, sheet 111), In Geological Atlas of Switzerland. Swiss Geological Survey: Wabern, Switzerland, 2008,
Govi, M., Maraga, F., and Moia, F.: Seismic detectors for continu-ous bed load monitoring in a gravel stream, Hydrol. Sci. J., 38, 123–132, 1993.
Hartshorn, K., Hovius, N., Dade, W. B., and Slingerland, R. L.: Climate-driven bedrock incision in an active mountain belt, Sci-ence 297, 2036–2038, doi:10.1126 sciSci-ence.1075078, 2002. Helmstetter, A. and Garambois, S.: Seismic monitoring of
Séchili-enne rockslide (French Alps): analysis of seismic signals and their correlation with rainfalls, J. Geophys. Res., 115, F03016, doi:10.1029/2009JF001532, 2010.
Hervas, J, Barredo, J. I., Rosin, P. L., Pasuto, A., Mantovani, F., and Silvano, S.: Monitoring landslides from optical remotely sensed imagery: the case history of Tessina landslide, Italy, Geomor-phology, 54, 63–75, 2003.
Hovius, N., Stark, C. P., Chu, H.-T., and Lin, J.-C.: Supply and Re-moval of Sediment in a Landslide-Dominated Mountain Belt: Central Range, Taiwan, The Journal of Geology, 118, 73–89, doi:10.1086/314387, 2000.
Hsu, L., Finnegan, N. J., and Brodsky, E. E.: A seismic signature of river bedload transport during storm events, Geophys. Res. Lett., 38, L13407, doi:10.1029/2011GL047759, 2011.
Huang, C.-J., Yin, H.-Y., Chen, C.-Y., Yeh, C.-H., and Wang, C.-L.: Ground vibrations produced by rock motions and debris flows, J. Geophys. Res., 112, F02014, doi:10.1029/2005JF000437, 2007. Itakura, Y., Inaba, H., and Sawada, T.: A debris-flow monitoring devices and methods bibliography, Nat. Hazards Earth Syst. Sci., 5, 971–977, 2005.
Korup, O., Densmore, A. L., and Schlunegger, F.: The role of land-slides in mountain range evolution, Geomorphology, 120, 77–90, 2010.
Lacroix, P. and Helmstetter, A.: Location of seismic signals asso-ciated with microearthquakes and rockfalls on the Séchilienne landslide, French Alps, Bull. Seismol. Soc. Am., 101, 341–353, 2011.
Lin, C.-W., Shieh, C.-L., Yuan, B.-D., Shieh, Y.-C., Liu, S.-H., and Lee, S. Y.: Impact of Chi-Chi earthquake on the occurrence of landslides and debris flows: example from the Chenyulan River watershed, Nantou, Taiwan, Engineering Geology, 71, 49–61, 2004.
McArdell, B. W., Bartelt, P., and Kowalski, J.: Field observations of basal forces and fluid pore pressure in a debris flow, Geophys. Res. Lett., 34, L07406, doi:10.1029/2006GL029183, 2007.
McNamara, D. E. and R. P. Buland: Ambient noise levels in the continental United States, Bull. Seismol. Soc. Am., 94, 1517– 1527, 2004.
Page, M. J., Trustrum, N. A., and DeRose, R. C.: A high-resolution record of storm-induced erosion from lake sediments, New Zealand, J. Paleolimnol,, 11, 333–348, 1994.
Saba, S. B., van der Meijde, M., and van der Werff, H.:
Spatiotem-poral landslide detection for the 2005 Kashmir earthquake re-gion, Geomorphology, 124, 17–25, 2010.
Schlunegger F., Badoux A., McArdell B. W., Gwerder C., Schny-drig D., Rieke-Zapp D., and Molnar P.: Limits of sediment trans-fer in an alpine debris-flow catchment, Illgraben, Switzerland, Quat. Sci. Rev., 28, 1097–1105, 2009.
Schlunegger, F., Norton, K., and Caduff, R.: Hillslope processes in
temperate environments, in: Treatise in Geomorphology 3, edited by: Marston, R. and Stoffel, M., Mountain and Hillslope
Geo-morphology, Elsevier, London, 2012.
Schürch, P., Densmore, A. L., Rosser, N. J., and McArdell, B. W.: Dynamic controls on erosion and deposition on debris-flow fan, Geology, 39, 827–830, 2011.
Sklar, L. and Dietrich, W. E.: Sediment and rock strength controls on river incision into bedrock, Geology, 29, 1087–1090, 2001.
Snyder, N. P., Whipple, K. X., Tucker, G. E., and Merritts, D. J.: Landscape response to tectonic forcing: Digital elevation model analysis of stream profiles in the Mendocino triple junction re-gion, northern California, Geol. Soc. Am. Bull., 112, 1250–1263, 2000.
Stark, C. P., Barbour, J. R., Hayakawa, Y. S., Hattanji, T., Hovius, N., Chen, H., Lin, C.-W., Horng, M.-J., Xu, K.-Q., and Fuka-hata, Y.: The climatic signature of incised river meanders, Sci-ence, 327, 1497–1501, 2010.
Thomson, D. J.: Spectrum estimation and harmonic analysis, Proc. IEEE, 70, 1055–1096, 1982.
Turowski, J. M., Lague, D., and Hovius, N.: Cover effect in bedrock abrasion: a new derivation and its implications for the modeling of bedrock channel morphology, J. Geophys. Res., 112, F04006, doi:10.1029/2006JF000697, 2007.
Whipple, K. X.: Bedrock Rivers and the Geomorphology of Active Orogens, Ann. Rev. Earth Planet. Sci., 32, 151–185, 2004. Wobus, C. W., Tucker, G. E., and Anderson, R. S.: Does climate
change create distinctive patterns of landscape incision?, J. Geo-phys. Res., 115, F04008, doi:10.1029/2009JF001562, 2010.
Yanites, B. J., Tucker, G. E., Hsu, H.-L., Chen, C., Chen, Y.-G., and Mueller, K. J.: The influence of sediment cover vari-ability on long-term river incision rates: An example from the Peikang River, central Taiwan, J. Geophys. Res., 116, F03016, doi:10.1029/2010JF001933, 2011.