ISSN 1517-7076 artigo e-11907, 2017
Corresponding Author : Mauro Eduardo Benedet Received on: 14/12/2016 Accepted on: 11/04/2017
10.1590/S1517-707620170002.0241
The use of Shearography technique to evaluate
polymeric composite repairs
–
case study
Mauro Eduardo Benedet 1, Analucia Vieira Fantin 1, Daniel Pedro Willemann1,
Armando Albertazzi Gonçalves Júnior 1, Claudio Ramos Schmitz 1, Ana Lúcia Fampa Seabra d'Almeida 2, Sérgio Damasceno Soares 2, Luiz Daniel Montenegro Lana 2, Valber Azevedo Perrut 2
1 Universidade Federal de Santa Catarina – UFSC, Departamento de Engenharia Mecânica, Florianópolis, SC, Brazil
e-mail: [email protected] 2
CENPES – Petrobras, Rio de Janeiro, RJ, Brazil. e-mail: [email protected]
ABSTRACT
Pipelines are subject to a variety of defects such as wall thickness loss, grooves, dents and holes. To restore the pipe integrity, polymeric composite repairs can be used. The inspection of repaired pipes is of fundamental importance, not only to verify the initial integrity, but also to monitor their state over time. Shearography is a laser optical strain measurement technique which compares a strain image in unstressed and stressed conditions to reveal the presence of defects and provides useful information about the interface between the repair and substrate, identifying delamination, interfacial disbond and holes. In this work, two pipes repaired with composites from two different providers were submitted to shearography inspection in order to analyze the repair system integrity. The inspections were performed to verify the presence or absence of detachments between the composite repair and subtracts and/or between the layers of the repair itself. After the procedure, the repairs were removed to compare and confirm the inspection results. Repair A presented some difficulty to be removed, what is in accordance with shearography results that exhibited the presence of only some superficial defects. The pipe surface aspect after composite removal was good, without any type of corrosion. On the other hand, the shearography inspection of repair B indicated lack of adhesion between the steel pipe and the composite repair. The repair removal was very easy, corroborating the inspection results. Also, it was observed that the pipe surface presented metal oxides. Through these inspections it could be noted an excellent correlation between shearography inspection results and the degree of difficulty to remove the repairs. The results from an inspection in an offshore platform are also presented. This inspection showed that shearography is an efficient method to inspect steel pipes repaired with composite materials in field.
Keywords: Shearography, polymeric composite repair, pipeline.
1. INTRODUCTION
Pipelines are subject to a variety of defects such as wall thickness loss, grooves, dents and holes. In order to restore the pipe integrity, polymeric composite repairs can be used. These repairs have been utilized within the high pressure oil and gas transmission pipeline industry for reinforcement of sections of the pipe wall which have been weakened due to the above cited defects [1].
The inspection of the repaired pipes is of fundamental importance, not only to verify the initial integrity, but also to monitor their state over time. Standard BS ISO 24817:2015 [2] recommends that, for repair class 3 (repair covering all fluids types and pressures up to the qualified pressure limit) a baseline inspection is completed after installation of the repair because it is much simpler to identify changes than to interpret the information gained by subsequent inspections.
The shearography is a special case of digital speckle pattern interferometry technique, in which the interfering wavefronts coming from the sample (both speckled) are reference and object at the same time. Since it is a common-path interferometric technique [8-9], shearography has the advantages of allowing short coherence-length illumination and being less sensitive to environmental disturbances, such as low vibration levels, than other holographic techniques [10].
The shearography system was built as a portable unit and it is able for scanning large structures, such pipes to tank wall and ship hulls. Shearography images show changes in surface slope in response to a surface modification generated by an applied load. This technique is sensitive to subsurface disbonds, delaminations, core damage, and core splice joint separations, as well as surface damage [11].
The changes in the applied load required to reveal subsurface anomalies frequently induce significant deformation for this optical technique. Shearography mainly detects the derivative of the displacement and usually tends to show only the local deformation on the target surface that is due to the presence of a surface or subsurface flaw.
As shown in Fig. 1, a traditional shearography setup requires some basic elements: an illumination module, an interferometer and software that drives the image acquisition procedure. In addition, an excitation module is required to apply the load required to reveal the subsurface anomalies. This excitation may be performed by different methods. Usually it uses a thermal or pressure variation to apply the load. A variation about 4°C or 1 bar is usually sufficient. The surface under investigation is illuminated by an expanded laser beam, which generates speckle patterns on the surface [12]. Within the sensor head, a modified Michelson interferometer [10] is designed to form the laterally sheared image of the surface.
Figure 1: Shearographic inspection setup.
More detailed descriptions about shearography setups as well as measurement principles can be found in [10,12].
Large rigid body motion needs to be avoided to keep good correlation between images. For that, it is important to keep illumination and acquisition modules rigidly clamped together to the sample surface.
In this work, two pipes were repaired with composite materials from two different manufacturers and were submitted to shearography inspection in order to analyze the repair system integrity. The inspections were performed in order to verify the presence or absence of detachment between the composite repair and the substrate and/or between the layers of the repair itself. After the inspection procedure, the repairs were removed to be compared and to confirm the inspection results.
2. MATERIALS AND METHODS
Shearography inspections were performed during the operation of two gas pipelines repairs in two different regions of Southern Brazil and in an offshore platform. All inspections were carried out by specialized technicians of Federal University of Santa Catarina (UFSC) and supervised by CENPES/PETROBRAS employees. The gas pipeline repairs were applied by two different suppliers and were entitled Repair A and Repair B in this work. All inspections were performed using thermal loading as excitation mode, through a 500 W halogen lamp (Figure 2).
Figure 2: Halogen lamp used for thermal loading.
2.1 Shearography inspection of Repair A
Repair A is a glass fiber composite repair which was laminated in an 18” tube of the trunkline of a gas pipeline. This repair had 22 layers with thickness ranging between 15 and 20 mm and had been in service for over six years. This repair was applied to restore structural integrity of a dented region of the pipeline. For this inspection, only five areas of about 220 mm x 140 mm were evaluated by shearography (areas 1 and 2 at the top of the repair, area 3 at its edge and areas 4 and 5 near to dented region). These areas are highlighted in Figure 3. The surface of the repair was cleaned and painted with matt white paint before the inspections.
Figure 3: Regions measured with shearography system.
2.2 Shearography inspection of Repair B
Figure 4: Regions measured by the shearography system.
2.3 Shearography inspection performed in an offshore platform
Shearography tests were also carried out in an offshore platform with the objective of analyzing how difficult is to perform shearography inspections in a harsh environment. Seven repairs of three different suppliers were inspected in order to determine the influence of different vibration levels in the quality of shearography images. Two repairs were 100% inspected and five were inspected by sampling. The shearography equipment is portable and can be easily taken to the field. Inspections were realized with the tripod showed in Figure 5 and with a collar system presented in Figure 6.
Figure 5: Shearography inspection at a composite repair in an offshore platform. The carbon fiber tripod can be
Figure 6: Shearography inspection of a composite repair in an offshore platform. The collar system was used to clamp the shearography device to the repair.
3. RESULTS AND DISCUSSION
The shearography inspections results are showed below.
3.1 Shearography inspection of Repair A
The shearography inspections were organized to verify the presence or absence of debonding between composite repair and steel pipe and/or between the layers of the repair itself. Figure 7 presents the inspection results from area 2.
Figure 7: Shearography results from area 2. Green arrows show the directions of the lateral displacements used in the
inspection device.
Figure 7 shows that, in both longitudinal and transversal directions, no significant defects were observed in the analyzed area of the Repair A since interference fringes are not present. It should be noted that due to the limited time to perform the inspection, a sample of five areas was carried out. The composite repair thickness varied between 15 and 20 mm depending on the analyzed position. However, most analyzed areas of the Repair A presented this same image aspect with no anomalies indicating the presence of subsurface flaws. After shearography inspection, the repair was removed by the maintenance team. The time
L
ongi
tudi
na
l
spent to remove the Repair A from the pipeline was about 120 minutes. After the removal it was clearly seen that there was no debondings between the repair and the pipeline. That is why a higher degree of difficulty to remove Repair A was faced in comparison to the removal time of Repair B.
3.2 Shearography inspection of Repair B
Figure 8 shows the inspection results from area 7 of Repair B and the measuring head positioned to inspection. Green arrows show the directions of lateral displacements used. As in Repair A, the vertical arrow signalizes the sense of lateral displacement in the pipe longitudinal direction. It can be clearly noted that the images caught from Repair B present several anomalies (interference fringes) in comparison to those acquired from Repair A. The defects found corresponded to more than 50% of the total area of the inspected regions, with defects up to (180 x 40) mm. For a defective area above 25% of the total area of the repair, it is recommended to replace the repair.
All areas inspected at Repair B presented several points of localized lack of adhesion between interface of composite repair and steel pipe. Since only ten points were inspected, it was not found sufficient evidence of widespread debonding. However, the repair removal was easily performed after the shearography inspection. The time to remove Repair B from the pipeline was about 16 minutes and this reduced time corroborates the inspection results. Also, it was observed that the pipe surface presented general corrosion. Compared with Repair A, Repair B removal was very easy due to the lower adhesion between composite repair and steel pipe.
Figure 8: Shearography inspection results from area 7. These results represent also the other inspected areas. Green
arrows show the directions (longitudinal and transversal) of the lateral displacements used during the shearography in-spection.
3.3 Shearography inspection in an offshore platform
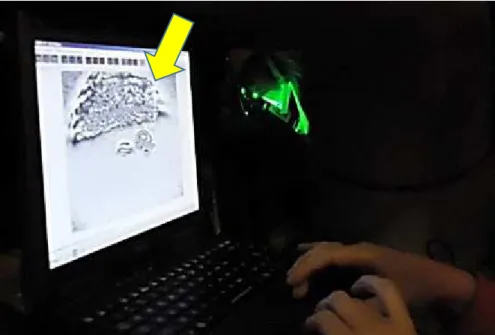
Figure 9 presents the visualization of a defective region detected during an inspection performed at night. The defect presented in Figure 9 has about (210 x 80) mm.
Figure 9: Shearography system control and data processing: visualization of a flawed region (arrow) in a composite repair.
Table 1: Vibration levels at the inspected lines and the quality of images obtained with shearography.
REPAIR DISPLACEMENT
(mm)
VELOCITY (mm/s)
ACCELERATION (m/s2)
SHEAROGRAPHY IMAGES QUALITY
1 0.019 0.5 0.1 OK
2* 0.021 0.6 0.1 OK
2* 0.040 0.9 0.2 Not measured
3 0.017 0.4 0.1 OK
4 0.009 0.4 0.1 OK
5 0.138 5.2 43.3 Not measured**
6 0.018 0.8 2.1 Low quality
7 0.041 1.4 0.4 Low quality
*The two vibration levels were obtained in the same repair at different times.
**In addition to the high levels of vibration, there was moisture freezing on the surface of pipe.
It was observed that the tripod allows a greater viewing area, but it is indicated in cases of extremely low vibrations. On the other hand, the collar clamping system allows the inspection of repairs localized in a reduced space between pipes and/or with higher vibration levels, but it has a smaller viewing area. Table 2 shows the maximum vibration levels for a specific shearography sensor attached to the collar clamping during the inspections in the offshore platform. New optomechanical designs are been experimented in order to withstand higher levels of vibrations.
Table 2: Maximum vibration levels that permitted platform inspection.
PARAMETER VALUE
Displacement (mm) 0.021
Velocity (mm/s) 0.6
Acceleration (m/s2) 0.1
4. CONCLUSIONS
Shearography is an efficient interferometric method to inspect steel pipes repaired with composite materials in field. Based on optical principles of strain measurement, this technique allows observing, in a nondestructive way, the presence of internal flaws in composite material repairs applied to steel pipelines. Lack of adhesion between the metallic substrate and composite repair, delamination and the presence of holes are examples of typical internal defects in these structures.
degree of difficulty faced to remove the repairs and the pipe surface aspects after the repair removal.
The identification and quantification of the inspection conditions/restrictions during boarding in an offshore platform have been carried out. The boarding purpose has been fully achieved. Vibrations, lack of space in certain inspections sites, and the time available to accomplish the inspections are the greatest restrictions on the application of the technique in field. The inspections performed in the offshore platform were able to achieve good results up to the following vibration limits: displacement of 0.021 mm; velocity of 0.6 mm/s; and acceleration of 0.1 m/s². However, improvements in the optomechanical components and in the software for image processing are being developed in order to apply the shearography in environments even more severe [13].
Although the main objective in this work is the detection of the defective region in a qualitative way and the evaluation of the influence of the vibration on the quality of the inspections, the quantification of the defects is also one of the points studied by the team. Some results were obtained in one of these studies [7], however they apply to only one particular type of defect and one type of repair. A more in-depth and detailed study is in process.
5. ACKNOWLEDGMENTS
The authors would like to express thanks to Petrobras and CNPq - National Council for Scientific and Technological Development for the financial support for the development of this research.
6. BIBLIOGRAPHY
[1] MURAD, M.A. Structural Health Monitoring in Pipeline Repair – An Integrated Structural Health Monitoring Approach to Composite-Based Pipeline Repair, Scholar’s Press., Germany, 2014.
[2] ISO. BS ISO 24817: 2015- Petroleum, petrochemical and natural gas industries-Composite repairs for pipework - Qualification and design, installation, testing and inspection-BSI Standards Publication, 2015. [3] STREINCHEN, W., YANG, L. Digital Shearography: Theory and Application of Digital Speckle Pattern Shearing Interferometry, Washington, SPIE Press, 2003
[4] KARBHARI, V. M. Non-destructive evaluation (NDE) of polymer matrix composites – Techniques and Applications, WP Woodhead Publishing, Cambridge, UK, 2013.
[5] WORKMAN, G. L., MOORE, P. O. Nondestructive Testing Handbook – v. 10, Nondestructive Testing Overview, ASNT, USA, 2012.
[6] PAES, A. S., WILLEMANN, D. P., FANTIN, A. L., et al., Estimativa do Tamanho de Defeitos em Tubos de Aço Perfurados e Revestidos com Material Compósito Utilizando Shearografia, Proceedings of 32th Congresso Brasileiro de Ensaios Não Destrutivos e Inspeção - CONAEND&IEV 2014-036, São Paulo-SP, pp. 248-259, 2014.A.S.
[7] PAES, A. S. Proposta de Procedimento para Estimativa do Tamanho de Defeitos em Tubos de Aço Perfurados e Revestidos com Materiais Compósitos Utilizando Shearografia, Dissertation M.Sc, Federal University of Santa Catarina, 2013.
[8] BUTTERS, J. N., LEENDERTZ, J. A. A double exposure technique for speckle pattern interferometry. J. Phys. E 4, pp. 277 279 , 1971.
[9] MALACARA, D. Optical Shop Testing. 3rd ed. Wiley, 2007.
[10] RASTOGI, P. K. Optical Measurement Techniques and Applications. Artech House, 1997. [11] MALLICK, P. K. Composites Engineering Handbook. University of Michigan, 1997.