*Corresponding author, Email Address: [email protected] (M. Noaparast)
A Methodology to Estimate Ores Work Index Values, Using Miduk Copper
Mine Sample
M. Noaparast1*, S. Rahmati1, G. Jozanikohan1, S. Aslani1and A. Ghorbani1
1School of Mining Engineering, University College of Engineering, University of Tehran,
Received 12 April 2012; Received in revised form 21 November 2012; accepted 29 November 2012
Abstract
It is always attempted to reduce the costs of comminution in mineral processing plants. One of the difficulties in size reduction section is not to be designed properly. The key factor to design size reduction units such as crushers and grinding mills, is ore’s work index. The work index, wi, presents the ore
grindability, and is used in Bond formula to calculate the required energy. Bond has defined a specific relationship between some parameters which is applied to calculate wi, which are control screen, fine
particles produced, feed and product d80.
In this research work, a high grade copper sample from Miduk copper concentrator was prepared, and its work index values were experimentally estimated, using different control screens, 600, 425, 212, 150, 106 and 75 microns. The obtained results from the tests showed two different behaviors in fine production. According to these two trends the required models were then defined to present the fine mass calculation using control screen. In next step, an equation was presented in order to calculate Miduk copper ore work index for any size. In addition to verify the model creditability, a test using 300 microns control screen was performed and its result was compared with calculated ones using defined model, which showed a good fit. Finally the experimental and calculated values were compared and their relative error was equal to 4.11% which is an indication of good fit for the results.
Keywords:Modeling, Work Index, Miduk Copper, Control Screen, Bond Ball Mill
1- Introduction
To meet the increasing metal demands of various industries, the efforts to explore and extract the various ores has been extended. Mineral processing plants have the task to produce economic concentrates, and one of its major sections is ore grinding and comminution. The size
reduction section in any mineral
processing plant consumes the most amount of energy, so it is always to work in optimized condition to avoid consuming useless energy for material breakage and/or to avoid producing more fine/slime particles which are not suitable for further process.
One of the difficulties in size reduction section, crushing and grinding, is not to be designed properly. The key factor to design size reduction equipments such as
crushers and grinding mills, is ore’s work
index which is experimentally calculated.
The work index, wi, is a parameter which
presents the ore grindability and is used in Bond formula. The required energy to break and reduced ores size is calculated by "Bond law" which is presented as
equation 1[1]. In equation 1, W is the minimum required energy in kwh/st and F
and P are d80 of feed and product in
microns. The wi is called "work index" in
kwh/st, and is a measure of ore
grindability which is experimentally
determined.
) 1 1 ( 10
F P w
W i
(1)
Work index presents the material
grindability, and higher work index means more required energy to break the material/ore. Different standard methods
and procedures were defined and
published, to measure/estimate ores work index, in which particular equipments are used[1, 2]. These methods are such as Bond Rod Mill work index, Bond Ball Mill work index, Bond low-energy impact crushing work index[2]. One of the most common methods applied for ores is standard Bond Ball Mill method[1]. This
Bond Ball Mill is 12×12 inches
different ball sizes. The procedure of test is explained by Bond, and work index is experimentally estimated by applying equation 2 to the test results. Different test parameters are measured and presented as follows[1]. In equation 2, Gi is fine mass
produced per revolution of mill (g/rev.), Pi
is control screen size (µm), and F, P are sizes of feed and product in which 80% of their particles are finer (µm).
1 82 . 0 23 . 0 ) 10 10 ( ) )( ( 5 . 44 F P G P w i i
i
(2)
It is considered that in equation 2, the
work index depends on Pi which was
defined as size of control screen and/or which describes the fine mass production. It is achieved that the change of grind limit
and/or fine mass size (Pi) would
accordingly change the amount of work index. In addition, it should be noted when
Pi is changed, the other parameters such as
Gi and P are also varied. The usual grind
limit in work index experiments is
100-150 micron as control screen size (Pi)[1]. It
comes from the last grinding step, Ball Mill product size in different mineral processing plants. However, when coarser grinding product (coarser than 100-150 microns) is concerned, the work index of material is accordingly changed, and
therefore the breakage energy
consumption is accordingly differed, as well.
It is in interest to model and define work index parameters with ores characteristics and ball mill performance, and some works were previously conducted to correlate of ball mill grindability as a measure of its performance [3, 4 and 5]. For example the ore friability which stems from ores' characteristics and properties could effectively change the work index values of ores[6].
In this regards, some research works were performed[7, 8, 9 and 10]. The results of these works showed that material work index is a key parameter describing its grindability, is not constant and depends
on the size of grinding product[7]. Therefore it could practically be expected some difficulties and errors to estimating the required energy according to Bond formula (equation 1). Because when grinding product is varied from one size to
finer and/or coarser size, therefore wi is
then changed. The experimental works have been done using various ores such as copper, andesite, limestone, lead & zinc, and dolomite[7, 8 and 9].
These works attempted to explain
mathematically, the tendency of different parameters which are effective in material work index. They concluded the linear relationship between (Pi)0.5 with Gi and P
with Pi as well.
As a very preliminary question, it has been worked on the modeling of these parameters, to avoid any discrepancies
occurring within the wi experiments. In
fact in this work, it is attempted to explain
physically and mathematically the
behavior and trend of work index (wi)
values, fine mass production (Gi), control
screen size (Pi) and product d80 size (P). As it was mentioned the aim of this research is to present the relationship of work index with its effective parameters for a specific ore.
In fact it is aimed to model these parameters to simplify the bond work index equation. However the main question is to know the work index is changed with changing the ore's size, which means how ore's grindability would vary with its size. This research conclusion could perhaps decrease the risk of ore breakage energy calculation.
However to understand the trends of variation of parameters which are effective in work index estimation, a high grade copper ore sample from Miduk Copper Mine was used. Miduk is one the most
significant copper ore mines and
2- Experimental Works 2-1- Sample Preparation
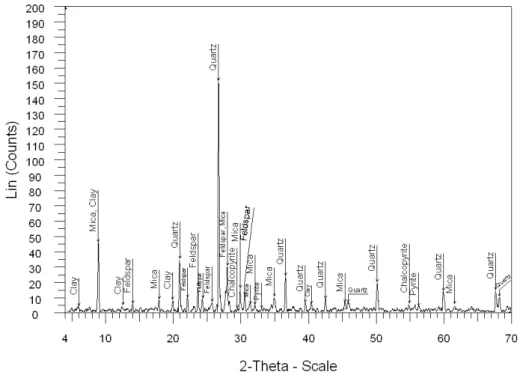
To perform the target of this work a sample was prepared from Miduk Copper Mine. This mine is one the most significant copper mines in Iran which located in Kerman Province. The prepared sample was initially analyzed using Atomic Absorption and its Cu content was equal to 2.47%. It showed that used sample was a high grade copper sample, so in order to find out its constitutive minerals, the XRD tests were then
performed to distinguish the sample main minerals and its clay minerals as well. The X-Ray diffraction data were collected using a Bruker D8-Advance with a copper tube (40 kv, 30 mA). Diffraction patterns were collected in the angular range 4-70
2, with a 0.02 step size and counting 1
second per step. The XRD results indicated that the main minerals in sample were: quartz, feldspar, mica, clay minerals (illite, kaolinite, chlorite, montmorilonite), chalcopyrite and pyrite (Figure 1).
Figure 1: The X-Ray diffraction pattern of sample.
In order to run the work index tests, prepared sample was first crushed and ground down to 100% finer than 2380 microns which was defined in Bond standard method[1]. It was then size analyzed using screen analysis test which
showed that d80 of sample was 1476
microns. In addition, as ore’s bulk density
is necessary to be used for work index estimation, so it was measured for the prepared sample which was equal to
1.41g/cm3.
2-2- Test Works
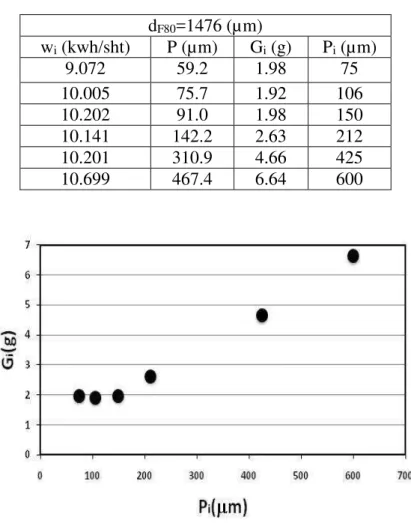
In order to study on the variation of work index with control screen changes, the prepared sample was used in different 6 experiments. These experiments were carried out in Bond Ball mill and based on the Bond standard procedure[1]. The only change in these tests was the control screen which was 600, 425, 212, 150, 106 and 75 microns. It means that each test was performed with one of the introduced screens as grinding product size control to measure produced fine mass. According to
the obtained results from these
was estimated using equation 2. Table 1 presents the tests results for different effective parameters. It is observed that the work index is differed from minimum 9.072kwh/st for screen 75 microns to maximum 10.699kwh/st for 600 micron
control screen (Pi). It means that wi is
increased with increasing Pi. It is
accordingly concluded that the other
parameters, P and Gi were also increased
with increasing of control screen size, Pi.
Albeit in finest three control screen sizes tests, using 150, 106 and 75 microns the amount of P was almost constant and did not show significant discrepancy.
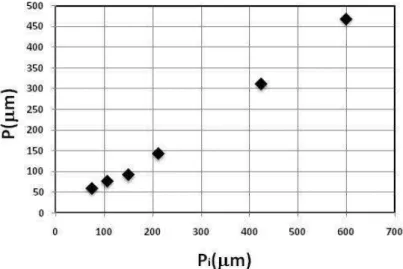
The tendency of variation for different parameters is presented in Figures 2 and 3.
The different behaviors for the Gi versus Pi
are observed (Figure 2). This change is started from about 150 microns, and could
be found in Pi and P values as well (Figure
3), although its inclination is relatively low and slow. This comes from the fact of higher fine mass production from coarse particles due to existing more flaws/cracks and weak fissures in coarse particles. Therefore, for sizes finer than 150 microns the production of fines was decreased comparing with coarser sizes. It is also observed that for sizes finer than 150 microns, the fine was constantly produced indicating that particles achieved their stable structure, in term of breakage.
Table 1: Results of experimental work index values, using Bond Ball Mill.
dF80=1476 (µm)
Pi (µm) Gi (g)
P (µm)
wi (kwh/sht)
75 1.98
59.2 9.072
106 1.92
75.7 10.005
150 1.98
91.0 10.202
212 2.63
142.2 10.141
425 4.66
310.9 10.201
600 6.64
467.4 10.699
Figure 3: Variation of P and Pi.
Figure 4: Linear trends for the Gi and Pi.
Figures 4 and 5 present the linear trends of Pi & P and Gi & Pi values, which were showed in Figures 2 and 3. It is clear that the linear equation would easily be fitted. Therefore, the linear equations were accordingly achieved from Figures 4 and 5, which are defined as following.
For control screen size of 75<Pi<150 µm,
P and Pi showed linear trend which was
defined with equation 3, and for 150<Pi<600 µm, the linear trend of P and
Pi was described with equation 4. For
control screen size of 75<Pi<150µm, Gi
and Pi showed linear trend which was
modeled with equation 5, and for
150<Pi<600 µm, the linear trend of Gi and
Pi was described with equation 6. Finally,
using equations 3, 4, 5 and 6, the general model (equation) to calculate the work index values for the Miduk copper ore was defined as equation 7 for two different
control screen size of 75<Pi<150 µm
(equation 7-a), and for 150<Pi<600 µm
(equation 7-b). 084 . 29 4189 . 0
Pi
P (3)
252 . 24 812 . 0
Pi
P (4)
95 . 1
i
G (5)
4254 . 0 0102 . 0 i i P
G (6)
1 82 . 0 23 . 0 1476 10 084 . 29 4189 . 0 10 ) 95 . 1 )( ( 5 . 44 i i i P P
w (7-a)
1 82 . 0 23 . 0 1476 10 252 . 24 812 . 0 10 ) 4254 . 0 0102 . 0 )( ( 5 . 44 i i i i P P P
w (7-b)
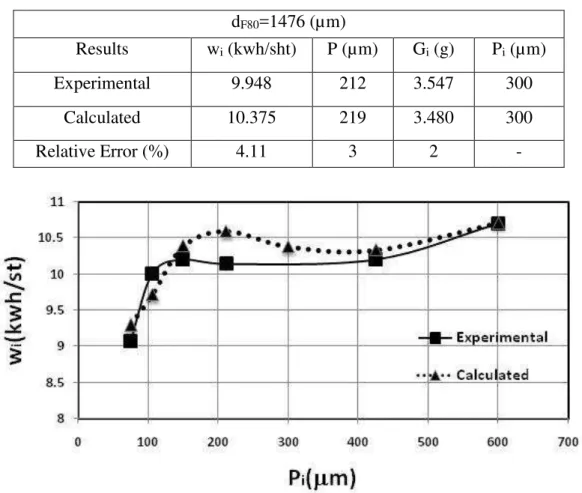
3- Evaluation of Work Index Model In order to evaluate the creditability of equation 7, to calculate the work index in various sizes, a test using 300 microns control screen was carried out in Bond ball mill. The work index was estimated according to the obtained results from this experiment which was equal to 9.948 kwt/st. Then the work index for this size, 300 microns, was calculated using equation 7 which was 10.3756 kwh/st. It is
observed that the discrepancy of
experimental and calculated work index values for 300 microns control screen was
low with 4.11% relative error. This low error is an indication of defined model
creditability. Table 2 shows the
experimental and calculated results. In next step the work index values which had experimentally been estimated for various sizes of control screens (Table 2), were calculated using equations 7-a (for control screen size: 75<Pi<150 µm) and 7-b (for
control screen size: 150<Pi<600 µm).
Table 2: Experimental & calculated work index values using 300µm screen.
dF80=1476 (µm)
Pi (µm) Gi (g)
P (µm)
wi (kwh/sht)
Results
300 3.547
212 9.948
Experimental
300 3.480
219 10.375
Calculated
- 2
3 4.11
Relative Error (%)
Figure 6: Experimental & calculated work index values.
4- Conclusions
It was attempted to explain physically and mathematically the behavior of work
index (wi), fine mass production (Gi),
control screen size (Pi) and product d80
size (P), using sample from Miduk Copper Mine. Thus some experiments with standard Bond ball mill were performed. The control screens were changed in these experiments, and the variation of other
parameters, Gi, Pi and P were defined and
modeled. However the following
conclusions were made:
- The work index values for the Miduk copper ore were experimentally estimated, using different control screens 600, 425, 212, 150, 106 and 75 microns in Bond ball mill.
- Results obtained from experiments showed two different trends for the various parameters which are effective for work
index estimation, P, Gi. This trend differs
from about 150 microns size.
- Using experimental results, the required linear models were fitted for P & Pi, and
Gi & Pi, and they were creditably
evaluated.
- According to the obtained results from experiments, and using defined linear models, equations for two different size fractions were proposed, in order to calculate the work index value for any control screen (product) size, using Miduk copper ore.
- In order to evaluate the creditability of defined model (equation 7), a test using 300 microns control screen was carried out. The work index was estimated to 9.948 kwt/st and the calculated value using equation 7 was 10.3756 kwh/st.
References
1- Bond, F.C, 1961,“Crushing & Grinding Calculations, Part I”, British Chemical
Engineering, pp. 378-385.
2- Doll, A., 2011,"Why so many tests?", 43rd Annual Meeting of the Canadian Mineral
Processors, January 2011, Ottawa, Canada.
3- Sahoo, A., Roy, G.K., 2008,"Correlations for the grindability of the ball mill as a measure
of its performance", Asia Pacific Journal of Chemical Engineering, Vol. 3, No. 2, pp. 230-235.
4- Deniz, V., Ozdag, H., 2003,"A new approach to bond grindability and work index:
dynamic elastic parameters", Minerals Engineering, Vol. 16, No. 3, March 2003, pp. 211-217.
5- Deniz, V., 2003,"Relationships between bond's grindability (Gbg) and breakage parameters
of grinding kinetic on limestone", 18th International Mining Congress and Exhibition of
Turkey-IMCET 2003, pp. 451-456.
6- Ozkahraman, H.T., 2010,"Breakagee mechanisms and an encouraging correlation between
the bond parameters and friability value", The Journal of the Southern African Institute of Mining and Metallurgy, Vol. 110, March 2010, pp. 153-159.
7- Magdalinovic, N.M., 1989,“Calculation of Energy Required for Grinding in a Ball Mill”,
International Journal of Mineral Processing, 25, pp. 41-46.
8- Noaparast, M., Delavarian, M., 2001,“The Effect of Change of Control Screen on Work
Index”, in Persian, Engineering Journal of the University of Tehran, volume 35, number 3,
pp. 429-436.
9- Rezaei, B., Noaparast, M., NoorMohammadi, M., 2007,“Prediction of Work Index Value
with Changing Control Screen”, in Persian, International Journal of Engineering of the
University of Science and Technology, volume 18, number 4, pp. 65-69.
10- Noaparast, M., Rahmati, S., Jozanikohan, G., Aslani, S., 2011,“A Work Index