http://dx.doi.org/10.1590/0104-530X1810-15
Resumo: A eiciência adquiriu maior relevância entre as organizações no cenário de mercados abertos, que teve início no Brasil por volta dos anos 1990. O objetivo deste artigo foi analisar, por envoltória de dados com bootstrap, a eiciência dos aeroportos brasileiros, utilizando as bases de dados da Agência Nacional de Aviação Civil (ANAC) e da Empresa Brasileira de Infraestrutura Aeroportuária (INFRAERO) de 2010, 2011 e 2012. Uma regressão múltipla foi utilizada para validar as variáveis do modelo proposto. Nesse modelo, a medida utilizada para representar o desempenho dos aeroportos foi a quantidade de passageiros processados (variável dependente); para as variáveis que determinam o desempenho (variáveis independentes) foram utilizados: número de pistas, número de balcões de check-in, número de estacionamento de aeronaves e área de passageiros. A partir de então, a técnica Análise Envoltória de Dados foi aplicada para os 16 aeroportos internacionais brasileiros, em abordagem operacional Para corrigir os valores de eiciência encontrados, tendo em vista o erro aleatório inerente aos dados, aplicou-se uma abordagem da técnica de bootstrap. Os resultados encontrados apontam que a grandeza de um aeroporto não foi determinante para atribuir eiciência, embora seja critério relevante para impulsionar melhorias no seu desempenho. Convém salientar, também, que a utilização dos recursos (inputs) para o alcance do produto (output) foi o critério mais relevante na busca do bom desempenho e da eiciência aeroportuária no estudo aqui apresentado. Nesse sentido, o aeroporto de Curitiba, na Região Sul do país, foi classiicado como o mais eiciente em todos os períodos, e os aeroportos do Galeão (Rio de Janeiro) e Manaus (Amazonas) como os menos eicientes.
Palavras-chave: Aeroportos brasileiros internacionais; Análise envoltória de dados; Eiciência operacional. Abstract: In the setting of open market organizations, eficiency has gained greater relevance, which in Brazil began around the 1990s. This paper applies the bootstrap data envelopment analysis aiming to study the eficiency of Brazilian airports, using the databases of the Agência Nacional de Aviação Civil (ANAC) and the Empresa Brasileira de Infraestrutura Aeroportuária (INFRAERO), dated of 2010, 2011 and 2012. We used multiple regression to validate the variables of the model. In this model, the measure used to represent the performance of airports was the number of processed passengers (dependent variable); for the variables that determine performance (independent variables) we used: number of runways, number of check-in counters, number of aircraft parking bays and passenger areas. The method was applied to study 16 Brazilian international airports in an operational approach. To correct the eficiency values found, given the inherent random error of the data, a bootstrap technique was applied. The approach showed that an airport’s size is not the determining factor to assign their eficiency. The use of resources to achieve the product was the most relevant criterion to investigate the airport’s good performance and eficiency in this study. The results obtained indicate that the Curitiba Airport is the most eficient. Moreover, the least eficient airports were the Galeão and Manaus Airports.
Keywords: Brazilian International airports; Data envelopment analysis; Operational eficiency.
Efficiency of Brazilian international airports:
applying the bootstrap data envelopment analysis
Eficiência dos aeroportos internacionais brasileiros: uma análise envoltória de dados com bootstrap
Ana Elisa Périco1
Naja Brandão Santana2
Daisy Aparecida do Nascimento Rebelatto3
1 Departamento de Economia, Universidade Estadual Paulista – UNESP, Rodovia Araraquara-Jaú, Km 1, CEP 14800-901, Araraquara,
SP, Brazil, e-mail: [email protected]
2 Centro de Ciências da Natureza, Universidade Federal de São Carlos – UFSCar, Rodovia Lauri Simões de Barros, Km 12,
CEP 18290-000, Buri, SP, Brazil, e-mail: [email protected]
3 Departamento de Engenharia de Produção, Universidade de São Paulo – USP, Avenida Trabalhador São-Carlense, 400, CEP 13566-590,
São Carlos, SP, Brazil, e-mail: [email protected] Received Oct. 22, 2014 - Accepted Aug. 25, 2015
1 Introduction
It is evident that Brazil has fallen behind in its much-needed infrastructure investments for some time. There are several reasons for this situation, particularly the economic stagnation that has prevailed for years in the country.
Compared to the previous decade, a more signiicant economic growth was seen from 2000 to 2010, resulting in a higher number of people employed, increased income generation, higher consumption and consequently reduced poverty.
With a more positive scenario in 2007, the Federal Government launched the Growth Acceleration Program (PAC), and its investments were used to inance infrastructure projects. However, despite resuming the investments, still short of the amount needed, major bottlenecks were detected.
The bottle necks that most standout today, evidenced by the average, are those related to airport infrastructure. The sector’s deregulation process, although limited and which took place in the 1990s, along with the economic growth of the last decade, resulted in a growing demand for air services. In addition, the two major sporting events held in Brazil, the World Cup 2014 (already held) and the Olympic Games in 2016, reveal the existing infrastructure problems in Brazilian airports.
Within this context and using the bootstrap data envelopment analysis (BDEA) technique, this study investigated the eficiency of 16 Brazilian international airports from 2010 to 2012, applying an operational approach. These results facilitate identifying the better performance airports.
This work is related to studies published in the literature that investigate the importance of transport infrastructure for socio-economic development, as well as the lack of infrastructure as a bottleneck factor in growth and regional development.
Along these lines, Berechman (1994) argues that transportation infrastructures can increase business productivity, impact prices of products and also affect the location of irms, resulting in a net economic growth. In his study of the countries of west and central Africa, Njoh (2009) achieves similar results, but also points out that the relationship between transportation and development infrastructure may be stronger in less developed countries.
Considering a real and positive relationship between transportation and development infrastructure, this work focuses on airport infrastructures.
Graham (2001) mentions the economic and social impacts that arise from the existence and maintenance of airports, such as impacts related to income, employment, investments, tax revenues and fees (related to airport economic activities), developing tourism and remote infrastructure investments (warehouses, branches of companies, improved urban infrastructure) etc.
To promote these impacts, the airport must be eficient and must adequately meet the demands for their services. In this sense, the available literature on airport eficiency has no precise deinition on how to measure the eficiency of an airport. It should be noted that creating a standard model of eficiency, which adapts to any situation, is no easy task and will likely result in a relative model of eficiency. Therefore, many authors use different approaches with variables that are sometimes repeated and sometimes not.
Curi et al. (2011) used the data envelopment analysis to estimate the eficiency of 18 Italian airports from 2000 to 2004. According to the authors, the size of airports does not provide advantages in terms of operational eficiency, but rather inancial eficiency advantages for hubs and disadvantages for smaller airports.
There are several other studies that have analyzed the eficiency of airports in a number of countries. Lozano & Gutiérrez (2011) analyzed the eficiency of 41 Spanish airports using 2006 data; Yang (2010) estimated the eficiency of 12 airports in the Asia Paciic region from 1998 to 2006; Barros & Dieke (2008) estimated the eficiency of Italian airports for 2003; Martin & Roman (2006) investigated the eficiency of 34 Spanish airports for 1997; Yoshida & Fujimoto (2004) estimated the eficiency of 67 Japanese airports for 2000; and Oum et al. (2008) and Lin & Hong (2006) analyzed the eficiency of the main airports in the world.
For Brazil, the work of Fernandes & Pacheco (2002) examined the eficiency of 35 domestic airports. The DEA technique was used to identify which airports used their resources eficiently and which demonstrated idle operations.
The literature presents a wide range of models using different eficiency approaches, always aiming for a greater role of the decision makers. Therefore, in this work the main motivation is to contribute to this discussion, also taking into account the two major sporting events hosted in Brazil. One is the World Cup, which already took place, and the other event is the Olympic Games in 2016; both of which have demanded and will demand Brazilian airport services.
This paper is structured as follows: section 2 has a brief literature review on data envelopment analysis, with the Bootstrap technique already incorporated. Section 3 describes the work methodology, deines the variables used and the application of the proposed model. Section 4 includes the discussions of the results achieved from the model application; and Section 5 offers the closing remarks.
2 Data envelopment analysis
them into a single index of relative overall eficiency, this technique assists decision makers.
The DEA is an operational research technique based on linear programming, with the objective to comparatively analyze independent units in terms of their relative performance. It is classiied as non-parametric because it does not use a predeined production function, identical for all organizations in the input-output analysis relationship. Therefore, to use it does not require preparing a ixed weighted formula to measure the eficiency of the analyzed units, because the weights of each variable are determined by the technique.
The DEA can be regarded as a body of concepts and methodologies embedded within collection models with different possible interpretations (Charnes et al., 1994).
2.1 Application steps of DEA models The application of DEA models requires executing a sequence of steps, as follows:
a) Choose the units to be entered into the analysis; b) Choose the appropriate variables (input and
output) to establish the relative eficiency of the units chosen; and
c) Identify the model orientation and returns to scale.
To select the units (a), the specialized literature suggests calling them decision making units (DMUs). According to Lins & Meza (2000), the irst observation to be made concerns the homogeneity of the DMUs. Homogeneous DMUs are those that perform the same tasks with the same goals and which are working under the same market conditions, such that the variables used are the same, except for their size. The units evaluated need to be suficiently similar so that the comparison makes sense, but should also be suficiently different to perform the discrimination.
Similar units can be understood as those that perform the same functions, or that produce the same type of products and services; that operate under the same conditions and that are subject to the same laws and regulations. The only factors that differentiate these units should be: location (considering a geographic area governed by the same rules), production scale and size.
Location and size will not be the factors that determine the eficiency of the units, provided they operate under the same laws and regulations. What makes these units different in terms of eficiency is how they use their resources to obtain results.
Thus, the imposition of the similarity between units refers to the functions and the products/services
generated. Moreover, in order to perform discrimination these units must be different, considering that the use of resources is different in each of these units, as well as the results achieved.
As for choosing the variables (b), Golany & Roll (1989) structured the procedures in three alternatives: careful judgment, quantitative analysis not based on DEA techniques and selection based on DEA.
As for the irst alternative, the big question is with regard to differentiating between the factors that cause the eficiency and the factors that explain it. The authors claim that only an analysis of causality, with the support of experts, can help decide whether a variable is cause or effect in the model being created.
The second alternative is with regard to statistics and regression analyses, to assist in the characterization of an input or output variable, as well as to assess their relevance and/or redundancy. For the authors, the weak relationship of some variables may indicate a need to review them and, if necessary, dismiss them.
And inally, for selecting variables from the DEA technique, Norman & Stoker (1991) proposed a systematic procedure for validating pre-selected variables, inspired by the stepwise method. The method uses an initial input-output pair, calculates the eficiency score of DMUs based on this pair and the correlation coeficients of all the other variables with this score. To select the next variable to enter the model, the list of variables is covered in a descending order of the correlation coeficient module. The goal is to incorporate the variable that allows to better it the DMUs to the eficiency frontier.
In the third step (c), that identiies the model orientation and returns to scale, the models that best represent production technology are deined, however there some restrictions, especially with respect to the orientation and type of returns to scale.
The eficiency model can answer either of two questions:
a) Do the units produce a certain level of output, or, to what level can the inputs be reduced while maintaining the current output level? This means minimizing inputs; and
b) The units use a certain level of input, then which is the highest output level that can be achieved with this level of input? This means maximizing the outputs.
It is then necessary to choose the direction of minimizing inputs and/or maximizing outputs.
A technology has constant returns to scale when the inputs increase or decrease in the same proportion as the outputs. A technology has variable returns to scale when the inputs are multiplied by a factor λ and the outputs can follow any behavior regarding this λ factor.
Among these models, the most suitable one can be chosen for the sample used. A mechanism used for this choice is the hypotheses test of returns to scales, presented by Banker (1996), that checks which is the most appropriate returns to scale (constant or variable) for the data set used. Banker (1996) suggests applying the nonparametric two-sample Kolmogorov-Smirnov test, based on the maximum distance of cumulative distribution of eficiency indicators of the CRS and VRS models.
The test evaluates the null hypothesis of constant returns to scale as opposed to the alternative hypothesis of variable returns to scale. The test is based on the maximum vertical distance between Fˆc
(
ln( )
qˆcj)
and ˆv
(
ln( )
ˆv)
jF q ; the empirical distributions of ln
( )
ˆc jq
and ln
( )
ˆv jq are used. The values are concentrated
between 0 and 1. Values close to 1 tend to reject the null hypothesis and therefore accept the alternative hypothesis (Banker & Natarajan, 2004).
Accordingly, the Kolmogorov-Smirnov test was performed and the VRS model was selected as the most appropriate. This procedure is detailed in section 4.2.
As in this study the proposal was to consider the output increase (processed passengers) in the airports investigated, the output-oriented approach was chosen. The model proposed, known as output-oriented VRS (Banker et al., 1984) is presented as follows (Equation 1):
1 =
+
∑
n i ki k iMaximize v x v (1)
where as:
1
1
= =
∑
m r rk ru y
1 1 0
= =
− − ≥
∑
m r jr∑
n i jr kr i
u y v x v
, ≥0
r i
u v
considering:
y = outputs; x = inputs / u, v = weights / r = 1,..., m.; i = 1,..., n; j=1,...,n.
The goal of the output-oriented VRS is to maximize the production level, using the observed consumption of inputs. The variables uk and vk were introduced
representing the variable returns to scale. These variables should not meet the limit of positivity and may have negative values.
2.2 DEA bootstrap
To correct the eficiency values in view of the random error inherent in the data, Simar & Wilson (1998) propose an approach. The bootstrap method is applied through the DEA technique to proceed with the statistical inference of the eficiency results obtained by the DEA.
Thus, for each unit the eficiency conidence interval was estimated, the bias and the corrected eficiency, to be used for the airport performance assessment. Equation 2 shows the process to generate the conidence interval for the performance indicator.
(
)
Prq δ q q δˆ− ≤ ≤ + ˆ = −1 a (2)
where: q is the ‘true’ eficiency indicator; qˆ is an
estimate of the eficiency indicator; δ is the margin of error; a is the level of statistical signiicance. With the conidence interval of the eficiency estimator, obtained via the resampling process, ICq,(1−a)%= ±q δˆ ,
which is a more robust performance index of the data sensitivity. Also, the size of the bias eficiency estimator can be found
(
q qˆ−ˆboot)
.3 Research method
This section presents the procedure steps used in the empirical research.
3.1 The database
The data used were the Operational Performance Reports records of Airports, obtained from the National Civil Aviation Agency website (Brasil, 2013) and other airport technical data taken from the website of the Brazilian Airport Infrastructure Enterprise (INFRAERO, 2013).
The analysis period (2010 to 2012) was determined due to the data availability of ANAC and INFRAERO, choosing to use the most recent periods with fully standardized data.
3.2 The sample
The sample investigated in this study was composed of 16 Brazilian international airports. The delineation was because the ANAC had disaggregated data only for this category of airports. The idea was to include different sizes of airports so the analysis could also make use of this aspect. The Chart 1 shows the airports that were investigated.
3.3 Selection of variables and application of the model
The proposal to choose the variables and deine a theoretical model was based on two factors: (i) data availability of Brazilian airports; (ii) different models of airport eficiency, deined in major international studies.
As the units analyzed were Brazilian airports, a suitable measure to assess their performance was the Number of Processed Passengers.
Considering the two factors mentioned above, some operational variables that are related to the performance measure proposed were identiied (number of passengers processed). Chart 2 shows the variables identiied and their classiications.
A multiple linear regression was used to validate the proposed model. Therefore, it was determined whether the proposed variables (inputs) contributed to determine the number of passengers processed in the airports investigated. The analysis was composed of panel data of 16 airports, observed in 3 years (t=3), representing a total of 48 observations.
The model estimated in this work is the log-log type and is presented as follows (Equation 3):
1 2
3 4
=∝ + + +
+t it+ it
it it it
PaxProc NPistas Checkin
EstAero AreaPax
β β
β β ε (3)
The variable αt of technical progress relects the
model dysfunctions that are common to all airports at each time period, a dummy. In practice, this variable controls the effects of qualitative characteristics, which acts on the number of passengers processed in each airport investigated.
Regarding the error structure, the panel data availability allowed greater lexibility for its speciication, which is shown below (Equation 4):
= + it i it
ε η µ (4)
where µit is the supposed error and ηi concerns the individual characteristics and effects of each airport, which are constant over time and not observed, such as effects of size, location and a mix of other factors that materialize in signiicant differences between the airports.
Considering that component ηi can vary in the cross section, it is the speciication of the estimators. The two most common formulations to specify the nature of the individual effects in a panel model are the use of ixed effects (Least Squares Dummy Variable Model) or random effects (Estimated Generalized Least Squares).
Choosing the treatment of the individual effects (ixed or random) depends on the lack of correlation between the individual effects not observed (ηi) and the explanatory variables. The choice was made based on the test proposed by Hausman (1978).
4 Presentation and analysis of results
This section describes the validation and application of the proposed model, as well as the results and their analysis.4.1 Validation of the variables
From the model proposed earlier (Equation 3), in which the number of passengers processed at an airport is determined by the number of runways, check-in counters, number of aircraft parking bays and passenger terminal areas, the elasticities of each of the explanatory variables in relation to the dependent variable were explored.
After establishing, via the Hausman test, that the explanatory variables are exogenous, it can be stated that they have no correlation with the error term. Estimating the model by applying the individual effects of each airport was also considered. It was presupposed that the unobserved characteristics that
Chart 1. Airports investigated.
Guarulhos International Airport (SP) Conins International Airport (MG) Manaus International Airport (AM) Congonhas International Airport (SP) Porto Alegre International Airport
(RS) Florianópolis International Airport (SC) Brasilia International Airport (DF) Recife International Airport (PE) Belem International Airport (PA)
Galeão International Airport (RJ) Curitiba International Airport (PR) Natal International Airport (RN) Maceio International Airport (AL) Fortaleza International Airport (EC)
Salvador International Airport (BA) São Luís International Airport (MA)
Chart 2. Variables proposed for the analysis.
Inputs Output
Number of runways (Nrunways) Number of check-in counters (Checkin) Number of aircraft parking bays (EstAero) Passenger terminal area (AreaPax)
may vary from airport to airport should be considered in the model, as they could have an effect on the results of the parameters. Thus, the model was estimated considering the ixed and random effects.
The Hausman test was again performed and the results indicated the rejection of the null hypothesis (H0), therefore, the ixed effects model was considered
as consistent and eficient (Table 1).
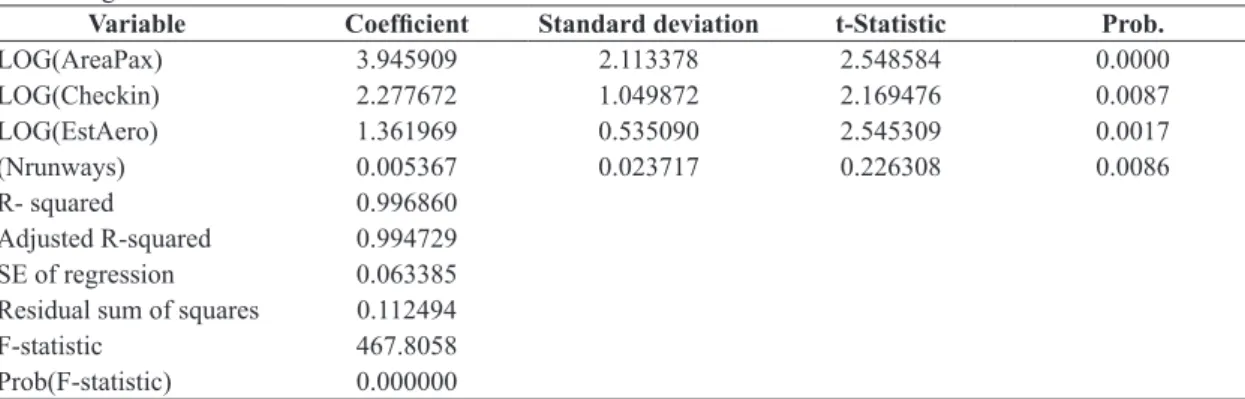
The Hausman speciication test provided evidence that there is a correlation between the unobservable effects and the explanatory variables in the model. Accordingly, Table 2 shows the estimation results considering the ixed effects, using the heteroscedasticity-robust White matrix.
In the ixed effects model, the estimate was made assuming that the heterogeneity of airports is captured in the constants, which is different from airport to airport, capturing invariant differences over time. It was observed that the estimated coeficients are signiicant, especially for passenger terminal areas (3.94), check-in counters (2.27) and aircraft parking bays (1.36). Thus, the parameters obtained by estimating the ixed effect model can be considered as the best linear estimators and the adjusted high coeficient helps validate the model (Equation 3).
4.2 Data envelopment analysis
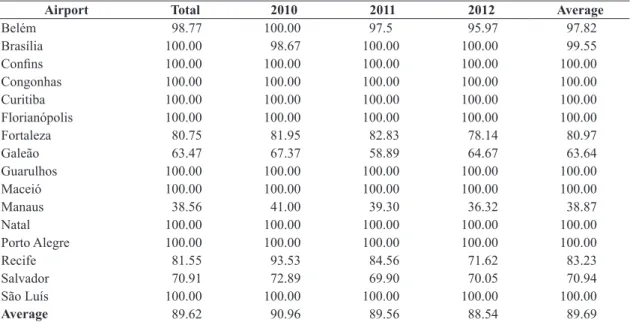
Table 3 summarizes the distribution of eficiency scores of the airports considering the cumulative period (2010-2012), for the variable returns to scale
(DEA-VRS) model. Considering this speciicity, 62.50% of the airports were eficient.
Regarding the deinition of the DEA model (constant or variable scale), the literature suggests conducting the Kolmogorov-Smirnov (KS) test, since the technology choice is a key issue, which can produce distorted results if decided arbitrarily.
In the test procedure, the statistics value (0.7911) was obtained (α = 1%) which allowed to accept the hypothesis of variable returns to scale. The result of this test justiies presenting only the results of the variable returns to scale model (Table 3 – cumulative results; Table 4 – non-cumulative results).
The model used in this study did not consider the weight restriction possibility of the variables. The proposed model was validated by multiple linear regression, which showed signiicant coeficients for independent variables, which means that to some extent they can explain the number of passengers processed in airports.
This procedure does not guarantee that the weights of all model variables in the data envelopment analysis will assume non-zero values. However, considering that in only 6 observations (total of 48) zero weight variables were observed and that there were no major differences in the weights of the variables for the units investigated, it was decided not to impose any weight restrictions or exclude variables, thereby preventing subjectivity in the model.
For the few cases that zero weights were observed for certain variables, we consider that they did not contribute to the eficiency indexes obtained.
Table 1. Hausman Test.
Cross Section and Random Effects Test (Test Summary)
Chi-Sq. Statistic Chi-Sq. d.f. Prob.
Random Cross Section 10.073047 6 0.1974
Table 2. Regression – Fixed effects. Dependent Variable: LOG(Paxproc) Method: Panel Least Squares Periods included: 3 Units: 16 White diagonal standard errors & covariance
Variable Coeficient Standard deviation t-Statistic Prob.
LOG(AreaPax) 3.945909 2.113378 2.548584 0.0000
LOG(Checkin) 2.277672 1.049872 2.169476 0.0087
LOG(EstAero) 1.361969 0.535090 2.545309 0.0017
(Nrunways) 0.005367 0.023717 0.226308 0.0086
R- squared 0.996860
Adjusted R-squared 0.994729
SE of regression 0.063385
Residual sum of squares 0.112494
F-statistic 467.8058
Moreover, in the six situations, the variables were “number of check-in counters” and “number aircraft parking bays”, in the three years of investigation, for a major airport in the Southeast region of the country. This airport is known for being very large (large number of check-in counters and aircraft parking bays) and not very busy (low number of processed passengers, considering the installed potential), which partly explains the zero weight for those variables.
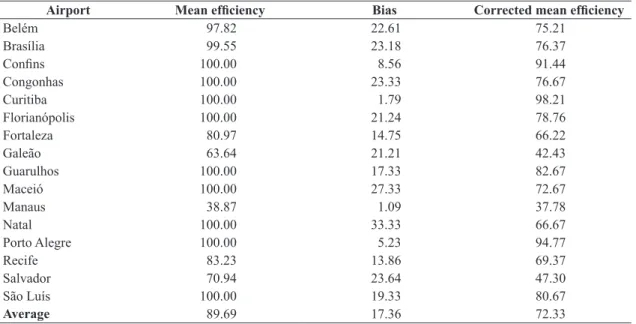
In order to correct the eficiency values, considering the random errors inherent in the data, we used the approach proposed by Simar & Wilson (1998). Table 5 shows the original eficiency index (biased), the bias and indices corrected by the bootstrap technique. The bootstrap results were generated by resampling 200 pseudo-samples (B=2000).
We chose to present the average results per airport, which despite the annual bias corrections, the indicators remained relatively stable over the years.
According to the results in Table 5, the signiicant effect of the eficiency indexes can be seen with respect to the sample variations, reducing the average eficiency by 17.36%. The corrected average eficiency values in most cases are considerably different in magnitude when compared with the original values. An example that conirms this observation is with regard to the airport in Natal (Rio Grande do Norte), which after applying the bootstrap technique, its eficiency index of 100.00% was corrected to 66.67%.
What was in fact found was that through a purely deterministic analysis, without considering the statistical bias inluence, the results found are overestimated.
4.3 Analysis of results
Table 6 summarizes the descriptive eficiency statistics of 16 airports. The analysis of the non-cumulative periods shows a decrease in the average eficiency of 2.7 percent (2010-2012).
Another analysis concerns the eficiency differences observed at the airports considering their size. Therefore, the average eficiency indicators of the airports were calculated for the three sizes investigated (extra large, large and medium) in 2010, 2011 and 2012. Table 7 shows the results.
We highlight that the size of the airports was set based on the criteria proposed by Burman et al. (2007, apud Brasil, 2012), which classiies airports according to the number of passengers processed per year.
For the sample of 16 airports surveyed, in 2010 four airports were classiied as extra large, six airports were classiied as large and six as medium-sized. This classiication remained unchanged in 2011. However in 2012, six airports were classiied as extra Table 3. Distribution of airports according to class.
Performance Class Airports
0-20% 0 0%
20-40% 1 6.25%
40-60% 0 0%
60-80% 2 12.5%
80-99% 3 18.75%
100% 10 62.5%
Total 16 100%
Score
Minimum 38.56
Average 89.6
Maximum 100
Table 4. Eficiency indicators of airports.
Airport Total 2010 2011 2012 Average
Belém 98.77 100.00 97.5 95.97 97.82
Brasília 100.00 98.67 100.00 100.00 99.55
Conins 100.00 100.00 100.00 100.00 100.00
Congonhas 100.00 100.00 100.00 100.00 100.00
Curitiba 100.00 100.00 100.00 100.00 100.00
Florianópolis 100.00 100.00 100.00 100.00 100.00
Fortaleza 80.75 81.95 82.83 78.14 80.97
Galeão 63.47 67.37 58.89 64.67 63.64
Guarulhos 100.00 100.00 100.00 100.00 100.00
Maceió 100.00 100.00 100.00 100.00 100.00
Manaus 38.56 41.00 39.30 36.32 38.87
Natal 100.00 100.00 100.00 100.00 100.00
Porto Alegre 100.00 100.00 100.00 100.00 100.00
Recife 81.55 93.53 84.56 71.62 83.23
Salvador 70.91 72.89 69.90 70.05 70.94
São Luís 100.00 100.00 100.00 100.00 100.00
large, six airports were classiied as large and only four were classiied as medium-sized.
Table 7 shows that the average eficiency of the total sample decreased by 2.7%. For airports classiied as extra large, between 2010 and 2012 there was a small decrease in the average eficiency of about 0.5 percent.
With regard to the extra large airports, despite the change in the number of airports over the years within this group, there are some peculiarities. The irst concerns the inclusion of two other airports in this group (Galeão and Salvador) in 2012, which show the eficiency indicators as only “reasonable”. Accordingly, the group (2010 and 2011) that was earlier composed of well-qualiied airports in terms of operational eficiency (Guarulhos, Congonhas, Brasília and Conins), increased in size and showed a slightly reduced average eficiency.
Moreover, it is seen that most of the airports in that group operated with an overload in 2012.
The Galeão Airport is admittedly underutilized. In this airport all resources are quite substantial. This is a very large airport. However, it has an average number of processed passengers, which results in an ineficient use of its resources.
The Salvador Airport also deserves attention when analyzed. This airport and the Conins airport share some similarities concerning their available resources. The Conins airport was a benchmark for the Salvador airport in all the years investigated. Considering this aspect, the data envelopment analysis suggests that the Salvador airport under-utilized its resources (considering the performance achieved by Conins) and was considered ineficient. Consequently, the Salvador airport would have the potential to increase the number of passengers processed.
Table 5. Corrected eficiency indicators.
Airport Mean eficiency Bias Corrected mean eficiency
Belém 97.82 22.61 75.21
Brasília 99.55 23.18 76.37
Conins 100.00 8.56 91.44
Congonhas 100.00 23.33 76.67
Curitiba 100.00 1.79 98.21
Florianópolis 100.00 21.24 78.76
Fortaleza 80.97 14.75 66.22
Galeão 63.64 21.21 42.43
Guarulhos 100.00 17.33 82.67
Maceió 100.00 27.33 72.67
Manaus 38.87 1.09 37.78
Natal 100.00 33.33 66.67
Porto Alegre 100.00 5.23 94.77
Recife 83.23 13.86 69.37
Salvador 70.94 23.64 47.30
São Luís 100.00 19.33 80.67
Average 89.69 17.36 72.33
Table 6. Descriptive statistics of the eficiency indicators of 16 airports.
Measures 2010 2011 2012
Average 73.19 72.58 71.23
Median 76.66 75.83 75.32
Standard deviation 16.45 17.44 18.15
Maximum 98.21 97.73 98.70
Minimum 42.18 39.26 36.41
Table 7. Average eficiency by size.
2010 2011 2012
Total sample 73.19 72.58 71.23
Extra large 70.00 68.81 69.63
Large 79.25 78.75 71.73
As for the large airports, the average eficiency decrease was of 9.5%. This is a major downturn. In 2010 and 2011 this group was composed of the airports of Salvador, Conins, Porto Alegre, Recife, Curitiba and Fortaleza. In 2012 the airports of Salvador and Conins became extra large. Additionally, also in 2012, two other airports were included in the large category, the airports of Manaus and Florianopolis.
Therefore, as seen in Table 4 (even without disregarding the bias), the only airport in the large category that over the years did not remain stable in the eficiency indicators is Recife. There is also a signiicant decrease between 2011 and 2012.
In all the years investigated, the benchmark for the Recife airport was the Porto Alegre airport. We see that these airports were close with regard to some variable inputs, however the Porto Alegre airport transported more passengers than the Recife airport, and this difference intensiied even more between 2011 and 2012.
Moreover, in 2012 the Manaus airport was classiied as large; and this airport showed the lowest eficiency indicators in all the investigated years. Thus, these two airports (Recife and Manaus) became the ones responsible for the large eficiency decrease in the group as a whole.
The benchmark criterion of the Manaus airport was the Curitiba airport. This is a peculiar case. In all years investigated, the Manaus airport had a higher number of passenger terminal areas, check-in counters and aircraft parking bays. Only the number of runways in the airports was similar. However, the Curitiba airport carried more passengers than the Manaus airport. Accordingly, the resources of the Manaus airport were underutilized (compared with the use of resources of the Curitiba Airport) and the data envelopment analysis classiied it as an ineficient airport.
And inally, the mid-sized airports increased their average yield by 5.5%. This development was mainly due to the new classiication of the Manaus airport, which in 2010 and 2011 was a medium sized airport. However in 2012 it was classiied as large. We emphasize that the eficiency indicators of this airport were the lowest in the three years investigated. For this reason, its new category (large-sized) had a decrease in average eficiency and the old category absorbed an increase (medium-sized).
The DEA method does not consider the airport size to classify it as eficient, but rather the relationship between the use of resources (inputs) to obtain the product (outputs). Therefore, the eficiency addressed here refers to the relationship between the results obtained and the resources used. The managerial aspects (resource allocation decisions) are more important than the size of the investigated airport.
For example, the Guarulhos International Airport classiied as the largest airport in the country according to the ranking of Burman et al. (2007 apud Brasil, 2012), obtained an average eficiency score of 82.67% in the data envelopment analysis (Table 5). This means that the Guarulhos airport did not optimize the use of its resources (passenger terminal areas, number of check-in counters, number of aircraft parking bays and number of runways) taking into account the total number of passengers processed. In terms of eficiency and considering the variables used, the Guarulhos airport could improve the use of its resources and has the potential to signiicantly increase the number of passengers processed, while maintaining the input levels observed.
As for the Curitiba airport, the data envelopment analysis determined that this is the most eficient airport with regard to using its resources. However, according to the classiication of Burman et al. (2007 apud Brasil, 2012), this airport ranked as the ninth largest airport.
Table 5 also shows the two least eficient airports in the period investigated: the Manaus (AM) and Galeão (RJ) airports. Using the data envelopment analysis the potential increase of passengers processed (output) was estimated considering the resources used (inputs) by these two airports.
The Galeão airport in Rio de Janeiro, which in the overall period and also annually was less eficient, could increase its production (processed passengers) by 57.5% in the total period; 48.4% in 2010; 69.8% in 2011; and 54.6% in 2012.
The Manaus Airport, taking into account the resources used (inputs), had the potential to increase the passengers processed by 159.3% in the overall period; 143.9% in 2010; 154.5% in 2011; and 175.3% in 2012.
According to the results of the data envelopment analysis (Table 5), the eficiency ranking of Brazilian airports was as follows: Curitiba, Porto Alegre, Conins, Guarulhos, São Luís, Florianópolis, Congonhas, Brasília, Belém, Maceió, Recife, Natal, Fortaleza, Salvador, Galeão and Manaus.
We highlight that by the end of 2012, 9 of the 16 surveyed airports had an occupancy level greater than its capacity, namely: Guarulhos, Congonhas, Brasília, Maceió, Conins, Porto Alegre, Fortaleza, Florianópolis and Natal (Brasil, 2013).
However, there is an exception that should be considered. It is important to use caution when estimating the potential increase of ineficient airports, determined by the performance of overloaded airports.
of 86% and the Manaus airport was operating at 90% (Brasil, 2013).
Table 8 identiies the productivity of the two main explanatory variables of the model and veriies some of the reasons why some airports are considered more eficient than others. For example, if an airport’s eficiency depended exclusively on the ratio between the passenger terminal areas and the total processed passengers, the Congonhas airport (São Paulo) would be the most eficient, since each square meter processed up to 237 passengers. Therefore, the least eficient would be the Galeão Airport in Rio de Janeiro (46.45 passengers/m2).
In the “passengers processed/check-in counters” ratio, the most eficient airport was Porto Alegre (Rio Grande do Sul) since each check-in counter processed 209,565 passengers. The less eficient airport in this respect was the Maceio airport (Fortaleza), with 56,920 passengers processed/check-in counter.
5 Final remarks
This work evaluated the eficiency of 16 airports, using the bootstrap data envelopment analysis. The technique was applied to a set of airports using data for 2010, 2011 and 2012.
The data envelopment analysis considered the best combination of inputs in order to generate better results, respecting the different production scales. Therefore, for each period investigated, an ideal combination was found, which served as a reference for the less eficient airports. An ideal combination means that the resources (inputs) were optimized, which means they were better used for the indings, which does not necessarily represent the absolute best
use. We underscore that the results do not refer to an absolute eficiency, that is, the airports considered eficient are only classiied like this in the group in question. Therefore, the ideal combinations (of inputs to generate results) represent the most eficient of this group.
The results achieved indicate the Curitiba airport as the most eficient. Moreover, the least eficient ones were the Galeão and Manaus airports.
Accordingly, the Airports Operational Performance Report (Brasil, 2013) designated the Brasilia airport as the most eficient, followed by the Curitiba airport. The Galeão and Manaus Airports were ranked second to last and last, respectively. We emphasize that this indicator, developed and used by the ANAC, uses operating and inancial variables.
The differences in results between the DEA eficiency indexes and the rankings of the best airports of ANAC do not subtract values from any of the results. Each one is suited to its proposed objective. It should be noted that although the results of both analyses are different, they can be used together to better understand the factors that may affect the performance of airports.
The analyses did not indicate the predominance of greater eficiency among the extra large airports. It was concluded that the medium- and large-sized airports were considered to be more eficient in the period investigated, with the variables used. Therefore, to achieve the results found, the question of the best use of inputs is more relevant than the size of the airport.
It is also important to consider the performance of airports, particularly taking into account the two sporting events (World Cup and Olympic Games) Table 8. Airports/Data.
Airports Passengers processed /Passenger terminal area
Passengers processed /Check-in counters
Belém 78.30 86,727
Brasília 155.23 191,596
Conins 138.48 177,883
Congonhas 237.20 189,118
Curitiba 130.35 195,531
Florianópolis 209.35 87,807
Fortaleza 139.57 160,554
Galeão 46.45 78,083
Guarulhos 145.61 100,744
Maceió 62.09 56,920
Manaus 57.69 74,149
Natal 198.85 88,412
Porto Alegre 129.29 209,565
Recife 112.77 94,586
Salvador 110.60 116,889
São Luís 173.14 63,747
Logistics and Transportation Review, 44(6), 1039-1051. http://dx.doi.org/10.1016/j.tre.2008.01.001.
Berechman, J. (1994). Urban and regional economic impacts of transportation investment: A critical assessment and proposed methodology. Transportation Research Part A, Policy and Practice, 28(4), 351-362. http://dx.doi. org/10.1016/0965-8564(94)90009-4.
Brasil. Agência Nacional de Aviação Civil – ANAC. (2012). Movimento operacional nos principais aeroportos do Brasil. Brasília. Recuperado em 1 de fevereiro de 2013, de http://www2.anac.gov.br/arquivos/pdf/ Relatorio_Movimento_Operacional_18fev2012.PDF Brasil. Agência Nacional de Aviação Civil – ANAC. (2013).
Relatório de desempenho operacional dos aeroportos. Brasília. Recuperado em 1 de fevereiro de 2014, de http://www2.anac.gov.br/biblioteca/portarias/2011/ Relatorio%20Aeroportos%2014fev.pdf
Charnes, A., Cooper, W., Lewin, A. Y., & Seiford, L. M. (1994). Data envelopment analysis: theory, methodology, and application. Boston: Kluwer Academic Publishers. http://dx.doi.org/10.1007/978-94-011-0637-5. Curi, C., Gitto, S., & Mancuso, P. (2011). New evidence on
the efficiency of Italian Airports: a bootstrapped DEA analysis. Socio-Economic Planning Sciences, 45(2), 84-93. http://dx.doi.org/10.1016/j.seps.2010.11.002. Empresa Brasileira de Infraestrutura Aeroportuária –
INFRAERO. (2013). Brasília. Recuperado em 1 de fevereiro de 2014, de http://www.infraero.gov.br/index. php/br/aeroportos.html
Fernandes, E., & Pacheco, R. R. (2002). Efficient use of airport capacity. Transportation Research Part A, Policy and Practice, 36(3), 225-238. http://dx.doi.org/10.1016/ S0965-8564(00)00046-X.
Golany, B., & Roll, Y. (1989). An application procedure for DEA. Omega, 17(3), 237-250. http://dx.doi. org/10.1016/0305-0483(89)90029-7.
Graham, A. (2001). Managing airports: an international perspective. Oxford: Butterworth-Heinemann. Hausman, J. A. (1978). Specification tests in econometrics.
Econometrica, 46(6), 1251-1271. http://dx.doi. org/10.2307/1913827.
Lin, L. C., & Hong, C. H. (2006). Operational performance evaluation of international major airports: an application of data envelopment analysis. Journal of Air Transport Management, 12(6), 342-351. http://dx.doi.org/10.1016/j. jairtraman.2006.08.002.
Lins, M. P. E., & Meza, L. A. (2000). Análise envoltória de dados e perspectivas de integração no ambiente de apoio à decisão. Rio de Janeiro: Editora da COPPE/UFRJ. Lozano, S., & Gutiérrez, E. (2011). Efficiency analysis and
target setting of Spanish airports. Networks and Spatial Economics, 11(1), 139-157. http://dx.doi.org/10.1007/ s11067-008-9096-1.
hosted in Brazil. The World Cup has already taken place and although there were improvements made in the host city airports, potential problems are not ruled out.
Changes are needed. Of the airports in the Southern region, considered the most eficient, until the end of 2011 only the Curitiba airport was not operating with overloads. The airports of Porto Alegre and Florianópolis were operating well above their capabilities. These changes are already in operation, although at a slower pace than needed to properly meet, with quality, the increased demand observed.
The results presented here are relevant for two major reasons. The irst one concerns the crucial relevance of airports for the dynamics of passenger transport in Brazil. Since 2006, when the tariff liberalization of the sector took place, Brazilians started to travel more by plane. Prior to this period, the infrastructure bottlenecks of the airport system were not in evidence. It was only after 2006 that the existing laws were identiied. Accordingly, the results presented here highlight how the Brazilian airports are classiied through different criteria used by the Regulatory Agency of the Sector and particularly point out aspects that can be improved.
Furthermore, added to the condensed number of studies on airport performance in Brazil, the bootstrapped data envelopment analysis technique is not often disseminated in the national literature. The use of bootstrapping as a method to correct the random error inherent in the data is a common practice in the international literature, and it produces robust and consistent results.
Therefore, the results presented here meet the proposed objectives and are in line with the methodological rigor of important research in the area of infrastructures, and also with the data envelopment analysis.
For future studies we suggest using the bootstrapping data envelopment analysis in other sectors, as well as incorporating other techniques for selecting variables.
References
Banker, R. D. (1996). Hypothesis tests using data envelopment analysis. Journal of Productivity Analysis, 7(2-3), 139-159. http://dx.doi.org/10.1007/BF00157038. Banker, R. D., & Natarajan, R. (2004). Statistical tests based
on DEA efficiency scores. In W. Cooper, L. Seiford & J. Zhu. Handbook on data envelopment analysis (Vol. 11, pp. 265-298). New York: Kluwer Academic Publishers. Banker, R. D., Charnes, A., & Cooper, W. W. (1984). Some
Economics, 64(2), 422-435. http://dx.doi.org/10.1016/j. jue.2008.03.001.
Simar, L., & Wilson, P. W. (1998). Sensitivity analysis of efficiency scores: how to bootstrap in nonparametric frontier models. Management Science, 44(1), 49-61. http://dx.doi.org/10.1287/mnsc.44.1.49.
Yang, H. H. (2010). Measuring the efficiencies of Asia-Pacific international airports: parametric and non-parametric evidence. Computers & Industrial Engineering, 59(4), 697-702. http://dx.doi.org/10.1016/j.cie.2010.07.023. Yoshida, Y., & Fujimoto, H. (2004). Japanese-airport benchmarking with the DEA and endogenous-weight TFP methods: testing the criticism of overinvestment in Japanese regional airports. Transportation Research Part E, Logistics and Transportation Review, 40(6), 533-546. http://dx.doi.org/10.1016/j.tre.2004.08.003. Martin, J. C., & Roman, C. (2006). A benchmarking
analysis of Spanish commercial airports: a comparison between SMOP and DEA ranking methods. Networks and Spatial Economics, 6(2), 111-134. http://dx.doi. org/10.1007/s11067-006-7696-1.
Njoh, A. (2009). The development theory of transportation infrastructure examined in the context of Central and West Africa. The Review of Black Political Economy, 36(3-4), 227-243. http://dx.doi.org/10.1007/s12114-009-9044-4.
Norman, M., & Stoker, B. (1991). Data Envelopment Analysis: the assessment of performance. Sussex: John Wiley & Sons.