INTRODUCTION
Nowadays, nanoparticles such as silicon dioxide [1-3], Portland cement [4], and carbon nanotubes (CNT) [5, 6] have been tested in ultra-high strength concretes in order to improve their performance. The results published in [7] show an optimum nano-silica content, i.e. the smallest quantity of nano-particles that leaded to the maximum compressive strength gain, for mixtures containing 0.5 wt% of silica nanoparticles. In [8], the maximum gain on compressive strength was observed for mixtures containing 2 wt% of
nano-silica. The results published in [9] show a maximum gain on compressive strength for mixtures containing 2.82 wt% of nano-silica. In [10-12], the optimum content for mixtures containing 3 wt% of nano-silica was observed. In [13] the maximum compressive strength occurred for mixtures formulated with 4 wt% of nano-silica. Results published in [14] exhibit a tendency of linear increase on compressive strength, reaching the maximum strength for concretes formulated with 5 wt% of nanoparticles. In [15] the optimum nano-silica content was reached for mixtures containing 6% of nanoparticles. For large amounts of
nano-Effects of nano-silica on mechanical performance and microstructure of
ultra-high performance concrete
(Efeitos da nanossílica no desempenho mecânico e microestrutura de
concretos de ultra-alta resistência)
T. M. Mendes1, W. L. Repette2, P. J. Reis3
1Dept. Environmental Engineering, UTFPR, Campus Londrina, Londrina, PR
2Dept. Civil Engineering, CTC, UFSC, Florianopolis, SC
3Lab. Applied Nuclear Physics, UEL, Londrina, PR
[email protected],[email protected],[email protected]
Abstract
The use of nanoparticles in ultra-high strength concretes can result in a positive effect on mechanical performance of these
cementitious materials. This study evaluated mixtures containing 10 and 20 wt% of silica fume, for which the optimum nano-silica
content was determined, i.e. the quantity of nano-silica that resulted on the higher gain of strength. The physical characterization
of raw materials was done in terms of particle size distribution, density and speciic surface area. Chemical and mineralogical compositions of materials were obtained through luorescence and X-ray diffraction. The mechanical performance was evaluated by compressive strength, lexural strength and dynamic elastic modulus measurements. The microstructural analysis of mixtures
containing nano-silica was performed by X-ray diffraction, thermogravimetry, mercury intrusion porosimetry and scanning electron
microscopy. Obtained results indicate an optimum content of nano-silica of 0.62 wt%, considering compressive and lexural strengths. This performance improvement was directly related to two important microstructural aspects: the packing effect and
pozzolanic reaction of nano-silica.
Keywords: ultra-high strength, nano-silica, mechanical performance, microstructure.
Resumo
O uso de nanopartículas em concretos de ultra-alta resistência pode resultar em um efeito positivo no desempenho mecânico destes materiais cimentíceos. Neste estudo foram avaliadas matrizes cimentíceas contendo 10 e 20% de microssílica, para as quais foi determinado o teor ótimo de nanossílica, i.e. a quantidade de nanossílica que resultou no maior ganho de resistência. A caracterização física das matérias-primas foi realizada em termos de distribuição do tamanho das partículas, densidade e área supericial especíica. As composições química e mineralógica dos materiais foram determinadas por meio de luorescência e difração de raios X. O desempenho mecânico das misturas foi avaliado por meio da medição de resistência à compressão, resistência à tração na lexão e módulo de elasticidade dinâmico. A análise microestrutural das amostras contendo nanossílica foi realizada por meio de difração de raios X, termogravimetria, porosimetria de intrusão de mercúrio e microscopia eletrônica de varredura. Os resultados obtidos indicaram um teor ótimo de 0,62% de nanossílica, considerando resistências à tração na lexão ou à compressão. Este ganho de desempenho foi diretamente relacionado a dois aspectos microestruturais importantes: o efeito de empacotamento e a reação pozolânica da nanossílica.
silica, the maximum gain on mechanical properties for mixtures formulated with 10 wt% of silica nanoparticles was reported [16]. The lexural strength and elastic modulus present the same tendency for optimum nano-silica contents obtained for compressive strength, as reported in [7-9, 12].
This improvement on material’s properties is mainly related to two important microstructural aspects: the packing effect and the pozzolanic reaction of nano-silica. A porosity reduction and a pore reinement for mixture containing nano-silica, both determined by mercury intrusion porosimetry (MIP), have been reported in [7, 12, 15]. These results are similar to those reported in [11] for material’s water penetration depth. Pozzolanic reaction was observed in [13], considering the higher mass loss of hydrated products (CSH/CAH, calcium silicate or aluminate hydrates), and consequently consumption of calcium hydroxide, Ca(OH)2, due to the pozzolanic reaction from nano-silica. Similar results were reported in [7], considering the reduction of calcium hydroxide. Both reaction products were measured by thermogravimetry. For ultra-high strength concretes containing nano-silica and granite aggregates, SEM micrographs showed the absence of interface zone transition (IZT) between the cement matrix and the aggregates [11]. So, this paper aimed to study the effect of nano-silica on the mechanical properties and microstructure of ultra-high strength concrete.
MATERIALS AND METHODS
Pure clinker (CP) was obtained by ball milling of clinker received from Votorantim Cimentos, during 90 min and sieved to 200 mesh (75 μm). The setting time of pure clinker was controlled by the retardation effect of superplasticizer
(Yu et al. [13] suggest a complexation of Ca2+ ions by the
superplasticizer). Silica fume (MS), Elkem 920 U, basaltic iller (FB) and nano-silica (nS), Cembinder 8 Akzo Nobel, were also employed as raw materials. Four basaltic sand fractions were utilized as aggregates: 75-150 μm, 150-300 μm, 150-300-600 μm and 600-1200 μm, a combination of 25 wt% of each fraction was used for formulation of concrete. Polycarboxylic acid (PC), Basf Adva 505, was employed as dispersant additive. The chemical composition of raw materials was measured on molten samples, using luorescence spectrometer PANalytical Axios Advanced; the speciic surface area (SSA) was measured by gas adsorption (BET method) using Belsorp Max equipment; the real density was determined according to [17]. Density of nano-silica was calculated from density and mass concentration of suspension, 1.4 g/cm3 and 50%, respectively, resulting in
2.33 g/cm3. Particle size distribution (PSD) of pure clinker,
basaltic iller and silica-fume were determined using a laser granulometer Malvern 2200. Particle size distribution of nano-silica (nS), Cembinder W8, was measured by dynamic laser scattering (DLS), using Microtac Nano-Flex. Mineralogical composition of pure clinker and basaltic iller was obtained by X-ray diffraction (XRD) from pressed samples, using Philips MPD1880 and X’pert PRO MPD X-ray diffractometers, respectively (CuKα, 40 kV, 30 mA, 2θ 5-70°, 0.2 o/s).
Two initial particle size distributions were employed as references mixtures, containing 10 and 20% of silica fume (MS) and called M01 and M02. Considering the powder as the sum of pure clinker (CP), silica fume (MS), basaltic iller (FB), and nano-silica (nS), the water/powder (w/p) ratio was ixed at 0.27. The matrix:aggregates (M:A) ratio was also maintained ixed at 1:1, and dispersant content was ixed at
Table I - Compositions (wt%) of ultra-high strength concrete mixtures.
[Tabela I - Composições (% em massa) das misturas dos concretos de ultra alta resistência.]
Mixture CP (%) FB (%) MS (%) nS (%) w/p PC (%) M:A
M01 75.0 15.0 10.0 0.0 0.27 1.6 1:1
M01+0.3nS 74.7 15.0 10.0 0.3 0.27 1.6 1:1
M01+0.6nS 74.4 15.0 10.0 0.6 0.27 1.6 1:1
M01+1.2nS 73.8 15.0 10.0 1.2 0.27 1.6 1:1
M01+2.5nS 72.5 15.0 10.0 2.5 0.27 1.6 1:1
M01+5.0nS 70.0 15.0 10.0 5.0 0.27 1.6 1:1
M01+10.0nS 65.0 15.0 10.0 10.0 0.27 1.6 1:1
M02 75.0 5.0 20.0 0.0 0.27 1.6 1:1
M02+0.3nS 74.7 5.0 20.0 0.3 0.27 1.6 1:1
M02+0.6nS 74.4 5.0 20.0 0.6 0.27 1.6 1:1
M02+1.2nS 73.8 5.0 20.0 1.2 0.27 1.6 1:1
M02+2.5nS 72.5 5.0 20.0 2.5 0.27 1.6 1:1
M02+5.0nS 70.0 5.0 20.0 5.0 0.27 1.6 1:1
1.6 wt% of total powder mass (CP+MS+FB+nS). All studied mixtures are described in Table I. Dispersant and suspension of nano-silica were previously diluted with deionized water. Powders were homogenized in plastic bags. Concrete mixing was conducted in a laboratory mixer applying the following steps: i) dry powder was added to the recipient and mixed at 586 rpm during 60 s; ii) 2/3 of the suspension (water + dispersant + nano-silica) was added and mixed at 586 rpm during 120 s; iii) 1/3 of the suspension (water + dispersant + nano-silica) was mixed at 60 rpm during 120 s.
Six cylindrical (2:4 cm) and three prismatic (2:2:10 cm) specimens were molded by casting using an acrylic mold. Manual compaction was applied in order to avoid casting defects.Firstly, only compressive strength of mixture series M01, containing 10% of silica fume, was evaluated in order to understand the effect of nano-silica on this mechanical property. At the second step, mixture series M02, containing 20% of silica fume, was evaluated in order to analyze the effect of nano-silica on compressive and lexural strengths, and dynamic elastic modulus. This procedure was taken, because there was no enough material available to study all mechanical properties for both series of mixtures. In order to avoid the variability in results, due to the chemical and physical properties of the raw materials, the specimens were obtained in a single batch. Initial curing was conducted at room temperature (22 °C) during 24 h, and then for
18 h under a vapor source at 90 °C. Compressive and
lexural strengths [18] were measured using a universal testing machine applying 2.5 and 1.25 MPa/s stress rate, respectively. Dynamic Young’s modulus, density and water absorption were determined according to standard procedures [19, 20]. Pore size distribution of mixtures was measured by mercury intrusion porosimetry, using a Micrometrics PoreSizer (contact angle of 140°). Samples
were milled and sieved to 200 mesh (75 μm). Powder of pure alumina (Al2O3) was introduced in a ratio of 1:9, as
an internal standard. XRD pattern of randomly oriented sample was obtained using a Philips MPD1880 X-ray diffractometer (CuKα, 40 kV, 30 mA, 2θ 10-70°, 0.2 °/s, 50 s/step) [21, 22]. Thermogravimetric analysis was carried from 100 to 900 °C at 10 °C/min, and 20 mg of samples were tested using an alumina crucible under a nitrogen lux of 20 mL/min [23]. Microstructure of samples was analyzed by scanning electron microscope (SEM) coupled with an energy dispersive spectrometer (EDS) using Quanta 600 FEI-Philips equipment; carbon coating was applied on specimen surface for this analysis.
RESULTS AND DISCUSSION
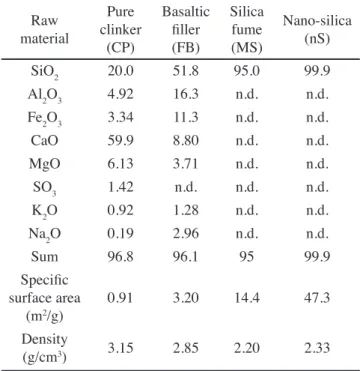
Table II shows chemical compositions and physical properties of the raw materials. Fig. 1a shows the XRD pattern of pure clinker (CP), which shows the principal phases of clinker: alite (3CaO.SiO2), belite (2CaO.SiO2),
tricalcium aluminate (3CaO.Al2O3) and tetracalcium
ferroaluminate (4CaO.Al2O3.Fe2O3) [21-23]. CP did not
present peaks of calcium hydroxide Ca(OH)2, calcium
carbonate (CaCO3), gypsum or etringite. Fig. 1b shows
the XRD pattern of basaltic iller (FB), the principal phases of basaltic rocks were identiied on sample: albite [Na(AlSi3O8)] [24, 25], anorthite [Ca(Al2Si2O8)] [26, 27],
labradorite [Ca,Na(Al2SiO3O8)] [28], and augite [(Ca,Na)
(Mg,Fe2+,Al,Fe3+,Ti)(Si,Al)
2O6] [29].
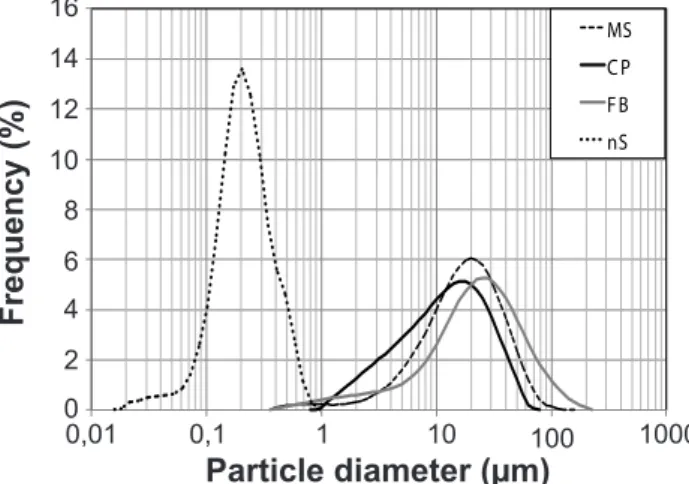
Fig. 2 shows particle size distribution curves of raw materials; pure clinker (CP) presented part of particles coarser than 10 μm and a secondary population of particles varying from 1 to 10 μm. Basaltic iller (FB) presented the coarsest particle size distribution as compared with the others raw materials, but a considerable quantity of particles smaller than 1 μm could be observed. Particle size distribution of silica fume (MS) presented a small quantity of particles iner than 1 μm. Nano-silica (nS) particle size distribution contained the larger amount of particles varying from 0.1 to 1 μm, and a representative volume of particles iner than 100 nm.
Fig. 3a shows the effect of nano-silica (nS) on compressive strength of all studied mixtures. For both mixtures series, M01 and M02, a maximum compressive strength was achieved for 0.6 wt% of nano-silica, a considerable decrease on compressive strength could be veriied for quantities higher than 2.5 wt% of nano-silica. Fig. 3b presents the effect of nano-silica (nS) on lexural strength and dynamic elastic modulus of mixtures of series M02, and a similar tendency of optimum content of nano-silica was achieved for 0.6 and 1.2 wt%, respectively. Compression or lexural strengths are directly related with elastic modulus, but a difference was observed between the optimum content of nano-silica for elastic modulus and compressive or lexural
Raw material
Pure clinker
(CP)
Basaltic iller (FB)
Silica fume (MS)
Nano-silica (nS)
SiO2 20.0 51.8 95.0 99.9
Al2O3 4.92 16.3 n.d. n.d.
Fe2O3 3.34 11.3 n.d. n.d.
CaO 59.9 8.80 n.d. n.d.
MgO 6.13 3.71 n.d. n.d.
SO3 1.42 n.d. n.d. n.d.
K2O 0.92 1.28 n.d. n.d.
Na2O 0.19 2.96 n.d. n.d.
Sum 96.8 96.1 95 99.9
Speciic surface area
(m2/g)
0.91 3.20 14.4 47.3
Density
(g/cm3) 3.15 2.85 2.20 2.33
Table II - Chemical composition (wt%) and physical properties of raw materials.
strengths, possibly due to the precision and variability on measurements.
Fig. 4 presents the XRD patterns of mixtures M01+0.3nS and M02+0.6nS, continuous and dashed lines, respectively. No signiicant difference on main peaks of pure alumina (internal standard) were identiied at 2q of 35.19° and 43.38° [22]. Different peak intensities were measured,
and the sample containing larger amount of basaltic iller (BF) had stronger albite’s main peak at 2θ of 27.87° [24, 25]. Mixture M02+0.6nS presented a higher quantity of amorphous phase, related to silica fume and C-S-H phase, and observed by pattern baseline. For both studied mixtures, alite/belite (C3S/C2S) main peak at 2θ of 32.33° presented similar values [22, 23].
Fig. 5 shows thermogravimetric curves of samples M01+0.3nS and M02+0.6nS, mass loss was calculated considering the calcined weight at 900 °C. The content of chemically bonded water of calcium silicates and aluminates hydrates measured at 400 °C, difference between mass loss at 100 and 400 °C, was 2.38% (=4.47%-2.09%) and
Figure 3: Effect of nano-silica (nS) content on: (a) compressive strength (fc) of mixtures of series M01 and M02; and (b) dynamic elastic modulus (Ed) and lexural strength (ft) of mixtures of series M02.
[Figura 3: Efeito do teor de nanossílica na: (a) resistência à
compressão (fc) das misturas M01 e M02; e (b) no módulo de elasticidade dinâmico (Ed) e resistência à tração na lexão (ft) da
série de mistura M02.]
Figure 1: X-ray diffraction patterns of: (a) pure clinker: C3S - alite
(3CaO.SiO2); C2S - belite (2CaO.SiO2); C3A - tricalcium aluminate (3CaO.Al2O3); C4AF - tetracalcium ferroaluminate (4CaO.Al2O3. Fe2O3); and (b) basaltic iller: albite [Na(AlSi3O8)]; anorthite [Ca(Al2Si2O8)]; augite [(Ca,Na)(Mg,Fe2+,Al,Fe3+,Ti)(Si,Al)
2O6];
labradorite [Ca,Na(Al2SiO3O8)].
[Figura 1: Difratogramas de raios X do: (a) clínquer puro; e (b) iller de basalto.]
0 200 400 600 800 1000 1200 1400 1600 1800 C 3S C 2S C 3A C 4AF 5 1800 1400 1600 1200 1000 800 400 600 200 0
10 15 20 25 30 35 4045 50 55 60 65 70
2q (degree)
In te ns ity (c ou nts /s ) 0 50 100 150 200 250 Albite Anorthite Augite L abradorite 5 250 150 200 100 50 0
10 15 20 25 30 35 40 45 50 5560 65 70
2q (degree)
In te ns ity (c ou nts /s ) a) b)
Figure 2: Particle size distribution curves of raw materials. [Figura 2: Curvas de distribuição granulométrica das matérias-primas.] 0 2 4 6 8 10 12 14 16 MS C P FB nS 0,01
Particle diameter (µm)
F re q u e n c y (% ) 16 8 12 4 14 6 10 2 0
0,1 1 10 100 1000
y = 102,37x-0,066
R ² = 0,89954 y = 8,5958x + 100,73
R ² = 0,85082
y = 18,147x + 109,94 R ² = 0,91434
y = 118,68x-0,078
R ² = 0,92965
85 90 95 100 105 120 125
M01 M02
125 105 115 95 85 0
Content of nano-silica (wt%)
C o m p re s s iv e s tr e n g th (MPa ) 3 6
1 2 4 5 7 8 9 10
120 100 110 90 a) 36.12 38.16 37.61 36.74 11.74 11.72 11.24 36 37 38 39 0 39 11,8 11,7 11,6 11,5 11,4 11,3 11,2 38 37 36
Content of nano-silica (wt%)
D y n a m ic e la s ti c m o d u lu s (G Pa ) F le x u ra l s tr e n g th (MPa ) 3
1 2 4 5
3.14% (=4.99%-1.85%) for mixtures M01+0.3nS and M02+0.6nS, respectively, which is mainly related with the pozzolanic reaction, showing higher value for mixture
Figure 7: SEM micrograph of sample M01+0.3nS (a) and EDS spectra of point 4 (b) and point 5 (c), indicated in (a).
[Figura 7: Micrograia obtida por microscopia eletrônica de
varredura da amostra M01+0.3nS (a) e espectros de EDS do ponto
4 (b) e ponto 5 (c) indicados em (a).] Figure 4: X-ray diffraction patterns of mixtures M01+0.3nS
(continuous line) and M02+0.6nS (dashed line).
[Figura 4: Difratogramas de raios X das misturas M01+0.3nS (linha contínua) e M02+0.6nS (linha tracejada).]
Al2O3
Albite
C 3S/C 2S
1400
1200
1000
800
400 600
200
30
20 40
15 25 35 45
2q (degree)
In
te
ns
ity
(c
ou
nts
/s
)
Figure 5: Thermogravimetric curves of mixtures M01+0.3nS and M02+0.6nS.
[Figura 5: Curvas termogravimétricas das misturas M01+0.3nS e M02+0.6nS.]
4,99
2,43
1,85
0,81
47
2,65
2,09
0,92
M 02 - 0.62 nS M 01 - 0.31nS
5
4 4,47
3
2
0 1
100 200 300 400 500 600 700 800 900
Temperature ( ºC)
Ma
s
s
(%
)
M02 - 0.6nS
M01 - 0.3nS
Figure 6: Pore size distribution curves of mixtures M01+0.3nS and M02+0.6nS.
[Figura 6: Curvas de distribuição de tamanho de poros das misturas M01+0.3nS e M02+0.6nS.]
0,48 2,81 5,55
10,04
0,74 0,79
9,13
10,34 M 1 - 0.31nS
M 2 - 0,62 nS
5 10 11
4 9
3 8
2 7
0 1 6
1 100 1000 10000 100000 1000000 10000000
Poro diamenter (nm)
Po
ro
s
ity
(%
)
M02 - 0.6nS
M01 - 0.3nS
140
120
100
80
60
40
20
0 1
Energy (keV)
5
3 1
2 4 6 8 9
0 30 60
10 40 70
20 50 80 90
1
Energy (keV)
5
3 1
2 4 6 8 9
b)
a)
c)
In
te
n
s
ity
(c
p
s
)
In
te
n
s
ity
(c
p
s
containing more silica fume (MS). Mass loss at 600 °C, representing the chemically bonded water of calcium hydroxide, was 1.17% and 1.04% for mixtures M01+0.3nS and M02+0.6nS, respectively. The low content of calcium hydroxide suggested a considerable consume of portlandite from pozzolanic reaction, for both mixtures. The calcium carbonate present in the sample had a mass loss between 600 and 900 °C, which was 0.92% and 0.81% for mixtures
M01+0.3nS and M02+0.6nS, respectively [23]. A difference of about 10% on hydration products was observed between the evaluated mixtures, proportional to the amount of added silica fume (MS).
Fig. 6 presents the pore size distributions of mixtures M01+0.3nS and M02+0.6nS. The results indicated a low volume of pores coarser than 1 μm, 0.48% and 0.74%, respectively. For pore sizes ranging from 0.1 to 1 μm, the mixture M01+0.3nS presented a considerable increase on pore volume as compared with M02+0.6nS, 2.81% and 0.79%, respectively. For pores varying between 0.1 and 0.01 μm, results showed a pore reinement, M02+0.6nS presented its most representative volume of pores on this interval 9.13%, and 5.55% for mixture M01+0.3nS. The mixtures M01+0.3nS and M02+0.6nS presented similar values of open porosity (P0), 10.04% and 10.34%, respectively. When the amount of silica fume changed from 10 to 20%, the control mixture of granular structure also changed. A gapped pore size distribution revealed this, due to the predominance of pores smaller than 0.1 μm for mixture M02+0.6nS. As a consequence, the reduction of capillary pores (>0.1 μm) leaded to an improvement on mechanical performance for mixtures containing 20% of silica fume (MS). As content of nano-silica or amorphous material increased, nucleation and pozzolanic effect were more effective, but incorporated air and consequently porosity also increased, as seen on Table III. Optimum content of nano-silica could be obtained when the positive effect of hydration products was balanced by the negative effect of porosity [13].
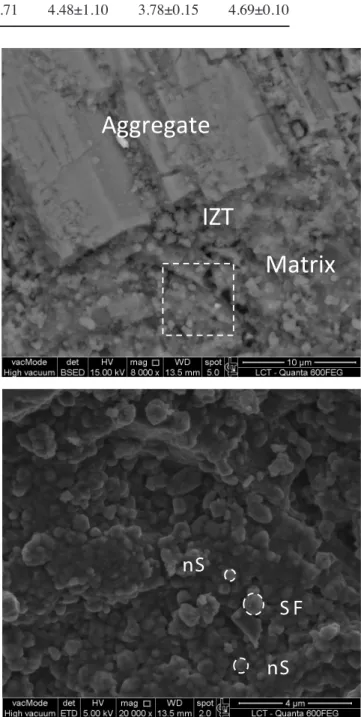
Fig. 7a presents a SEM micrograph of sample M01+0.3nS, showing a coarse basalt particle immersed in a cementitious matrix. Fig. 7b presents the obtained EDS spectrum from point 4 (indicated in Fig. 7a), which show the predominant peak of Si and secondary peaks of Al, Fe, Ca and Mg present on basaltic iller (Table II). Fig. 7c presents the obtained EDS spectrum from point 5, which shows the main peak of Ca for cement matrix, and secondary peaks of Si and Al. Interface zone transition (IZT) was not veriied,
Mixture 0.6nS 1.2nS 2.5nS 5.0nS 10.0nS
Bulk density (g/cm3) 2.28±0.02 2.30±0.03 2.25±0.04 2.26±0.01 2.17±0.01
Speciic gravity (g/cm3) 2.86 2.86 2.85 2.83 2.81
Apparent porosity (%) 20.19 19.45 20.84 20.38 22.55
Water absorption (%) 4.22±0.08 3.02±0.71 4.48±1.10 3.78±0.15 4.69±0.10
Figure 8: SEM micrographs of sample M01+0.3nS showing: (a) interface between the matrix and an aggregate with no presence of an interface zone transition (IZT); and (b) detail of the matrix with particles of nano-silica (nS) and silica fume (SF).
[Figura 8: Micrograias obtidas por microscopia eletrônica de varredura da amostra M01+0.3nS mostrando: (a) interface entre a matriz e um agregado sem formação de uma transição de zona interfacial (IZT); e (b) detalhe da matriz com partículas de nanossílica (nS) e microssílica (SF).]
Aggregate
Matrix
IZT
S F
nS
nS
Table III - Bulk density, speciic gravity, apparent porosity and water absorption of mixtures of series M02.
[Tabela III - Densidade aparente, densidade aparente da parte sólida, porosidade aparente e absorção de
as shown in Fig. 8a. Fig. 8b shows enlarged image of the dashed region indicated in Fig. 8a; the matrix had a dense microstructure constituted mainly by silica fume (SF) and nano-silica (nS) spherical particles. SEM and EDS analyzes of the sample M02+0.6nS showed similar characteristics, with the predominant peaks of Si for aggregate and Ca for cement matrix, and with no formation of the interface zone transition (IZT); however, the presence of small portlandite crystals were observed (Fig. 9).
CONCLUSIONS
For both series, M01 and M02 (containing 10 and 20% of silica fume, respectively), an increasing tendency on compressive strength was obtained for low content of nano-silica, reaching an optimum value of nano-silica of 0.62 wt%. For concretes with nano-silica content higher than 2.5 wt%, compressive strength presented values lower than mixture without nanoparticles. It was concluded that nano-silica present a positive effect for a low content addition, and a negative effect on mechanical properties for large quantities of nano-particles. The porosity of material was affected by nano-silica, and an increasing tendency could be observed as function of nano-silica amount. The content of amorphous silica affected the pozzolanic reaction; an increasing amount of hydration products as a function of micro-silica content was observed. The interface transition zone around the aggregate was not identiied and a densiication was obtained through the use of nano-silica. It was concluded that packing effect and pozzolanic reaction of nano-silica are
the main microstructural aspects related with the mechanical performance of mixtures containing nanoparticles.
ACKNOWLEDGEMENTS
For Fundação Araucária de Apoio Desenvolvimento Cientíico e Tecnológico do Paraná; Laboratório de Caracterização Tecnológica da Escola Politécnica da Universidade de São Paulo LCT/USP; Laboratório de Microestrutura da Escola Politécnica da Universidade de São Paulo LME/USP; Laboratório de Nanotecnologia Aplicada aos Materiais de Construção - Nanotech ECV/UFSC; Laboratório de Física Nuclear Aplicada da Universidade Estadual de Londrina UEL.
REFERENCES
[1] A. Korpa, R. Trettin, in “Ultra high performance
concrete”, M. Schmidt, E. Fehling, C. Geisenhansluke
(Eds.), Kassel Univ., Kassel (2004) 155-164.
[2] G. Shakhmenko, A. Korjakins, P.J.J. Kara, J. Justs, I. Juhnevica, in 3rd Int. Symp. UHPC and Nanomaterials for Ultra High Performance Construction Materials, Kassel Univ., Kassel (2012) 79-86.
[3] E. Ghafari, H. Costa, E. Julio, A. Portugal, L. Durães, in 3rd Int. Symp. UHPC and Nanomaterials for Ultra High Performance Construction Materials, Kassel Univ., Kassel (2012) 71-78.
[4] M. Dham, T. Rushing, R. Helferich, T. Marth, S. Sengupta, R. Revur, C. Weiss, T. Cummins, J. Transp. Res. Board 2142 (2010) 18-24.
[5] T. Kowald, in “Ultra High Performance Concrete”, M. Schmidt, E. Fehling, C. Geisenhansluke (Eds.), Kassel Univ., Kassel (2004) 195-202.
[6] K. Wille, K. Loh, J. Transp. Res. Board 2146 (2010)
119-126.
[7] Z. Wu, C. Shi, K.H. Khayat, S. Wa, Cem. Concr. Comp.
70 (2016) 24-34.
[8] M. Gesoglu, E. Guneyisi, D.S. Assad, G.F. Muhyddin, Constr. Build. Mater. 102 (2016) 706-713.
[9] M. Bastami, M. Baghbadrani, F. Aslani, Constr. Build. Mater. 68 (2014) 402-408.
[10] M. Amin, C.A. el-Hassan, Constr. Build. Mater. 80
(2015) 116-124.
[11] E. Ghafari, H. Costa, E. Julio, A. Portugal, L. Durões, Mater. Design 59 (2014) 1-9.
[12] Z. Rong, W. Sun, H. Xiao, G. Jiang, Cem. Concr. Comp.
56 (2015) 25-31.
[13] R. Yu, P. Spiesz, H.J.H. Brouwers, Constr. Build. Mater.
65 (2014) 140-150.
[14] Y. Qing, Z. Zhang, K. Deye, C. Rongshen, Constr. Build. Mater. 21 (2007) 539-545.
[15] A.M. Said, M.S. Zeidan, M.T. Bassuoni, Y. Tian, Constr. Build. Mater. 36 (2012) 838-844.
[16] A.N. Saloma, I. Iswandi, A. Mikrajuddin, Int. J. Civil Environ. Eng. 13, 3 (2013) 15-19.
[17] Assoc. Bras. Nor. Técn., NBR 9776 , “Agregados - Figure 9: SEM micrograph of sample M02+0.6nS showing small
portlandite crystals (CH - calcium hydroxide) in the matrix near an aggregate.
[Figura 9: Micrograia obtida por microscopia eletrônica de varredura da amostra M02+0.6nS mostrando pequenos cristais de portlandita (CH - hidróxido de cálcio) na matriz próximos a um agregado.]
determinação da massa especíica de agregados miúdos por meio do frasco Chapman - método de ensaio” (1987) 1-3. [18] Am. Soc. Test. Mater., “Flexural properties of ceramic whiteware materials”, C674.
[19] Am. Soc. Test. Mater., “Standard test method for dynamic young´s modulus, shear modulus, and poisson´s ratio by impulse excitation of vibration”, E1876 (2009). [20] Am. Soc. Test. Mater., “Water absorption, bulk density, apparent porosity, and speciic gravity of ired whiteware products”, C373 (1972).
[21] Am. Soc. Test. Mater., “Standard method for determination of the proportion on phases in portland cement and portland-cement clinker using powder diffraction analysis”, C1365 (2011).
[22] L.A. Gobbo, “Aplicação da difração de raios X e
método de Rietveld no estudo do cimento Portland”, Tese Dr., Univ. S. Paulo, S. Paulo (2009) 251.
[23] H.F.W. Taylor, Cement chemistry, Academic Press, London (1990) 451.
[24] G.E. Harlow, Am. Mineral. 67 (1982) 975-996.
[25]M.D. Benusa, R.J. Angel, N.L. Ross, Am. Mineral. 90
(2005) 1115-1120.
[26] J. Wainwright, J. Starkey, Z. Kristallogr. 133 (1971)
75-84.
[27] R.J. Angel, M.A. Carpenter, L.W. Finger, Am. Mineral.
75 (1990) 150-162.
[28] H.R. Wenk, W. Joswig, T. Tagai, M. Korekawa, B.K. Smith, Am. Mineral. 65 (1980) 81-95.