Mechanical and Morphological Characterization of Polypropylene
Toughened with Olefinic Elastomer
Cybele Lotti, Carlos A. Correa, Sebastião V. Canevarolo*
Departamento de Engenharia de Materiais, Universidade Federal de São Carlos, São Carlos - SP, Brazil
Received: September 10, 1999 Revised: February 21, 2000
The effect of incorporating (C2-C8) ethylene-octene elastomer on the mechanical properties and morphology of polypropylene copolymers has been investigated employing two types of PP copolymer, with and without nucleating agent. The results were compared to the ones presented by a commercial PP heterophase (reactor impact modified PP/EPR). The addition of the elastomer increases the toughness of the blends but reduces their stiffness. PP blends in the low elastomer content region (< 20%) show low values of the Izod impact strength and both, elastomer content and impact strength, are directly proportional to the area under the β damping peak or its maximum intensity of the elastomer. The morphology is a continuous pattern of segregate elastomeric particles with average particle size in the range of 0.27 µm to 0.39 µm. The average particle size and particle size distribution plotted in log-normal distribution curves, increases slightly with the increase in the elastomer content. The reactor modified PP heterophase has a broader particle size distribution and an average particle size of 0.56 µm, at the lower limit but inside the range for good impact performance, as observed.
Keywords: toughened polypropylene, olefinic elastomer, impact strength, damping,
particle size distribution
1. Introduction
The improvement of toughness in plastics1-3 and in particular of isotactic polypropylene is a subject of great importance due to its inherent low impact strength, espe-cially in applications that involve sub ambient tempera-tures4-15.
Polypropylene can be toughened through incorporating low contents of ethylene during its copolymerization, re-sulting in random or block copolymers4,5 or by the in situ method, inside the reactor, where are formed dispersed elastomeric domains of ethylene-propylene elastomer (EPR) in a polypropylene matrix, called heterophase polypropylene. The most used industrial process is the incorporation of an elastomeric component 1, which alters the stress distribution in the matrix and contributes in the control of cracks’ propagation and termination. This is done by mechanical blending in the melt state with various types of elastomers, such as olefinic rubbers based on ethylene and propylene1,4. The use of this type of elastomers is very convenient due to the similarity in the chemical composi-tion, which can help the interfacial interaction and also its
competitive price5. Even having low interfacial adhesion6 these imiscible blends are widely used because they pro-duce enough toughening to meet the automobile industry requirements5.
The presence of rubber particles dispersed in a polypropylene matrix normally does not affect its crystal-linity, but they can act as nucleating agent of the matrix, reducing the size of the spherulites6-8. This is particularly
true in the case of PP/EPR blends (including EPDM), a semicrystalline polymer modified with rubber, in which the crystalline morphology is also expected to interfere in the toughening mechanisms, in order to justify the great in-crease in the impact strength shown by these blends. The use of olefin elastomers as impact modifiers of polypropylene in which the comonomer is changed from -propylene (C2-C3) to -butene (C2-C4) to -octene (C2-C8)
has shown to substantially increase impact and weldline strength, with advantage to the last9,10. Also one should consider that the presence of fewer tertiary hydrogen in these elastomers improve their thermal stability in compari-son to EPR’s11.
For PP, a semicrystalline matrix, the most effective particle size range for obtaining the best rubber toughening behaviour observed by various authors5-7,12-15 is sub-mi-cron in the range of 0.5 to 1.0 µm. The particle size of the elastomer significantly affects the deformation and failure processes being small particle favouring shear yielding while coarser dispersion promotes crazing7. The best aver-age particle size is still a matter of debate, in which very few authors have tried to set it, some saying to be at 0.3-0.35 µm13 or 0.4 µm7. Unexpectedly both cases are outside the total range mentioned earlier.
In this work we study the toughening behaviour of two random polypropylene copolymers, been one nucleated, blended with various quantities of an amorphous ethylene-octene elastomer, and compared them with an in situ po-lymerized EPR heterophase polypropylene via mechanical, dynamic-mechanical and morphological measurements.
2. Experimental
2.1. Sample preparation
The polymers used in this work are presented in Table 1. The pure materials and the blends were extra stabilised with 0,2% of Irganox® B-215 (Ciba Geigy).
Resin, elastomer pellets and the antioxidant were manu-ally mixed until a visumanu-ally good dispersion and then all formulations were processed in a interpenetrating co-rotat-ing twin screw extruder, Werner Pfleiderer ZSK 30, with screw rotation of 100 rpm, output of 5 kg/h, temperature profile of 170, 210, 220, 230, 230 and 220 °C and a medium/high shearing screw profile. Samples for the me-chanical test were moulded in an Aurburg 270V injection-moulding machine, with the mould kept at 50 °C.
2.2. Mechanical analysis
The tensile test was done at room temperature following the ASTM D-638 on injected samples of Type I at 50 mm/min. The flexural test followed the ASTM D-790 procedure B method I (three point bending) at 100 mm/min, measuring the secant modulus at 1% deformation. The Izod impact test was realised at -20 °C and at room temperatures
in notched specimens, following the standard ASTM D-256.
2.3. Thermal analysis
The dynamic-mechanical thermal analysis were, using a calibrated16 PL - MARK I equipment, were done at a frequency of 1 Hz, heating rate of 2 °C/minute in injection moulded bars. The area under the damping peak of the elastomer, at its glass transition temperature was calculated using suitable software.
2.4. Morphological analysis
Samples for transmission electron microscopy analysis were cryo-sectioned in an RMC ultramicrotome operated at -50 °C, with a diamond knife Diatome 45 degrees, floated in a 3:2 DMSO/H2O solution and collected in copper grids.
Initially the samples were stained using the two step method suggested by Kakugo and co-workers17. We also apply a physical staining method with aid of the Omega filter in the LEO912 EFTEM, an energy filtering device where inelas-tic scattering is removed from the global brightfield image (EBF mode), improving contrast in multiphase polymer systems18. After checking qualitatively and quantitatively stained and unstained samples and observing that we were getting the same data we decide for the simpler route and so all micrographs here are from unstained samples. Image analysis was done using the SigmaScanPro 3.0 software and the histograms of the distribution of particle diameters obtained from an average of 700 particles measured in each sample. The particle size results are regarded as apparent measurements as no stereological corrections have been done to account for specimen thickness. A simplified sta-tistical analysis were done using the Statistica for Windows 4.3 software fitting a log-normal distribution curve to the histograms and from that calculating the average particle size values.
3. Results and Discussions
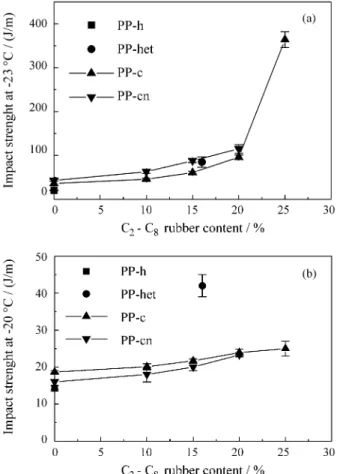
3.1. Izod impact strength
The increase in impact strength, measured at room temperature and at -20 °C, with the addition of elastomer
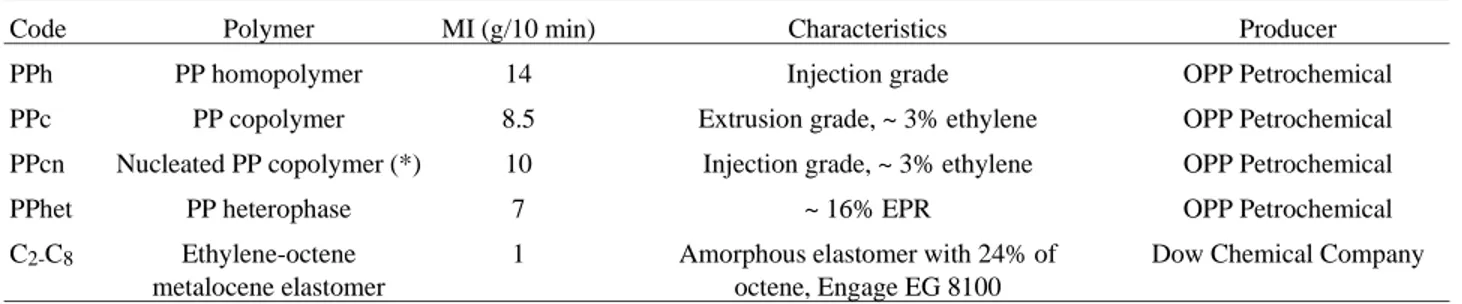
Table 1. Polymers used in this work and some of their characteristics.
Code Polymer MI (g/10 min) Characteristics Producer
PPh PP homopolymer 14 Injection grade OPP Petrochemical
PPc PP copolymer 8.5 Extrusion grade, ~ 3% ethylene OPP Petrochemical
PPcn Nucleated PP copolymer (*) 10 Injection grade, ~ 3% ethylene OPP Petrochemical
PPhet PP heterophase 7 ~ 16% EPR OPP Petrochemical
C2-C8 Ethylene-octene
metalocene elastomer
1 Amorphous elastomer with 24% of
octene, Engage EG 8100
Dow Chemical Company
in the copolymers can be observed at Fig. 1. The pure copolymers show impact strength superior to the homopo-lymer, due the presence of ethylene, which reduces the copolymer crystallinity and improves its toughness. The presence of the elastomer in the blends reasonably increases their impact strength at room temperature but for elastomer content above 20% there is a stronger toughening effect, in good agreement with data from Huneault et al.10. The heterophase polypropylene datum is in between the data for the blends with 15 and 20% of elastomer content. These observations are in good agreement with the characteristics of this compound, which has 16% of EPR phase19, dis-persed in a polypropylene homopolymer matrix. The pres-ence of the nucleating agent in one of the copolymers, PPcn, reduces the average spherulite size20, which tend to in-creases its impact strength in comparison with the unnu-cleated PPc6. Upon reducing the temperature the impact strength of the blends drops and the addition of up to 25% of elastomer has very little effect on the data. On the other hand the heterophase polypropylene datum remained nearly constant within the temperature range of testing. The lower brittle-ductile transition temperature for PP hetero-phase is related to differences in their morphology
(elas-tomer particle size and its distribution) which will be dis-cussed later.
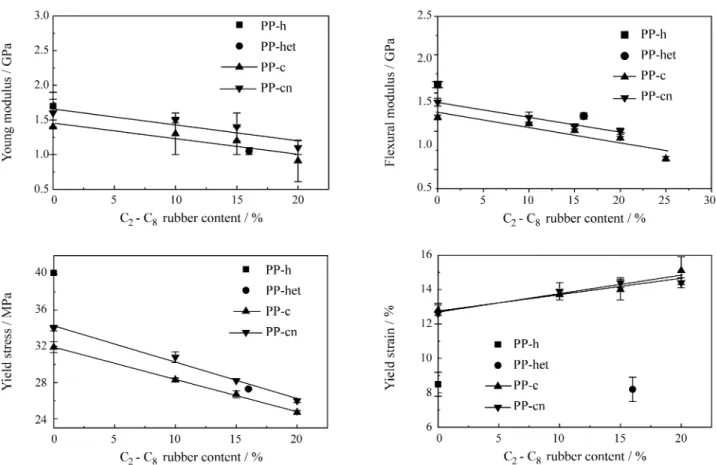
3.2. Tensile and flexural properties
The improvement in toughness (impact strength) when an elastomer is added to a polymeric matrix normally implies in a reduction of its stiffness, which is usually related to a decrease in Young’s and flexural moduli, yield stress and an increase in the yield strain. A balance between toughness and stiffness is always required for optimum performance of the rubber-toughened polymer. Figure 2 shows a series of mechanical properties of the toughened blends. The addition of the C2-C8 elastomer in the PP
copolymers, measured at room temperature, reduces their stiffness, with reduction in Young’s and flexural moduli, yield stress and an increase in the yield strain. PP copoly-mers tend to have lower stiffness and higher yield strain than homopolymers as the presence of the ethylene reduces the crystallinity and stress level to produce shear yielding6. Also the presence of the elastomer in the blends linearly reduces their stiffness because there is an associated reduc-tion in the effective cross-secreduc-tion area of the sample12. To get at room temperature impact strength above 100 J/m, by adding up to 20% elastomer, there is a drop from approx. 1.6 GPa (in the pure copolymer) to 1.0 GPa in the blend’s moduli. The heterophase polypropylene datum is in be-tween the data for the blends with 15 and 20% of elastomer content. The presence of the nucleating agent produce a finer spherulitic structure in the nucleated PPcn sample which tend to give higher stiffness values in relation to a non-nucleated sample PPc.
3.3. Dynamic-mechanical thermal analysis (DMTA)
In order to evaluate the influence of the elastomeric phase on the damping behaviour of the toughened blends, the tanδ curves were obtained as a function of temperature. Recently21-22 the relaxation at approximate -45 °C of the elastomers was referred as a β transition, which is normally related to the relaxation of side chains.Table 2 shows the Tg of all materials used.
The maximum intensity of the loss modulus and the damping peak in a specific transition is directly propor-tional to the volume fraction of the transition phase23. On
Table 2. Transition temperatures (β and Tg) of all the materials used.
Polymer β transition
(oC)
Tg (°C)
Polypropylene homopolymer 9
Polypropylene copolymer 4
C2-C8 elastomer -45
-elastomeric phase (EPR) of the polypropylene heterophase
-43
increasing the content of the elastomer, there is a linear increase in the maximum intensity of the peak. Also being a whole temperature relaxation spectrum the total loss area should contain the contribution of all structural groups present in the mer24. So it is expected that the area under
the loss modulus peak and the damping peak would also be proportional to the volume fraction of the phase that is going through a relaxation at that temperature. At the β peak we should expect the same thing i.e. its area and maximum intensity being proportional to the volumetric fraction of the side chains which in fact means proportionality to the volumetric fraction of the copolymer in the blend. The pure homopolymer PP show a very small peak at this tempera-ture which could be interpreted as contamination with other olefin monomers during industrial production. Figure 3 shows the maximum intensity and the area under the damp-ing peak at the β elastomer peak temperature plotted against elastomer content. The area was measured delimiting it between the adjoining minima, generally between -60 °C and -25 °C.
As expected the two variables increase linearly with increasing the elastomer content, being both capable of correlate the mechanical damping of the elastomer in the blends and its content. This conclusion could be general-ized and used to identify (qualitative analysis) and quantify
(quantitative analysis) the presence and content of a second phase in imiscible blends. The quantitative analysis of course will depend upon having the capability of producing a calibration curve. The intensity of the tan δ peak of the copolymer in blends with unnucleated PP matrix is higher than in nucleated PP, indicating a higher amorphous volu-metric fraction (lower crystallinity) and also a superior capacity of damping of this matrix at room temperature.
The matrix of the heterophase polypropylene shows its Tg quite near the Tg of the polypropylene homopolymer, but the intensity of its damping peak is between the ho-mopolymer and the pure copolymer. Also the intensity of the β damping peak of its elastomeric phase is intermediary to the blends with 15 and 20% of elastomer content. These observations are in good agreement with the characteristics of this compound, containing around 16% of EPR dispersed phase.
In order to directly relate the β damping peak of the elastomeric phase and the impact strength of the toughened blend Fig. 4 was plotted. There both, area under the β damping peak and its maximum intensity are compared with the impact strength of the blends measured at room temperature.
Blends showing low values of the area under the damping peak or similarly its maximum intensity (i.e. with low elastomer contents), have low values of impact strength, increasing rapidly with the increase of the elastomer con-tent. Wada and Kasahara25 correlated the notched impact strength of various plastics to the area under tanδ -tempera-ture curves. According to Karger-Kocsis and Kuleznev26 a linear relationship can be expected between notched impact strength and tanδ curves. In fact the relation is not linear because it is the sum of at least two separated events: first, the increase in the amount of elastomer and so the impact absorption levels (which was accounted for by Karger-Koc-sis26) and second, more important of them all, triggering the toughening mechanisms. The later is more sensitive to changes in morphology and interparticle distance27, the former is strongly related to the elastomer content. Because the DMTA measurements are directly related exclusively with the first event, on increasing the elastomer content, it soon becomes incapable to predict the behaviour of tough-ened polymers under impact conditions.
Figure 3. Maximum intensity at the β peak temperature and its area as a function of elastomer content for the copolymers and their blends.
Figure 4. (a) Area under the βdamping peak, and (b) its maximum intensity, as a function of the impact strength at room temperature.
Further, in the results of Fig. 4 again we can notice that
either the data of the intensity or area of the β damping peak of the PP heterophase is intermediary to the blends with 15 and 20% of elastomer content. The results of the pure homopolymer and copolymers indicate that having low levels of damping they cannot present significant impact strength. Quite similar results can be seen from impact strength values measured at -20 °C, as shown in Fig. 5. The impact strength of all pure polymers and their blends drops significantly but PP heterophase still maintain a high
im-pact strength, needing a morphological characterization to explain this behaviour.
3.4. Transmission Electron Microscopy (TEM)
The morphology of the pure PP copolymers, their blends and the PP heterophase was analysed qualitatively as micrographs and quantitatively as particle size distribu-tion curves. Figure 6 shows some of the micrographs and their respective particle size distribution curves in a form of histograms. Having plotted the particle size axe in a
linear scale the data were fitted with the best normal distri-bution curves.
Table 3 resumes the main statistical data in all cases. In one end of the scale we have the pure PP copolymer (used as matrix in the blends) showing a small amount of a second phase, segregated during the copolymerization, formed by ethylene-propylene copolymer chains (the number of par-ticles measured is small when compared with the blends). This second phase has also a small average particle size (0.23 µm) and narrow particle size distribution (σ = 0.15 µm). These values are well bellowing the critical range (0.5 µm to 1 µm) and being in small quantity are not effective in toughening the PP copolymer, which normally shows low value of impact strength. Its blends with the olefinic elastomer C2-C8 causes a major change in their morphology
and mechanical properties. The amount of the segregated second phase increases in correspondence with the increase of the elastomer content, increasing both the average parti-cle size and partiparti-cle size distribution. The blend with 25% of elastomer shows an average particle size of 0.39 µm and particle size distribution of σ= 0.22 µm. Even after increas-ing the average particle size they are still bellow the critical range. In the other end of the scale the PP heterophase shows an average particle size of 0.56 µm, inside the required range and reasonably wide particle size distribu-tion.
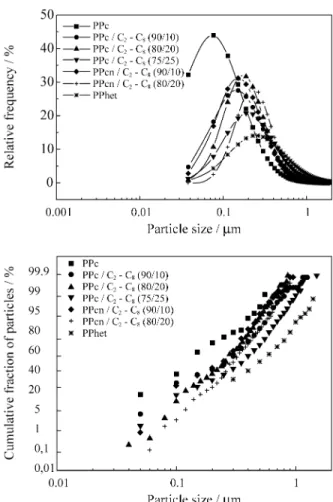
As suggested by Bordereau and co-workers28 the dis-persed phase size distribution is expected to follow a log-normal distribution curve when the particle size axe is plotted in a log scale. Figure 7a shows the best fitting lognormal curves of the particle size distribution for all samples including the pure PP copolymers, their blends and the PP heterophase. The increase in the average particle size and broadening the particle size distribution as blends con-tent increases is evident. Because the best range of particle sizes for toughening PP is between 0.5 µm to 1.0 µm visually one can judge that the PPhet would be the best choice among them for an application where toughening is needed. The morphology of the blends can still be adjusted,
changing the processing conditions (mainly screw configu-ration) shifting the particle size distribution curve to the required range. Figure 7b shows the same set of data presented as a statistical cumulative fraction of the parti-cles.
Table 3. Quantitative morphological analysis of PPc, PPcn and their blends with C2-C8.
Sample Average particle
size (µm)
Standard deviation (σ in µm)
Minimum particle size (µm)
Maximum particle size (µm)
Total n. of particles measured
PPc 0.23 0.15 0.03 0.66 173
PPc/C2-C8(90/10) 0.29 0.18 0.01 1.31 712
PPc/C2-C8(80/20) 0.27 0.14 0.01 0.87 819
PPc/C2-C8(75/25) 0.39 0.22 0.01 1.64 879
PPcn/C2-C8(90/10) 0.26 0.15 0.01 0.99 726
PPcn/C2-C8(80/20) 0.32 0.15 0.01 0.91 766
PPhet 0.56 0.34 0.02 1.53 238
One of the reasons for the small particle size obtained in all blends is the use of a too high shearing screw configu-ration during blending in the twin-screw extruder. The screw configuration was assembled with three distinctive zones of intense shearing given by three sets of kneading blocks which are known to be very effective in dispersing a second phase by reducing its average particle size28. We are at the moment working to correlate screw configura-tions and particle size distribution.
4. Conclusions
In the imiscible system consisted on PP/C2-C8
elas-tomer blends, the rubber phase separates from the matrix forming a continuous pattern of segregate particles. The addition of the elastomer increases the toughness of the blends but reduces their stiffness. PP blends in the low elastomer content region (< 20%) show low values of the Izod impact strength and both, elastomer content and im-pact strength, are directly proportional to the area under the β damping elastomer peak or its maximum intensity. Both variables, average particle size and particle size distribu-tion, plotted in lognormal distribution curves, increase with the increase in the elastomer content in all blends. Also these values are just bellow the required range probably due to the use of a high shearing screw configuration during mixing. The PP heterophase has broad particle size distri-bution and average particle size in the expected range for an application where toughening is needed.
Acknowledgements
The authors wish to thank CNPq (PRONEX), CAPES, FINEP and FAPESP for the financial support of Cybele Lotti (96/0368-0) and for financing the DMTA-PL.
References
1. Bucknall, C.B. Toughened Plastics, Appl. Sci. Publ., London, 1977.
2. Bucknall, C.B. Polymer Blends, Paul, D.R., Newman, eds., Academic, NY, v. 2, p. 91, 1978.
3. Riew, C.K. ed. Rubber-Toughened Plastics, Amer. Chem. Soc., 1989.
4. Mirabella-Jr, F. Polymer, v. 34, n. 8, p. 1729, 1993. 5. Petrovic, Z.; Budinski-Simendic, J.; Divjakovic, V.;
Skrbic, Z. J. Appl. Polym. Sci., v. 59, p. 301, 1996. 6. Jang, B.Z.; Uhlmann, D.R.; Vander Sande, J.B. J.
Appl. Polym. Sci., v. 30, p. 2485, 1985.
7. Chou, C.J.; Vijayan, K.; Kirby, D.; Hiltner, A.; Baer, E. J. Mat. Sci., v. 23, p. 2521 1988.
8. D’Orazio, L.; Mancarela, C.; Martuscelli, E.; Sticotti, G. J. Mat. Sci., v. 26, p. 4033, 1991.
9. Laughner, M.K.;Dibbern, J.A. Third Inter. Conf. Novi, Michigan, 1996.
10. Huneault, M.A.; Godfroy, P.; Lafleur, P.G. SPE RETEC proceeding, Boucherville, p. 235, Oct 9-10, 1997.
11. Dow Chemical Co. “ Application of INSITE technol-ogy in the rubber/elastomer market”, SPO’95, 111-123, 1995.
12. Jancar, J.; Di Anselmo, A.; Di Benedetto, A.T.; Kucera, J. Polymer, v. 34, n. 8, p. 1684, 1993. 13. D’Orazio, L.; Mancarela, C.; Martuscelli, E.; Sticotti,
G.; Massari, P. Polymer, v. 34, n. 17, p. 3671, 1993. 14. Dharmarajan, N.R.; Yu, T.C. Plast. Eng. 52, v. 8, p.
33, 1996.
15. Stehling, F.C.; Huff, T.; Speed, C.S.; Wissler, G.J. J. Appl. Polym. Sci. v. 26, p. 2693, 1981.
16. Lotti, C.; Canevarolo, S.V. Polym. Test. v. 17, p. 523, 1998.
17. Kakugo, M.; Sadatoshi, H.; Yokoyama, M. J. Polym. Sci. Part C, Polym. Lett., v. 24, p. 171, 1986. 18. Correa, C.A.; Hage Jr., E. Polym. Comm, v. 40, p.
2171, 1999.
19. OPP Petroquímica S.A. private communication. 20. Zhang, R.; Zheng, H.; Lou, X.; Ma, D. J. Appl. Polym.
Sci., v. 51, p. 51, 1994.
21. Stark, P. Polymer Bulletin. v.33, n.3, p. 339, 1997. 22. Simanke, A.G.; Galland, G.B., Freitas, L.; da Jornada,
J.A.H.; Quijada, R.; Mauler, R.S. Polymer, v. 40, p. 5489, 1999
23. Pukanszky, B.; Fortelny, I.; Kovar, J.; Tudos, F. Plast. Rubb. Comp. Proc. Appl., v. 15, n. 1, p. 31, 1991. 24. Wetton, R.E. Develop. Polym. Charact., Chap. 5,
Appl. Sci. Publ., 1986.
25. Wada, Y.; Kasahara, T. J. Polym. Sci., v. 11, p. 1661, 1967.
26. Karger-Kocsis, J.; Kuleznev, V.N. Polymer, v. 23, p. 699, 1982.
27. Wu, S. Polym. Eng. Sci., v. 30, n. 13, p. 753, 1990. 28. Bordereau, V.; Shi, Z.H.; Utracki, L.A.; Sammut, P.;