INTRODUCTION
Scandia-stabilised zirconia (SSZ) is probably the most promising material to be used as an electrolyte for intermediate temperatures due to its high ionic conductivity, stability under reducing and oxidising atmospheres and low electronic conductivity. The ionic conductivity of SSZ is three time higher than 8YSZ, at 800 °C, which enables SSZ to work at lower temperatures [1-4]. The degradation of conductivity is likely to occur due to a change in the nanostructure of the system [5-7]. This means that a change in the defect structure and nearest environment of the ions occurs. Zhang et al. [8] state that there are four possible microstructural changes, which are responsible for the decrease in conductivity of doped zirconia electrolytes caused by ageing: (1) precipitation of long range ordered phases; (2) formation and precipitation of tetragonal phase in the cubic grains; (3) segregation of dopant-rich layer near
grain boundaries and triple points and (4) trapping of oxygen vacancies ( ) towards dopant cations with time due to the Coulombic force, short range ordering of oxygen vacancies. In point (2) the formation and precipitation occur as a result of “growing” of the metastable tetragonal (t or t’) or cubic phase in the ZrO2-Y2O3 system and the t’-phase in the ZrO2
-Sc2O3 system into low-dopant tetragonal and dopant-rich
cubic phases [7, 9, 10]. Phase transformation of the zirconia electrolytes can be caused, not only by the type of dopants and dopant concentrations, but also by ageing.
EXPERIMENTAL
The powders were prepared by a sol–gel combustion method [12]. Scandia powders (TTE Metals, 99.9% purity) were dissolved in nitric acid (Fisher Scientiic, 70%) and hydrogen peroxide (Fisher Scientiic, N30% wv). Separately, cerium (III) nitrate hexahydrate (Aldrich, 99% purity),
Abstract
The conductivity behaviour of the (CexY0.2-x)Sc0.6Zr3.2O8-d (0 ≤ x ≤ 0.2) system and composition Ce0.04Y0.02Sc0.67Zr3.27O7.66 have been
investigated as function of time using impedance spectroscopy. All samples were prepared by sol-gel and combustion process, sintered at 1500 °C for 12 h and the densities obtained were between 92 and 97%. The electrical measurements were performed at 600 °C. The conductivity values were fairly stable during the irst 1800 h of the experiment but after this time the conductivity decreases. For some compositions of the system a semi-circle is detected through time, with capacitance values of an order of magnitude lower, 10-8 F/cm.
This semi-circle becomes well deined with time. After the experiment, SEM pictures show that grain boundary is well deined and an increase of pore inside grains, in some cases the surface is damaged showing cracks and issures indicating microstructure deterioration.
Keywords: scandia-zirconia, ac impedance, ageing.
Resumo
O comportamento da condutividade do sistema (CexY0,2-x)Sc0,6Zr3,2O8-d (0 ≤ x ≤ 0,2) e da composição Ce0,04Y0,02Sc0,67Zr3,27O7,66, foi
investigado em função do tempo usando espectroscopia de impedância. Todas as amostras foram preparadas pelo processo de sol gel e combustão combinados, sinterizadas a 1500 ºC durante 12 h e as densidades obtidas estão entre 92 e 97%. Esta experiência foi executada a 600 °C. Os valores da condutividade apresentaram-se relativamente estáveis durante as primeiras 1800 h da experiência
mas depois deste tempo de funcionamento a condutividade decresceu. Para algumas composições do sistema um semi-circulo apareceu ao longo do tempo, com valores de capacidade com ordem de grandeza 10-8 F/cm. Estes semi-círculos tornam-se melhor deinidos com
o tempo. Depois desta experiência as micrograias de microscopia eletrônica de varredura destas amostras mostram que a fronteira de grão é bem deinida e que ocorreu um aumento de porosidade, e em algumas amostras a superfície icou daniicada mostrando issuras e trincas na superfície indicando deterioração na microestrutura.
Palavras-chave: zircônia-escândia, impedância ac, envelhecimento.
Characterisation of conductivity of the (Ce
xY
0.2−x)Sc
0.6Zr
3.2O
8−δ(0 ≤ x ≤ 0.2)
system and composition Ce
0.04Y
0.02Sc
0.67Zr
3.27O
7.66as function of time
(Caracterização da condutividade do sistema (Ce
xY
0,2−x)Sc
0,6Zr
3,2O
8−δ(0 ≤ x ≤ )
e da composição Ce
0,04Y
0,02Sc
0,67Zr
3,27O
7,66em função do tempo)
E. de Carvalho, J. T. S Irvine
yttrium nitrate hexahydrate (Aldrich, 99.9%) and zirconia acetylacetonate (IV) (Aldrich, 98% purity) were dissolved in distilled water. The irst solution was added to the second; after the two solutions were mixed, glycine was introduced. Ammonia was introduced until the pH was approximately 6. The temperature was increased to 150 °C and maintained constant until the gel was formed. After formation of the gel the temperature was increased to 270 °C, so that the gel burned off. The powders were calcined for 3 h at 400 °C with a heating ramp of 1 °C/min. After rapidly cooling down to room temperature, the powder was ground. The crystal structure of the calcined powders was veriied by XRD, using a Phillips diffractometer (20–90 2θ, step size 90 0.02°, 2θ, Cukα radiation). The zirconia powders were milled using a Fritsch Planetary Ball Mill “pulverisette 7” with zirconia containers and zirconia balls on a suspension in acetone and triton QS-44 (phosphate ester, acid form, Sigma Chemical) 4% of powder weight. Dried powders were pressed uniaxially at 75 MPa and isostatically at 200 MPa into pellets with a diameter of 13 mm and thickness of 0.6–1.0 mm. The pellets were sintered at 1500 °C and removed from the furnace at 1000 °C to cool down to room temperature.
The electrodes used to measure ac impedance were made of platinum, which was brushed on the base and the top of the pellet surface. After drying the platinum paste, the pellets were sintered at 900 °C, for 30 minutes. The experiment was performed as follow: pellets were introduced in the furnace and heated up to 600 °C, at the rate of 10 ºC/min, and then held at 600 °C. For every measurement, pellets are removed from the furnace and left in air to cool down. One hour before the measurement, pellets are placed in the jig and inside a furnace at 600 °C. The impedance measurements are performed by means of a frequency response analyzer HP Hewlett-Packard, 4192A LF. The frequency range is 13 MHz-5 Hz and the effective
ac voltage amounted to 20 mV. After the end of these experiments, pellets were cut, polished and observed in the SEM.
RESULTS AND DISCUSSION
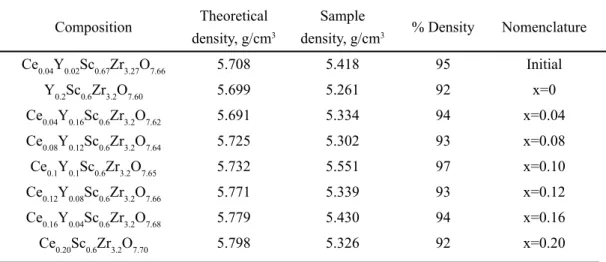
Pellets used in this experiment were sintered at 1500 °C for 12 h. All densities are above 92%, the highest achieved is for the composition Ce0.1Y0.1Sc0.6Zr3.2O7.65, which is 97%, as shown in Table I.
The X-ray diffraction pattern (Fig. 1) of the (CexY0.2-x) Sc0.6Zr3.2O8-d (0 ≤ x ≤ 0.2) system and composition Ce0.04Y0.02Sc0.67Zr3.27O7.66 calcined at 400 ºC for 3 h showed a presence of a single phase with a cubic luorite-type structure, Fm3m space group.
Fig. 2 summarises the changes in the conductivity behaviour against time, performed at 600 ºC for almost 4500 h, for all compositions. The shaded area is to stand out the degradation in conductivity of the pellets.
For the irst 1800 h of the experiment, there is no signiicant variation of the conductivity, although some oscillation can be observed. The stability of the conductivity is in agreement with results from Haering et al [9, 11]. After 1800 h, shaded area in Fig. 2, all compositions decrease their conductivity, until time equal 2896 h. During this experiment a power failure occurred at approximately 3500 h and last for 36 h, therefore the last measurement at 4240 h was excluded from discussion, as the conductivity values increased instead of the expected decrease. Composition Ce0.20Sc0.6Zr3.2O7.70 (in orange) has the highest conductivity and also has the highest amount of ceria, on the other hand, the composition with no ceria content (in red) has the lowest conductivity values. There are no measurements for the pellets from the composition with no ceria, after 1729 h, because they were damaged. The values for total conductivity, for the
Composition Theoretical density, g/cm3
Sample
density, g/cm3 % Density Nomenclature Ce0.04Y0.02Sc0.67Zr3.27O7.66 5.708 5.418 95 Initial
Y0.2Sc0.6Zr3.2O7.60 5.699 5.261 92 x=0
Ce0.04Y0.16Sc0.6Zr3.2O7.62 5.691 5.334 94 x=0.04 Ce0.08Y0.12Sc0.6Zr3.2O7.64 5.725 5.302 93 x=0.08
Ce0.1Y0.1Sc0.6Zr3.2O7.65 5.732 5.551 97 x=0.10
Ce0.12Y0.08Sc0.6Zr3.2O7.66 5.771 5.339 93 x=0.12 Ce0.16Y0.04Sc0.6Zr3.2O7.68 5.779 5.430 94 x=0.16
Ce0.20Sc0.6Zr3.2O7.70 5.798 5.326 92 x=0.20
Table I - Density of pellets from the system CexY0.2-xSc0.6Zr3.2O8-d (0 ≤ x ≤ 0.2) and from composition
Ce0.04Y0.02Sc0.67Zr3.27O7.66 and nomenclature used.
[Tabela I - Densidade das pastilhas do sistema CexY0,2-xSc0,6Zr3,2O8-d(0 ≤ x ≤ 0,2) e da composição
irst measurement, time equals 0 h, are lower than for the second measurement, after 480 h, except for compositions Y0.2Sc0.6Zr3.2O7.60 and Ce0.16Y0.04Sc0.6Zr3.2O7.68, Fig. 2. One
possible explanation is that the irst measurement could have been performed at a slightly lower temperature than for the remaining part of the experiment.
Table II shows the values for conductivity of the irst measurement for 0 h, measurement for 480 h, to have stable temperature conditions, for comparison. The fourth column presents values for conductivity from experiments of temperature variation [12].
For all compositions there is a slight increase in conductivity after 480 h when compared with conductivity
values for 0 h, except for compositions Y0.2Sc0.6Zr3.2O7.60. This can reinforce the idea of the irst measurement, for the ageing experiment, being performed at temperatures slightly below 600 °C and the difference in conductivity, in some compositions, can also be due to the better ionic conductivity of the samples.
Observing Fig. 3 and Table III, one can say that the resistance decreases, from the beginning of the experiment to 960 h. From 960 h until 2440 h, the resistance increases; when the measurement is performed at 2896 h there is an increase in resistance and in addition there is the appearance of a semi-circle, which provides values for the bulk and grain boundary resistance, shown in Table III.
Figure 1: X-ray diffraction patterns of the system CexY0.2-xSc0.6Zr3.2O8-d (0≤x≤0.2), and the composition
Ce0.04Y0.02Sc0.67Zr3.27O7.66, calcined at 400 °C for 3 h.
[Figura 1: DRX dos pós do sistema CexY0,2-xSc0,6Zr3,2O8-d (0 ≤ x ≤ 0,2),
e da composição Ce0,04Y0,02Sc0,67Zr3,27O7,66, calcinado 400 °C durante
3 h.]
2q (degree)
Intensity (a.u.)
4
3
2
1
0
20 30 40 50 60 70 80 90
x=0.20 Initial
x=0.16
x=0.12
x=0.10
x=0.08
x=0.04
x=0.00
Figure 2: Variation of total conductivity with time, for compositions of the system CexY0.2-xSc0.6Zr3.2O8-d (0 ≤ x ≤ 0.2) and the composition
Ce0.04Y0.02Sc0.67Zr3.27O7.66, at 600 °C.
[Figura 2: Variação da condutividade total com o tempo, para o sistema CexY0,2-xSc0,6Zr3,2O8-d (0 ≤ x ≤ 0,2) e para a composição
Ce0,04Y0,02Sc0,67Zr3,27O7,66, a 600 °C.]
Time (h)
s
(S/cm)
0 0,0120
0.0105
0.0090
0.0075
0.0060
0.0045
0.0030
1000 2000 3000 4000 5000
Composition Conductivityafter 0 h, S/cm
Conductivity after 480 h, S/cm
Conductivity, S/cm [12]
Ce0.04Y0.02Sc0.67Zr3.27O7.66 0.0100 0.0093 0.016
Y0.2Sc0.6Zr3.2O7.60 0.0071 0.0057 0.010
Ce0.04Y0.16Sc0.6Zr3.2O7.62 0.0072 0.0075 0.008
Ce0.08Y0.12Sc0.6Zr3.2O7.64 0.0075 0.0085 0.010
Ce0.1Y0.1Sc0.6Zr3.2O7.65 0.0071 0.0078 0.006
Ce0.12Y0.08Sc0.6Zr3.2O7.66 0.0077 0.0082 0.009
Ce0.16Y0.04Sc0.6Zr3.2O7.68 0.0080 0.0084 0.014
Ce0.20Sc0.6Zr3.2O7.70 0.0092 0.0115 0.010
Table II - Conductivity of the irst measurement for the ageing experiment and conductivity of other samples for the same composition.
Figure 3: Impedance spectra plot from the composition Ce0.04Y0.16Sc0.6Zr3.2O7.62, at 600 °C.
[Figura 3: Espectros de impedância para a composição Ce0,04Y0,16Sc0,6Zr3,2O7,62, a 600 °C.]
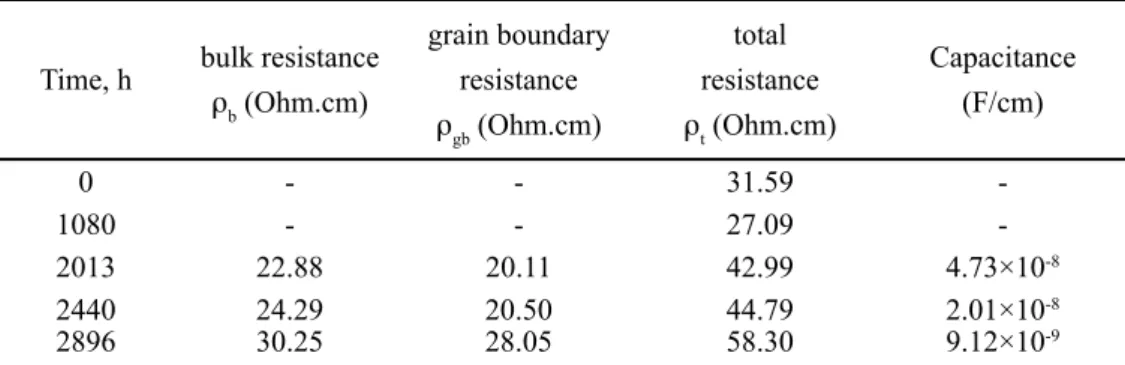
Time, h bulk resistance
rb (Ohm.cm)
grain boundary resistance
rgb (Ohm.cm)
total resistance
rt (Ohm.cm)
Capacitance (F/cm)
0 - - 31.59
-1080 - - 27.09
-2013 22.88 20.11 42.99 4.73×10⁻⁸
2440 24.29 20.50 44.79 2.01×10⁻⁸
2896 30.25 28.05 58.30 9.12×10⁻⁹
AC impedance spectra of Ce0.04Y0.16Sc0.6Zr3.2O7.62
-50
-40
-20 -30
-10
10 20
0 30 40 50
0
Z” (
W
)
Z’ (W)
0 h 600 h 960 h 2440 h 2896 h
Figure 4: Impedance spectra plot of the composition Ce0.16Y0.04Sc0.6Zr3.2O7.68, at 600 °C.
[Figura 4: Espectros de impedância da composição Ce0,16Y0,04Sc0,6Zr3,2O7,68, a 600 °C.]
AC impedance spectra of Ce0.16Y0.04Sc0.6Zr3.2O7.68
-50 -60
-40
-20 -30
-10
10 20
0 30 40 50 60
0
Z” (
W
)
Z’ (W)
0 h 1080 h 2013 h 2440 h 2896 h
Time, h bulk resistance
rb (Ohm.cm)
grain boundary resistance
rgb (Ohm.cm)
total resistance
rt (Ohm.cm)
Capacitance, (F/cm)
0 - - 38.88
-600 - - 37.41
-960 - - 34.96
-2440 - - 36.62
-2896 40.49 16.52 57.01 1.31 x 10⁻⁸
Table III - Bulk resistance, grain boundary resistance and total resistance and capacitance correspondent to the semi-circle.
[Tabela III - Resistência do grão, resistência da fronteira de grão e resistência total, e capacidade correspondente ao semi-circulo.]
Table IV - Bulk resistance, grain boundary resistance and total resistance and capacitance correspondent to the semi-circle.
Composition Ce0.16Y0.04Sc0.6Zr3.2O7.68 has higher conductivity values than compositions with lower ceria content in the system, but after approximately 1800 h of this experiment conductivity has a rapid decrease, Fig. 2.
For the irst 1080 h of the experiment, there is only one semi-circle, corresponding to the electrode process, no other processes were registered. After 2013 h, there is the appearance of a second semi-circle, which becomes more deined with the increase of time. After the appearance of this second semi-circle, total resistance rapidly increases. Capacitance values have the order of magnitude 10-8 F/cm
and with time this value decreases. As this sample is well sintered; therefore the semi-circle could correspond to a grain boundary component [13, 14]. Values for total, bulk and grain boundary resistance are presented in Table IV. Bulk and grain boundary resistance increase signiicantly after 2440 h. This can indicate degradation of the grain boundary and/or a change in the microstructure of the grain boundary, after
2013 h, leading to an ageing and an increase in resistance. There is a decrease in the total resistance from 0 h to 2013 h, as curves are located in the left side of the curve for 0 h. The measurement at 2896 h shows that total resistance has increased since the measurement at 2013 h. After 2013 h, resistance increases indicating ageing of the sample.
Comparison between compositions
There is a pattern which occurs for all compositions analysed, until 1800 h, conductivity is fairly stable; after 1800 h, conductivity decreases until the end of the experiment, indicating ageing. This is in agreement with Haering et al. [9] and Nomura et al. [15], who state that compositions with scandia content lower than 11 mol%, present degradation in conductivity in irst the 500 h but when scandia content is higher than 11 mol% no degradation is observed in the irst 500 h. The total dopant content is higher than 11 mol% for all compositions in the system.
The resistance of the composition Ce0.04Y0.16Sc0.6Zr3.2O7.62 slightly decreases until 1800 h but after this time the resistance starts to increase. When a measurement is taken at 2896 h a semi-circle appears and it is possible to obtain values for bulk and grain boundary resistances. The composition Ce0.16Y0.04Sc0.6Zr3.2O7.68 has a slight decrease of resistance until 1800 h; after this time the resistance starts to increase. From 2013 h until 2440 h the resistance increases slowly, but after this time, at 2896 h, the bulk and grain boundary resistances increase signiicantly. “This is most likely that an ordering process and the formation of microdomains in the low temperature range during long annealing is responsible for conductivity degradation in cubic phase samples”, as stated by Politova et al. [16]. For the composition Ce0.20Sc0.6Zr3.2O7.70, there is a clear increase in resistance, after 2013 h, indicating ageing.
The effect which most contributes for the conductivity is the defect association, their concentration and their transformation. As these defects play a major role for the electrical conductivity, it will inluence the conductivity degradation too. One way to promote conductivity is to increase the oxygen vacancy number, by doping zirconia with a trivalent oxide. However if the dopant concentration is high, it creates a high level of vacancies, which will rearrange, hindering conductivity. In addition, the increase of vacancies will create an electrostatic interaction between the oxygen vacancies and the dopant cations. This leads to an ordering of the cations during annealing causing the formation of anions microdomains, therefore causing conductivity degradation [9, 11, 15, 16].
Scanning electron microscopy micrographs, SEM
Fig. 6 is a micrograph of a sample after ac impedance measurements and etching; it is shown for comparison with Fig. 7. The samples used for micrographs in Figs. 7, 8 and 9 are the ones used for the ageing experiment. The information regarding Fig. 6 is presented in [12].
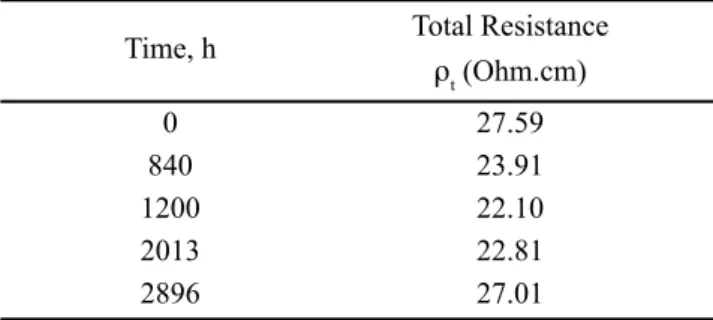
Figure 5: Impedance spectra plot of the composition Ce0.20Sc0.6Zr3.2O7.70, at 600 °C.
[Figura 5: Espectros de impedância da composição Ce0,20Sc0,6Zr3,2O7,70, a 600 °C.]
-50 -60
-40
-20 -30
-10
10 20
0 30 40 50 60
0
Z” (
W
)
Z’ (W)
0 h 840 h 1200 h 2013 h 2896 h
AC impedance spectra of Ce0.20Sc0.6Zr3.2O7.70
Time, h Total Resistance
rt (Ohm.cm)
0 27.59
840 23.91
1200 22.10
2013 22.81
2896 27.01
Table V - Total resistance for different times.
In Fig.7 grain boundaries are well deined and the hill and valley microstructure can be observed. In the sample with no ageing, Fig. 6, most pores are located in the grain boundary; while in sample after ageing, pores are observed within the grain, bulk. In the bottom left of Fig. 7, a region with some damage can be observed. There is also a darker colouration in Fig. 6 that does not appear in the sample after ageing, Fig. 7.
Fig. 8 shows grain boundaries are well deined but it looks that there are smaller grains inside larger ones. It has the appearance that grains start to be divided inside the larger grains. This could be the indication of microstructure ageing, therefore increasing the grain boundary resistance.
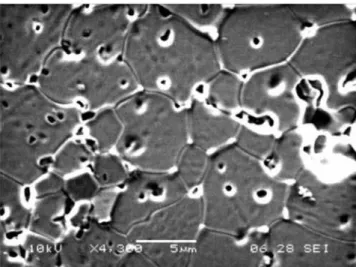
Fig. 8 shows signiicant damage on the surface, the hill and valley microstructure is more visible [17]. Cracks and issures can be observed, showing microstructure deterioration of the sample.
In Fig. 9 the hill and valley microstructure is visible [17], there are some irregularities on the surface and smaller grains are positioned inside the larger grains. When comparing micrographs with aged and not aged samples, the irst observation is that grains with darker colouration do not appear on the aged samples. Visually, in aged samples, the surface seems to be irregular and damaged; in the microstructure there are cracks and issures. In some cases, as for composition Ce0.16Y0.04Sc0.6Zr3.2O7.68 shown in Fig. 8, damage is clearly visible. Smaller grains, with not well deined grain boundary, can be observed inside Figure 6: Scanning electron microscopy micrograph of
Ce0.04Y0.08Sc0.6Zr3.2O7.60, not aged.
[Figura 6: Fotograia do microscópio eletrônico de varredura da Ce0,04Y0,08Sc0,6Zr3,2O7,60, não envelhecida.]
Figure 7: Scanning electron microscopy micrograph of Ce0.04Y0.08Sc0.6Zr3.2O7.60, after ageing.
[Figura 7: Fotograia do microscópio eletrônico de varredura da Ce0,04Y0,08Sc0,6Zr3,2O7,60, depois do envelhecimento.]
Figure 8: Scanning electron microscopy micrograph of Ce0.16Y0.04Sc0.6Zr3.2O7.68, after ageing.
[Figura 8: Fotograia do microscópio eletrônico de varredura da Ce0,16Y0,04Sc0,6Zr3,2O7,68, depois do envelhecimento.]
Figure 9: Scanning electron microscopy micrograph of Ce0.2Sc0.6Zr3.2O7.70, after ageing.
larger grains with well deined grain boundaries. On the other hand, for compositions Ce0.04Y0.08Sc0.6Zr3.2O7.60 and Ce0.2Sc0.6Zr3.2O7.70, Fig. 7 and Fig. 9, respectively, some damage on the surface can be observed, but not as extensive as in Fig. 8. The composition Ce0.16Y0.04Sc0.6Zr3.2O7.68, Fig. 8, displays signiicant surface damage, which correlates with the appearance of a semi-circle for time equals 2013 h and from this time grain boundary resistance increases until the end of the experiment, Fig. 4 and Table IV.
Impedance spectra for composition Ce0.2Sc0.6Zr3.2O7.70, Fig. 5, do not show any semi-circle during all experiment, which correlates with a less damaged surface, Fig. 9. CONCLUSIONS
For the irst 1800 h all compositions present fairly stable conductivity values. After this time conductivity decreases; in some cases, compositions Ce0.04Y0.08Sc0.6Zr3.2O7.60 and Ce0.20Sc0.6Zr3.2O7.70, this decreases is rapid. When micrographs from samples after ac impedance and samples after the ageing are compared, the irst observation is that grains with darker colouration do not appear in the samples after ageing. The surface of samples after ageing has irregularities that are not present on the surface of samples after ac impedance. For all micrographs of samples after ageing, the grain boundaries are well deined and an increase of pores inside grains can be observed, in some cases the surface is damaged showing cracks and issures. For all compositions, the hill and valley microstructure is visible [17]. For all composition there is an ageing due to rearrangement involving the defects introduced by dopants. These defects will order during long annealing, originating conductivity degradation.
ACKNOWLEDGEMENTS
We thank the RealSOFC EU integrated project for a travel grant that enabled this research to be performed. We
acknowledge Supergen, EPSRC and Tim Worstall from TTE metals for scandia supply.
REFERENCES
[1] M. Yashima, M. Kakihana, M. Yoshimura, Solid State Ionics, 86-88 (1996) 1131.
[2] S. P. S. Badwal, F. T. Ciacchi, D. Milosevic, Solid State Ionics 136-137 (2000) 91.
[3] K. Eguchi, N. Akasaka, H. Mitsuyaser, Y. Nonaka, Solid State Ionics 135 (2000) 589.
[4] N. Minh, J. Am. Ceram. Soc. 76, 3 (1993) 563.
[5] Y. Murakami, I. Nagano, H. Yamamoto, J. Mater. Sci. Lett. 16 (1997) 1686.
[6] S. P. S. Badwal, Solid State Ionics 52 (1992) 23. [7] F. T. Ciacchi, S. P. S. Badwal, J. Eur. Ceram. Soc. 7
(1991) 197.
[8] T. S. Zhang, J. Ma, L. B. Kong, S. H. Chan, J. A. Kilner, Solid State Ionics 170 (2004) 209.
[9] C. Haering, A. Roosen, H. Schichl, M. Schnoeller, Solid State Ionics 176 (2005) 261.
[10] F. T. Ciacchi, S. P. S. Badwal, J. Drennan, J. Eur. Ceram. Soc. 7 (1991) 185.
[11] C. Haering, A. Roosen, H. Schichl, Solid State Ionics
176 (2005) 253.
[12] E. de Carvalho, W. Preis, W. Sitte, J. T. S. Irvine, Solid State Ionics 181 (2010) 1344 .
[13] J. T. S. Irvine, D. C. Sinclair, A. R. West, Adv. Mater.
2 (1990) 132.
[14] J. R. MacDonald, “Impedance Spectroscopy, emphasizing solid materials and systems”, John Wiley & Sons, N. York, USA (1987).
[15] K. Nomura, Y. Mizutari, H. Kawai, Y. Nakamura, O. Yamamoto, Solid State Ionics 132 (2000) 235.
[16] T. Politova, J. T. S. Irvine, Solid State Ionics 168 (2004) 15.
[17] M. S. Schmidt, K. V. Hansen, K. Norman, M. Mogensen, Solid State Ionics 179 (2008)1436.