INTRODUCTION
ABO3 perovskite compounds have been the subject of many researches for their various physical and chemical properties [1]. Among these oxides, the lanthanum ferrite, LaFeO3 (LF), is of great interest. In fact, besides its use as high temperature material [2],LF compound is a promising candidate for a number of technologies including solid-oxide fuel cell electrodes [3], sensor material for the detection of humidity and alcohol [4] and catalyst material for complete hydrocarbon oxidation [5]. Since the properties of any compound depend largely on its synthesis procedure, several methods were proposed for LF powder preparation. Because of the drawbacks related to the conventional solid-state method, such as impurity and high grain size [6],different soft chemical methods were also checked. They afford several advantages such as reduction of reaction time and calcining temperature, high purity and superior homogeneity. In this work, the polymerizable complex method was adopted for the preparation of LF powder. This choice could be justiied by the fact that other chemical approaches (co-precipitation, sol gel, spray pyrolysis and combustion methods, etc…) present some problems essentially linked to the use of expensive starting reagents and the experimental conditions
such as temperature, pH control and chemical composition [7, 8]. With the purpose to highlight the eficiency of the chosen soft chemical method, phase formation, morphology and particle size of the prepared compound were studied.
EXPERIMENTAL
Lanthanum nitrate hexahydrate (La(NO3)3.6H2O, Fluka, 99%) and iron trichloride hexahydrate (FeCl3.6H2O, Merck, 99%) were used as starting materials. Ethylene glycol (C2H6O2, Prolabo, 99.8%) and anhydrous citric acid (C6H8O7, Renal Budapest, 99.8%) were used as polymerization and complexation agents, respectively.
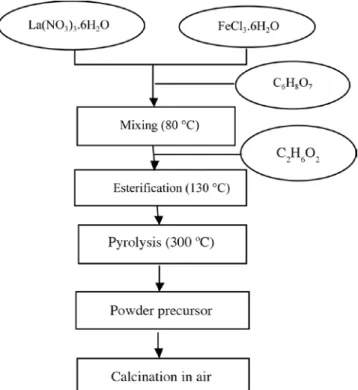
LF powder was prepared by the polymerizable complex method (PCM) as summarized in Fig. 1. Cation salts were dissolved in distilled water in stoichiometric molar ratio. After addition of citric acid, the resulting solution was magnetically stirred at 80 °C for 2 h. Then, ethylene glycol was added to the obtained orange transparent mixture in the ratio 4:1 of citric acid. This solution was heated at 130 °C for the polyesteriication reaction which results in a glassy like gel. The latter, heated at 300 °C, leads to the formation of the powder precursor. To obtain LF compound, this solid phase was calcined in air for 6 h at constant temperatures varying from 500 to 900 °C.
Preparation of lanthanum ferrite powder at low temperature
(Preparação de pó de ferrita de lantânio a baixa temperatura)
R. Andoulsi, K. Horchani-Naifer, M. Férid
Physical Chemistry Laboratory of Mineral Materials and their Applications B.P. 95 Hammam-Lif, 2050, Tunisia
Abstract
Single lanthanum ferrite phase was successfully prepared at low processing temperature using the polymerizable complex method. To implement this work, several techniques such as differential scanning calorimetry, X-ray diffraction, Fourier Transform Infrared Spectroscopy, scanning electron microscopy and BET surface area measurements were used. Throw the obtained results, it was shown that steps of preparing the powder precursor and temperature of its calcination are critical parameters for avoiding phase segregation and obtaining pure lanthanum ferrite compound. Thus, a single perovskite phase was obtained at 600 °C. At this temperature, the powder was found to be ine and homogeneous with an average crystallite size of 13 nm and a speciic surface area of 12.5 m2.g-1. Keywords: perovskite, lanthanum ferrite, synthesis, characterization, thermal decomposition, microstructure.
Resumo
Fase única de ferrita de lantânio foi preparada com sucesso em baixa temperatura de processamento usando o método do complexo polimerizável. Para implementar este trabalho, foram usadas várias técnicas como calorimetria diferencial de varredura, difração de raios X, infravermelho com transformada de Fourier, microscopia eletrônica de varredura e análise de adsorção gasosa (BET). Pelos resultados obtidos foi mostrado que as etapas de preparação do pó precursor e a temperatura de calcinação são parâmetros críticos para evitar a segregação de fases e obter o composto puro de ferrita de lantânio. Assim, uma fase única de perovskita foi obtida a 600 °C. Nessa temperatura, foi observado pó homogêneo e ino com tamanho médio de cristalito de 13 nm e área de
superfícies especiica de 12,5 m2.g-1.
To estimate the crystallization temperature of the lanthanum ferrite compound, thermal analysis of the powder precursor was carried out. The sample was heated from room temperature to 650 °C in air atmosphere using a Mettler Toledo apparatus. The polymeric precursor and its different samples calcined at different temperatures were characterized as follows: the powder X-ray diffraction patterns were recorded on a Siemens D500 diffractometer using Cukα radiation. The mean diameter of crystallites was determined from X-ray diffraction line broadening using the Scherrer formula [9]. The FTIR spectra of the samples were obtained using Nicolet 560 spectrophotometer employing KBr pellet technique. The morphology was examined using a scanning electron microscope (FEI Quanta 200) and the speciic surface area was determined by N2 adsorption desorption (BET) at 77K using a Micrometric Model 2100 E Accusorb Instrument. The average particle size (DBET) was calculated from surface area measurements using the following expression [10]:
DBET = 6/(r.SBET) (A)
where ρ and SBET are the theoretical density and the speciic surface area of the particles, respectively.
RESULTS AND DISCUSSION
The DSC curve of the powder precursor, depicted in Fig. 2, shows only two successive exothermic events between 420 and 550 °C. They correspond to the decomposition and
removal of the organic species. The broad peak area under the DSC trace is related to a smooth decomposition or a mild ignition taking place gradually throughout the formed resin until it was completely burned out [11]. No endothermic peak is detected around 200 °C. This indicates that there is no more free citric acid. In fact, inset at top left corner in Fig. 2 shows that anhydrous citric acid decomposes between 160 and 227 °C [11]. Moreover, there is no distinct exothermic peak corresponding to LF crystallization. It is presumably masked by the intense exothermic phenomenon at 550 °C. This reveals that the ending of resin burnout and beginning of LF crystallization occurs around 600 °C. This result will be conirmed thereafter by XRD and FTIR analysis.
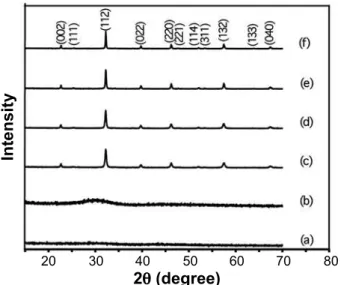
Fig. 3 shows XRD patterns of the polymeric powder and its samples calcined at different temperatures. The untreated precursor has an amorphous structure (Fig. 3a) and no obvious diffraction peaks can be identiied even when it was calcined at 500 °C (Fig. 3b). However, the powder XRD patterns of the samples calcined in the range 600-900 °C indicate sharp and well deined Bragg peaks corresponding exclusively to the single lanthanum ferrite phase (Figs. 3c-f). This indicates that LF crystallizes directly from the amorphous precursor without the formation of any other phase.
All the diffraction lines are assigned to the orthorhombic LF phase (ICDD PDF 74-2203) with the Pbnm space group N.62 and the cell parameters: a = 5.567 Å, b = 5.577 Å and c = 7.851 Å.
Phase segregation may occur during the calcination step especially for low temperatures [12]. This undesirable phenomenon leads to the formation of carbonates,
Figure 1: Flow chart for the preparation of LF powder by the polymerizable complex method.
[Figura 1: Fluxograma para a preparação do pó de ferrita de lantânio pelo método do complexo polimérico.]
150
50
0
0
Temperature (ºC)
100 200 300 400 500 600
100
H
ea
t l
ow
(m
W
)
535 ºC
423 ºC
Figure 2: Differential scanning calorimetry curve of the powder precursor. Inset at top left corner shows DSC curve of anhydrous citric acid.
oxocarbonates and metal oxides in the desired product. In our case, absence of these impurities could be linked to the slow heating rate adopted. In fact, in this way, organic combustion is more controlled. The preparation of pure lanthanum ferrite phase can be also justiied by the acid medium (imposed by citric acid) which prevents the formation of undesirable precipitates. Thus, low pH and slow heating of the precursor are principle keys for successful single phase preparation at low temperature. The average crystallite size (DDRX) and lattice distortion (ε) were calculated using the Scherrer formula and equation (B) [13], respectively.
(2 w)2cos 2 q = 4 ( ) 2+ 32 e2sin 2 q
p 2
l
DXRD (B)
2 w is the full width at half maximum of the XRD peak, θ is the diffraction angle and λ is the X-ray wavelength. As listed in Table I, within the temperature range of 600-900 °C, LF
crystallite size increases from 13 to 26 nm and the
lattice distortion decreases from 2 to 0.8. Considering what is generally found in literature [14], smaller crystallite sizes are obtained in our case.
In order to get a better insight into the chemical bonds in the polymeric precursor and its samples calcined at different temperatures, FTIR measurements were used. Fig. 4 illustrates the FTIR spectrum of the powder precursor. The band around 3450 cm-1 arises from O-H stretching mode for the inter molecular hydrogen bond or molecular water [15]. Esteriication between citric acid and ethylene glycol is conirmed by the presence of the 1733 and 1260 cm-1 bands assigned to the C=O and C-O-C stretching vibrations for the ester group, respectively [16]. Vibrations at 1640 and those at 1560-1440 cm-1 imply a complexation process between citric acid and metal ions. In fact, the irst of which is characteristic of COO- stretching mode for a unidentate complex and the second one for a bidentate complex [17].
20 30 40 50 60 70
2q (degree)
In
te
ns
ity
80
Figure 3: XRD patterns of the powder precursor: (a) sample without thermal treatment, (b, c, d, e and f) samples calcined for 6 h at 500, 600, 700, 800 and 900 °C, respectively.
[Figura 3: Difratogramas de raios X do pó precursor: (a) amostra sem tratamento térmico, (b, c, d, e, e f) amostras calcinadas por 6 h a 500, 600, 700, 800 e 900 °C, respectivamente.]
Figure 4: Infrared spectrumof the powder precursor.
[Figura 4: Espectro na região do infravermelho do pó precursor.]
75
70
65
60
55
50
45
4000 3500 3000 2500 2000 1500 1000 500
Tr
an
sm
itta
nc
e
(%
)
Wavenumber (cm-1)
Table I - Average crystallite size (DXRD), particle size (DBET), lattice distortion (ε) and surface area (SBET) of LF perovskite.
[Tabela I - Tamanho médio do cristalito (DXRD), tamanho de partícula (DBET) , distorção de rede (ε) e área de superfície especiica (SBET) da perovskita FL.]
Calcining temperature
(°C)
DXRD
(nm) (nm)DBET ε.103 (mS2BET .g-1)
600 13 72 2.17 12.45
700 15 95 1.92 9.5
800 22 123 1.33 7.35
900 26 151 0.8 6
4000 3500 3000 2500 2000 1500 1000 500
Tr
an
sm
itta
nc
e
Wavenumber (cm-1)
Figure 5: Infrared spectra of LF samples heated for 6 h at: 500 °C (a), 600 °C (b), 700 °C (c), 800 °C (d) and 900 °C (e).
Effects of heat treatment on the previously mentioned bonds were investigated. FTIR spectra of the thermally treated precursor samples are given in Fig. 5. It can be seen that the 1733 cm-1 band has been disappeared suggesting the polyester decomposition. The presence of the 1467, 1050 and 854 cm-1 bands at 500 °C indicates the formation of carbonates derived from metallic citric acid chelates [18]. Also, it can be noted that a well deined band has been appeared below 700 cm-1. This region is typical of the vibrational frequencies of metal-oxygen bonds formed at relatively low temperature. With increasing temperature, these bands become more intense. However, characteristic organic bands have been clearly reduced and disappeared indicating the elimination of organic matter.
FTIR analyses were also used to highlight the structural distortion for perovskite compounds. This is clearly seen in Fig. 6. The broad band at 556 cm-1 can be assigned to the asymmetrical stretching vibrations of Fe-O bonds of the structure’s octahedrons FeO6 and the one around 400-373 cm-1 can be attributed to O-Fe-O bending mode [29]. The appearance of split bands at 373 cm-1 is characteristic for the structural deformation of the perovskite lattice since this vibrational mode is not active for ideal cubic perovskites [20].
Considering the informations provided by XRD, IR and DSC data, 600 °C could be a right choice to obtain pure and ine LF powder since it reduces the global cost of the preparation. Thus, we show the eficiency of the polymerizable complex method.
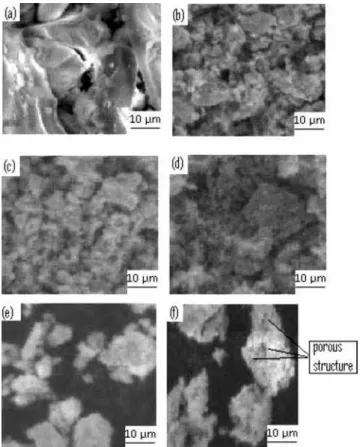
To investigate the microstructure of the powder precursor and its samples calcined at different temperatures, SEM and BET analysis were carried out. SEM micrographs are illustrated in Fig. 7. The untreated precursor is composed of single and large blocks with irregular or polygonal
shapes. The powders obtained after calcination have similar microstructures indicating the presence of plate like particles having a slightly different sizes and a porous cloud like agglomerates. A spongy aspect and a well developed porous microstructure are clearly visible in Fig. 7f. The formation of such agglomerate is often ascribed to the excessive heat released during the burnout of organic residues.
Surface area of LF powder obtained at 600 °C is about 12.5 m2.g-1. As shown in Table I, a rise in calcination temperature leads to its reduction until reaching 6 m2.g-1 for a calcining temperature of 900 °C. With regards to the conventional solid state and auto-combustion synthesis the values obtained in our case are better [21, 22]. Thus, we conirm again the advantages of the considered synthetic route.
BET analyses were also used to calculate the particle size. The values obtained using equation (A) and gathered in Table I, show that higher calcining temperatures lead to the obtention of larger particles and favor the grain growth. Assuming that the relation between particle size and temperature is given by equation (C) (where DBET is the grain size, Q is the activation energy for the grain growth, T is the absolute temperature, R is the ideal gaz constant
Figure 6: Infrared spectrumof LF sample prepared at 600 °C.
[Figura 6: Espectro na região do infravermelho da amostra FL preparada em 600 °C.]
1000 900 800 700 600 500 400 300
Tr
an
sm
itta
nc
e
Wavenumber (cm-1)
Figure 7: SEM micrographs of the powder precursor: (a) sample without thermal treatment, (b, c, d, e and f) samples calcined for 6 h at 500, 600, 700, 800 and 900 °C, respectively.
and A is the intercept [23]),
log (DBET)= - Q * + A
2.303R T1 (C)
the plot of logarithm of LF grain size versus the reciprocal of absolute temperature (Fig. 8) allowed us to estimate the activation energy for the grain growth of LF powders. It is 20 kJ.mol-1. This low value explains the rapid growth of particles within the temperature range of 600-900 °C.
Considering that temperature increasing reduces signiicantly the surface area and favors the grain growth, a calcination temperature of 600 °C seems to be again a reasonable choice for preparing the lanthanum ferrite compound with suitable characteristics for use in speciic applications.
CONCLUSION
This study deals with the preparation of LF powder at low temperature. To achieve this aim, the polymerizable complex method is adopted. Throw this work; we have recognized that high soluble starting reagents, slow heating of the precursor and low calcination temperature are appropriate conditions for the preparation of pure LF compound. Thus, slight agglomerated and homogeneous LF powder with an average crystallite size of 13 nm and speciic surface area of 12.5 m2.g-1 is obtained at 600 °C.
-0,80 -0,85
0,85 0,90 0,95 1,00 1,05 1,10 1,15
-0,95 -0,90
-1,00
-1,05 -1,10
-1,15
lo
g
(D B
ET
)
(1/T) 103 (1/K)
Figure 8: Plot of log(DBET) versus the reciprocal of absolute temperature.
[Figura 8: Gráico de log(DBET)versus o recíproco da temperatura
absoluta .]
ACKNOWLEDGEMENT
This work is supported by the Ministry of Higher Education and Scientiic Research in Tunisia.
REFERENCES
[1] Z. L. Wang, Z. C. Kang, Functional and smart materials, 2nd Ed.,Plenum Press, New York, USA (1998).
[2] E. A. Tugova, I. A. Popova, V. V. Gusarov, Glass Phys. Chem. 32 (2006) 674.
[3] M. Hung, M. V. Madhava Rao, D. Tsai, Mater. Chem. Phys. 101 (2007) 297.
[4] A. Berenov, E. Angeles, J. Rossiny, E. Raj, J. Kilner, A. Atkinson, Solid State Ionics179 (2008) 1090.
[5] P. Ciambelli, S. Cimino, S. De Rossi, L. Lisi, G. Minelli, P. Porta, G. Russo, Appl. Catal. B29 (2001) 239.
[6] M. Kakihana, J. Sol-gel Sci. Technol. 6 (1996)7.
[7] D. A. Furnor, M. R. Morelli, A. M. Segadães, Mater. Res. Bull. 31 (1996) 1243.
[8] S. D. Kumar, T. M. Srinivasan, P. Ramasamy, C. Subramanian, Mater. Chem. Phys. 113 (2009) 803.
[9] B. Cullity, Elements of X-ray diffraction, 3rd Ed., Addison-Wesley, USA (1978).
[10] J. R. Zhang, L. Gao, Chem. Lett. 32 (2003) 458. [11] L. W. Tai, P. A. Lessing, J. Mater. Res. 7 (1992) 502. [12] M. Arima, M. Kakihana, Y. Nakamura, M. Yashima, M. Yoshimura, J. Am. Ceram. Soc. 79 (1996) 2847.
[13] X. Dong, G. Hong, D. Yu, J. Inorg. Mater. 11 (1996) 542. [14] W. Yanping, Z. Junwu, Z. Lili, Y. Xujie, L. Lude, W. Xin,
Mater. Lett. 60 (2006) 1767.
[15] K. Hung, C. S. Hsieh, W. D. Yang, H. Tsai, J. Mater. Sci. 33 (1998) 3721.
[16] L. J. Bellamy, The infra-red spectra of complex molecules,
2nd Ed., London, England (1958).
[17] K. Nakamato, Infrared and raman spectra of inorganic and coordination compounds, 4th Ed., Wiley, New York, USA (1986).
[18] D. Hennings, W. Mayr, J. Solid State Chem. 26 (1978) 329. [19] A. Davydov, Infrared spectroscopy of adsorbed species on the surface of transition metal oxide, 3rd Ed., Wiley, England (1990).
[20] G. V. Subba, C. R. Rao, Appl. Spectrosc. 24 (1970) 436. [21] S. Nakayama, J. Mater. Sci. 36 (2001) 5643.
[22] X. Qi, J. Zhou, Z. Yue, Z. Gui, L. Li, Mater. Chem. Phys. 78 (2003) 25.
[23] M. Jarcho, C. H. Bolen, M. B. Thomas, J. Bobick, J. F. Kay, R. H. Doremus, J. Mater. Sci. 11 (1976) 2027.