DOI: http://dx.doi.org/10.1590/2446-4740.05815
*e-mail: [email protected]
Received: 04 January 2016 / Accepted: 23 November 2016
Heartbeat classiication system based on neural networks and
dimensionality reduction
Rodolfo de Figueiredo Dalvi*, Gabriel Tozatto Zago, Rodrigo Varejão Andreão
Abstract Introduction: This paper presents a complete approach for the automatic classiication of heartbeats to assist experts in the diagnosis of typical arrhythmias, such as right bundle branch block, left bundle branch block, premature ventricular beats, premature atrial beats and paced beats. Methods: A pre-processing step was performed on the electrocardiograms (ECG) for baseline removal. Next, a QRS complex detection algorithm was implemented to detect the heartbeats, which contain the primary information that is employed in the classiication approach. Next, ECG segmentation was performed, by which a set of features based on the RR interval and the beat waveform morphology were extracted from the ECG signal. The size of the feature vector was reduced by principal component analysis. Finally, the reduced feature vector was employed as the input to an artiicial neural network. Results: Our approach was tested on the Massachusetts Institute of Technology arrhythmia database. The classiication performance on a test set of 18 ECG records of 30 min each achieved an accuracy of 96.97%, a sensitivity of 95.05%, a speciicity of 90.88%, a positive predictive value of 95.11%, and a negative predictive value of 92.7%. Conclusion: The proposed approach achieved high accuracy for classifying ECG heartbeats and could be used to assist cardiologists in telecardiology services. The main contribution of our classiication strategy is in the feature selection step, which reduced classiication complexity without major changes in the performance.
Keywords: Electrocardiogram, Arrhythmia, Heart block, Automatic classiication, Principal component analysis, Artiicial neural network.
Introduction
Technological developments and cost reductions associated with internet access have contributed to the growth of telehealth services. These services are suitable in situations in which there is lack of health professionals or the nearest medical service center is located a great distance from those who require care. Among the various telemedicine modalities, telecardiology is related to the remote provision of cardiologic services. The main telecardiology service deals with the remote diagnostics of abnormalities presents in electrocardiograms (ECGs), which are sent through the internet to a telehealth center (Marcolino et al., 2012). The diagnostic report generated by the cardiologist is then sent back to the health professional who requested the service. The response time of the telecardiology service is critical depending on the severity of the diagnosis, as serious diseases require priority, early diagnosis and immediate treatment. To prioritize these cases, telecardiology services, in general, provide the health professional the option to manually classify that the
request as urgent. Requests that are not classiied
as urgent are analyzed according to the arrival time (Andreão et al., 2013). Approximately 14% of ECG
exams sent through a telecardiology service were
manually classiied as urgent (Sparenberg and Fetter, 2012), although the majority of these classiications corresponded to healthy people who did not require emergency treatment. On the other hand, several of the patients with electrocardiographic abnormalities have not received priority and remained in the waiting queue of non-urgent cases for a specialized report. The delay in generating reports for normal ECGs can harm patients who present an abnormality because, for some diseases, it is essential that the treatment be initiated quickly.
In this context, the Espírito Santo Telehealth program (Telessaúde ES, 2014) is proposing an automatic triage service for ECG exams (Andreão et al., 2013), where the most urgent cases are prioritized in the waiting queue to be diagnosed. The automatic triage service is integrated with the telecardiology service, and both are implemented on a web-based platform called Salus. Each telecardiology request consists of an ECG generated by a digital electrocardiograph uploaded through the Salus platform and made available to the cardiologist performing the report. The idea behind the triage service is to automatically classify each
ECG stored in the waiting queue, where the abnormal ECGs are placed in the top positions of the waiting queue. Every time an ECG is stored on the platform,
a notiication is sent to the cardiologist via SMS and
e-mail (Andreão et al., 2013).
A good classiication performance is essential for
an effective triage of urgent cases. In the literature, many studies proposes approaches based on machine learning, such as neural networks (Kim et al., 2011; Mohamad et al., 2013), support vector machines (She et al., 2010; Zhang et al., 2014), fuzzy logic (Arif et al., 2009), or linear discriminant analyses (Chazal et al., 2004), to perform automatic ECG classiication.
This paper also proposes a classiication approach
based on neural networks. The main contribution of
our classiication strategy is in the feature selection step; wherein, the goal is to improve classiication performance. The classiication approach was evaluated using the Physionet arrhythmia database, where the
heartbeats from the ECG records were gathered into six different classes. The results are compared with other works published on the subject.
Methods
The ECG classiication approach proposed for
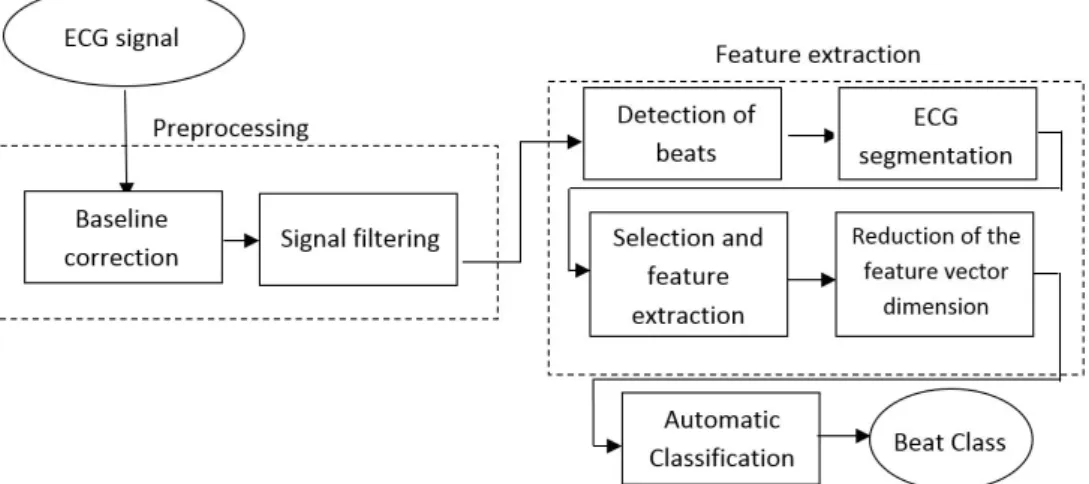
the automatic triage service is basically composed of three stages: pre-processing of the ECG signal, feature
extraction and, inally, the automatic classiication.
A block diagram of the entire system is shown in Figure 1.
Data base
The development of this work requires a database with digital ECG records for computational analysis of different patients with different pathologies. Accordingly, we employed the widely known Massachusetts Institute
of Technology (MIT) arrhythmia database, which
is available on the website of the PhysioNet group
(Goldberger et al., 2000). This database contains
48 records of two channels with half-hour durations
each. The ECG signals were sampled at 360 Hz. It was necessary to apply a rescaling factor of 200 to the amplitude of the signal to obtain the values in millivolts. In addition to the ECG signal, annotations, made by different cardiologists in common consent, containing the beat localization and the beat class are also available. Only six beat classes were considered in this work: right bundle branch block (R), left bundle branch block (L), premature ventricular beat
(V), premature atrial beat (A) and paced beat (PB).
The database was divided into three subsets, namely training, validation and testing. The training and validation sets were called G1 and contained the following records: 100, 101, 104, 106, 109, 112, 113,
117, 118, 119, 201, 203, 207, 208, 212, 214, 217, 219,
223, 232, 233, and 23. The testing set was called G2 and contained the following records: 103, 105, 107, 111, 115, 116, 121, 122, 123, 202, 205, 209, 210, 220, 221, 222, 230, and 231. The G1 set was divided
into a training set containing 80% of the beats and
validation set containing 20% of the beats.
Preprocessing
Each record contains raw ECG signal, which is usually a combination of the cardiac electrical
activity and noise. Because the ECG signal has low
amplitude, it is very sensitive to noise interference (Igarashi, 2007). Therefore, at this stage, we sought to eliminate the high-frequency noise and baseline wander.
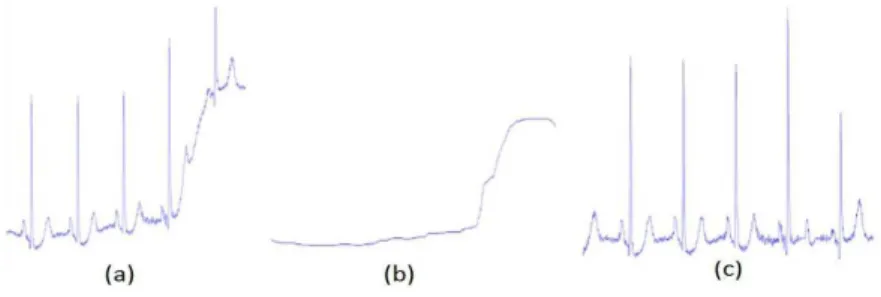
To reduce the baseline wander, two median ilters
(Chazal et al., 2004) were used. First, a 200 ms
median ilter was applied to remove the P waves
and the QRS complexes because these segments are shorter than 100 ms. The resulting signal was
processed by another median ilter with a window
size of 600 ms to remove the T waves, which have width of approximately 150 ms. Finally, the resulting signal contained the baseline of the ECG signal, which was then subtracted from the original signal for ECG baseline correction (Figure 2).
On the other hand, a 12th order low-pass inite impulse response ilter with a cutoff frequency of
35Hz was employed to eliminate high-frequency noise (Chazal et al., 2004). This ilter was chosen
because it fulills the requirements for this work, achieving -3 dB gain at the cutoff frequency and
having low complexity.
Detection of beats
The ECG signal must be segmented in terms
of beats and its different waveforms (P wave, QRS
complex and T wave) prior to the feature extraction stage. For beat detection, an algorithm that detects the peak of the QRS complex waveform was developed because it is the wave with the largest amplitude in the heartbeat. The algorithm used is based on the wavelet transform of the signal. To highlight the QRS complex, a Mexican hat wavelet function was chosen (Madeiro et al., 2007). The signal resulting from the wavelet transform was analyzed according to a threshold, where only the peaks greater than the threshold are selected. The minimum separation
between consecutive peaks was 83 ms, which is
wide enough to prevent the detection of positive and negative peaks of a single QRS complex as different
QRS complexes. A threshold deinition was used to avoid misidentiication of P and T waves as QRS
complex: signal amplitude should be larger than that of the 4 nearest peaks and reach 30% of the largest of the 20 nearest peaks.
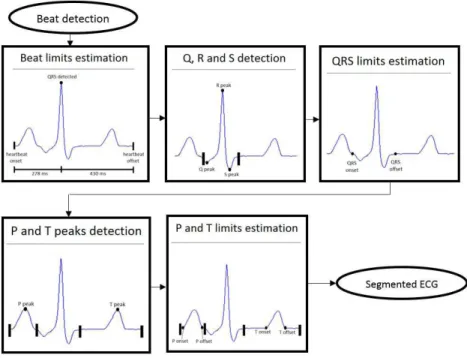
ECG segmentation
An important stage in most ECG classiication
algorithms is segmentation, which consists of obtaining the onset, the peak and the offset of each beat waveform. The entire segmentation process is
shown in Figure 3 and was applied on the irst lead of each preprocessed record.
The peak of the QRS complex already detected was taken as the reference point for segmentation of the other waves. After a close inspection of the ECG signal from the database, it was observed that
the onsets of all P waves were located no more than 280 ms before the QRS complex peak. Similarly, it
was observed that the T wave offsets were located no more than 430 ms after the QRS peak. Thus, a good
estimation of the limits of the heartbeat is 280 ms
before the QRS complex peak and 430 ms after the QRS peak.
Considering a normal ECG, the QRS complex is a sequence of three waveforms (or three peaks) within approximately 220 ms around the QRS peak. The onset of the QRS complex is estimated considering two possible events and always selecting the event nearest to the largest peak. One of the events is the
irst zero crossing, and the other event is the transition
from a smoother slope signal segment. To determine such a transition, the summation of a sequence of
ive values is considered, where each value is the
difference between two consecutive samples, which is then applied as a threshold. The offset of the QRS complex, similarly to the onset, is estimated considering the same two events and always selecting the event nearest to the peak.
For the detection of the P and T wave peaks,
the maximum amplitude points placed before and after the QRS complex are considered, respecting the limits of the heartbeat that were estimated in a previous processing step. Finally, the detection of the
onset and offset of the P and T waves is performed
according to the same strategy employed for the QRS complex onset and offset.
Feature extraction
The feature extraction stage takes into account the features commonly employed by other works in
the ield and the beat classes of the ECG database.
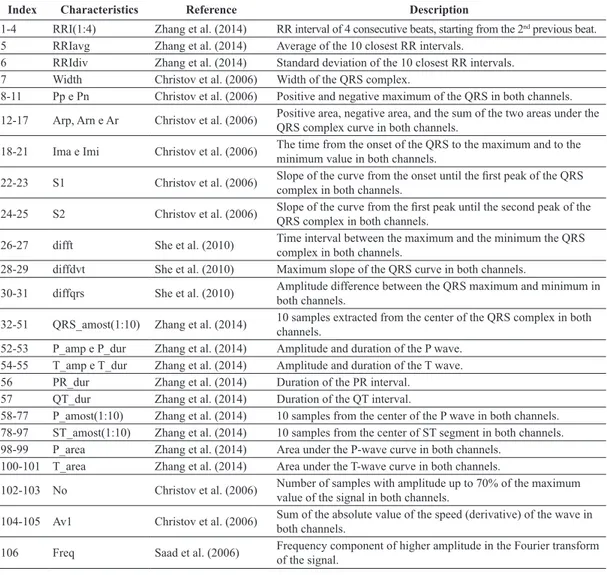
As a consequence, 106 morphological features were selected, namely, the RR intervals, which are important for the detection of arrhythmias; the features obtained
during the ECG segmentation, which consist of the peaks and durations of the different waves composing the signal; and some special features in the frequency domain, which are used in other works primarily for block detection. All the selected features are presented in Table 1.
Reduction of the feature vector dimension
A vector of 106 features is likely to have redundancy and strong correlation among some features. Moreover,
the complexity of the classiication stage grows with
the number of features. Therefore, principal component
analysis (PCA) was implemented to reduce the size of the feature vector. PCA is a useful statistical technique that has many applications in ields, such as facial
recognition and image compression, and is widely used to identify patterns in high-dimensional data (Smith, 2002). This technique consists of reducing a feature vector by linear transformation as to lose as little information as possible.
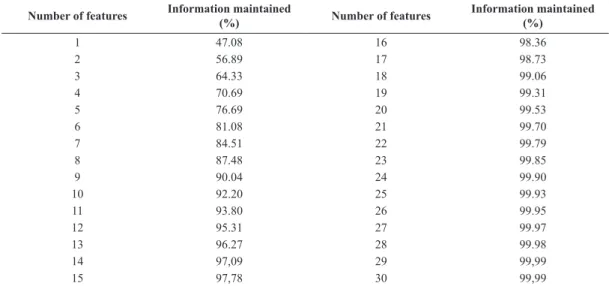
In this work, the PCA technique was applied to
select the best 25 features while retaining 99.93% of the information. Usually, the features are normalized, but in this study this was not necessary because their dynamic range was narrow (most of the features were measured in millivolts and milliseconds). The number of selected features was chosen empirically for a good result with low computational cost. Table 2 and Figure 4 show the results, indicating the percentage
of information preserved by the number of features used in the reduction.
Automatic classiication
For automatic classiication, an artiicial neural
network (ANN) was used, which is a popular
classiication technique based on mathematical
models that simulate biological neural structures and acquires computational capacity through learning and generalization.
The ANN implemented in this work is basically composed of an input layer whose size is the same as the feature vector, two hidden layers with 25 neurons each, and an output layer with the number of neurons equal to the number of heartbeat classes, which in our work was six. A hyperbolic tangent was chosen as an activation function. For network training, an algorithm called backpropagation was chosen, using 1000 epochs (maximum number of interactions during training) with minimum performance gradient of 10-6 and
maximum of 100 validation failures. The coniguration of the ANN was deined empirically after preliminary
analysis of the database signals.
Performance evaluation
The performance of our algorithm was evaluated using statistical measures, such as sensitivity (Se),
speciicity (PP), positive predictive value (PPV), negative predictive value (NPV) and accuracy (Ac),
which are described by the equations below.
100% TP
Se
TP FN
= ×
+ (1)
100% TN
PP
TN FP
= ×
+ (2)
100% TP
PPV
TP FP
= ×
+ (3)
100% TN
NPV
TN FN
= + × (4)
100% TP TN
Ac
TP FP TN FN
+
=× + + + (5)
Where TN, TP, FP and FN indicate the true negatives,
true positives, false positives and false negatives, respectively, obtained from a comparison between diagnoses (which were made by cardiologists) and
the results obtained from the classiier developed
in this study. The computation of such values in a
multiclass context takes into account that each class alone is considered as positive, and the other classes are negative. For example, all normal beats correctly
classiied account for the TP value of the Normal Class and all other beats correctly classiied as not belonging to the normal class account for the TN value of the Other Class. Considering the same example,
FP are the beats from the other classes classiied by
mistake as belonging to the Normal Class, and the
FN are the beats from the normal class classiied as
belonging to the Other Class. In a multiclass context,
the FP and FN values are inluenced negatively by the
number of classes because the mistakes in different classes are added together.
Results
The algorithms implemented were evaluated for
heartbeat detection and classiication performance
on a MIT database. The results were compared
Table 1. List of the morphological characteristics extracted from the two-channel ECG signal.
Index Characteristics Reference Description
1-4 RRI(1:4) Zhang et al. (2014) RR interval of 4 consecutive beats, starting from the 2nd previous beat.
5 RRIavg Zhang et al. (2014) Average of the 10 closest RR intervals.
6 RRIdiv Zhang et al. (2014) Standard deviation of the 10 closest RR intervals.
7 Width Christov et al. (2006) Width of the QRS complex.
8-11 Pp e Pn Christov et al. (2006) Positive and negative maximum of the QRS in both channels.
12-17 Arp, Arn e Ar Christov et al. (2006) Positive area, negative area, and the sum of the two areas under the QRS complex curve in both channels.
18-21 Ima e Imi Christov et al. (2006) The time from the onset of the QRS to the maximum and to the minimum value in both channels.
22-23 S1 Christov et al. (2006) Slope of the curve from the onset until the irst peak of the QRS complex in both channels.
24-25 S2 Christov et al. (2006) Slope of the curve from the irst peak until the second peak of the QRS complex in both channels.
26-27 difft She et al. (2010) Time interval between the maximum and the minimum the QRS
complex in both channels.
28-29 diffdvt She et al. (2010) Maximum slope of the QRS curve in both channels.
30-31 diffqrs She et al. (2010) Amplitude difference between the QRS maximum and minimum in
both channels.
32-51 QRS_amost(1:10) Zhang et al. (2014) 10 samples extracted from the center of the QRS complex in both channels.
52-53 P_amp e P_dur Zhang et al. (2014) Amplitude and duration of the P wave. 54-55 T_amp e T_dur Zhang et al. (2014) Amplitude and duration of the T wave.
56 PR_dur Zhang et al. (2014) Duration of the PR interval.
57 QT_dur Zhang et al. (2014) Duration of the QT interval.
58-77 P_amost(1:10) Zhang et al. (2014) 10 samples from the center of the P wave in both channels. 78-97 ST_amost(1:10) Zhang et al. (2014) 10 samples from the center of ST segment in both channels.
98-99 P_area Zhang et al. (2014) Area under the P-wave curve in both channels.
100-101 T_area Zhang et al. (2014) Area under the T-wave curve in both channels.
102-103 No Christov et al. (2006) Number of samples with amplitude up to 70% of the maximum
value of the signal in both channels.
104-105 Av1 Christov et al. (2006) Sum of the absolute value of the speed (derivative) of the wave in both channels.
106 Freq Saad et al. (2006) Frequency component of higher amplitude in the Fourier transform
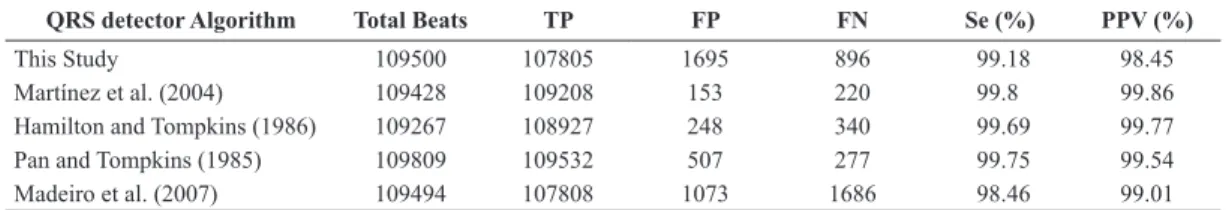
with similar studies using the statistical measures mentioned previously. Table 3 presents the QRS detection results, and Table 4 shows the results of the
neural classiier implemented for a reduced feature
vector size. Each column of the confusion matrix
reports the result of the classiication obtained by the
neural network, while the rows indicate the manual annotation made by the cardiologist.
The results of the neural classiier with and without
the reduced feature vector size were compared to other studies that used the same database, as shown in Table 5. It can be observed that the beat classes employed by other studies are not similar, which is indicated by the number of classes.
Discussion
The work has achieved the proposed objective of developing an algorithm to classify heartbeats from digital ECG signals. The number of beat classes was
deined according to the availability of databases with a signiicant number of examples for each class.
In the future works, larger databases could be selected, following the methodology proposed in this paper.
The digital ECG signal is preprocessed and prepared for the QRS detection and beat segmentation steps. The detection of the QRS complex reached a
sensitivity of 99.18% and a positive predictive value of 98.45%. The segmentation of the ECG signal was
carried out using simple techniques based on amplitude
Table 2. Results obtained by the PCA method presenting the percentage of information that is maintained by a selected number of features.
Number of features Information maintained
(%) Number of features
Information maintained (%)
1 47.08 16 98.36
2 56.89 17 98.73
3 64.33 18 99.06
4 70.69 19 99.31
5 76.69 20 99.53
6 81.08 21 99.70
7 84.51 22 99.79
8 87.48 23 99.85
9 90.04 24 99.90
10 92.20 25 99.93
11 93.80 26 99.95
12 95.31 27 99.97
13 96.27 28 99.98
14 97,09 29 99,99
15 97,78 30 99,99
Figure 4. The results obtained by the PCA method presenting the percentage of information preserved as a function of the number of
and duration thresholds. From this segmentation and location of each beat, a vector of 106 morphological characteristics was extracted directly from the ECG
signal. Because the feature vector is too large to be applied directly to the classiier, it was reduced using the PCA technique. Despite the reduction in the number of features from 106 to 25, the classiication performance did not suffer signiicant decrease.
The results were, in general, very good compared to other published works, reaching an accuracy of 97% and a sensitivity of 95%. It can be observed that the performance is dependent on the beat class
because the classiication complexity is also dependent
on the beat morphology. For example, taking into
consideration only premature ventricular beats, our
algorithm achieved an accuracy of 98.48%. This high
performance was not observed for the premature atrial beats, but the premature ventricular beats are more often associated to a serious heart condition, and for this reason its accurate detection should receive greater priority. Nevertheless, after a close
analysis of the classiication error in the present system, some limitations were identiied, which will be the subject of future work. The most signiicant mistake is regarding the classiication of premature
atrial beats (A). In fact, normal and premature atrial beats have similar morphologies, except for a small difference in the RR interval preceding the current
beat. Another mistake is related to the classiication Table 3. Comparison of the QRS detection performance among different works. Statistical measures employed: True positives (TP), false positives (FP), false negatives (FN), sensitivity (Se) and positive predictive value (PPV).
QRS detector Algorithm Total Beats TP FP FN Se (%) PPV (%)
This Study 109500 107805 1695 896 99.18 98.45
Martínez et al. (2004) 109428 109208 153 220 99.8 99.86
Hamilton and Tompkins (1986) 109267 108927 248 340 99.69 99.77
Pan and Tompkins (1985) 109809 109532 507 277 99.75 99.54
Madeiro et al. (2007) 109494 107808 1073 1686 98.46 99.01
Table 5. Comparison of the classiication performance among previous studies.
Classiication Approach classesNº of (%)Se (%)PP PPV (%) NPV (%) (%)Ac
This study (without PCA) 6 95.89 90.99 95.04 94.9 97.41
This study (with PCA) 6 95.05 90.88 95.11 92.7 96.97
Christov et al. (2006) 5 96.22 98.43 96.64 94.02 97.54
Chazal et al. (2004) 5 85.87 94.35 95.06 52.55 88.58
Chazal and Reilly (2006) 5 93.89 95.52 96.53 71.24 94.8
Ince et al. (2009) 5 95.58 86.76 95.84 84.26 96.63
Kim et al. (2011) 5 97.51 85.08 97.26 96.6 97.94
Llamedo and Martínez (2011) 4 78.00 96.70 95.83 41.71 81.45
Zhang et al. (2014) 4 88.35 93.34 95.31 57.24 90.19
Statistical measures: sensitivity (Se), speciicity (PP), positive predictive value (PPV), negative predictive value (VPN), and accuracy (Ac). Reduction of features method: principal component analysis (PCA).
Table 4. Statistical results of the beat classiication of the test set. Each column of the confusion matrix reports the result of the classiication
obtained by the neural network, while the row indicates the manual annotation made by the cardiologist.
Database Label
Classiication Results Statistical
N L R PB V A Total TP FN TN FP Se
(%) PP (%)
PPV (%)
NPV (%)
Ac (%) N 32404 189 7 39 206 162 33007 32404 603 6305 777 98.17 89.03 97.66 91.27 96.56
L 67 1754 0 9 222 71 2123 1754 369 37731 235 82.62 99.38 88.19 99.03 98.49
R 117 13 960 0 3 161 1254 960 294 38820 15 76.56 99.96 98.46 99.25 99.23
PB 6 10 0 2056 6 0 2078 2056 22 37952 59 98.94 99.84 97.21 99.94 99.8
V 65 22 8 11 754 38 898 754 144 38726 465 83.96 98.81 61.85 99.63 98.48
A 522 1 0 0 28 178 729 178 551 38928 432 24.42 98.9 29.18 98.6 97.55
of right bundle branch block beats (R). This beat
class is not easy to identify in certain leads. Because
the database uses only two leads per record and the
lead coniguration changes among the records, this
may have affected the results. Finally, the reliable
determination of the absence of the P wave remains
a challenge to be addressed because this information
affects the classiication of some beat classes.
This work is being implemented in the Salus platform, which is a web-based environment of the Espírito Santo Telehealth program (Telessaúde ES, 2014). Consequently, each ECG sent through the platform will be processed, and a report will be generated by the algorithm presented here. The report will be used for triage of the patients, so that cardiologists can prioritize the diagnosis of the critical cases with the least delay.
Acknowledgements
The authors acknowledge inancial support from CNPq for this study.
References
Andreão RV, Sarti T, Clestrini J, Schimidt MQ. Automatic triage of electrocardiograms. Global Telemedicine and eHealth Updates. Knowledge Resources. 2013; 6:143-7.
Arif M, Akram MU, Afsar FA. Arrhythmia beat classification using pruned fuzzy k-nearest neighbor classifier. In: International Conference of Soft Computing and Pattern Recognition; 2009. USA: IEEE; 2009. p. 37-42. http:// dx.doi.org/10.1109/SoCPaR.2009.20.
Chazal PD, O’Dwyer M, Reilly RB. Automatic classification of heartbeats using ECG morphology and heartbeat interval features. IEEE Transactions on Biomedical Engineering. 2004; 51(7):1196-206. PMid:15248536. http://dx.doi. org/10.1109/TBME.2004.827359.
Chazal PD, Reilly R. A patient-adapting heartbeat classifier using ECG morphology and heartbeat interval features. IEEE Transactions on Biomedical Engineering. 2006; 53(12 Pt 1):2535-43. PMid:17153211. http://dx.doi.org/10.1109/ TBME.2006.883802.
Christov I, Gómez-Herrero G, Krasteva V, Jekova I, Gotchev A, Egiazarian K. Comparative study of morphological and time-frequency ECG descriptors for heartbeat classification. Medical Engineering & Physics. 2006; 28(9):876-87. PMid:16476566. http://dx.doi.org/10.1016/j. medengphy.2005.12.010.
Goldberger AL, Amaral LAN, Glass L, Hausdorff JM, Ivanov PC, Mark RG, Mietus JE, Moody GB, Peng CK, Stanley HE. PhysioBank, PhysioToolkit, and PhysioNet: components of a new research resource for complex physiologic signals. Circulation. 2000; 101(23):E215-20. PMid:10851218. http:// dx.doi.org/10.1161/01.CIR.101.23.e215.
Hamilton PS, Tompkins W. Quantitative investigation of QRS detection rules using the MIT/BIH arrhythmia database.
IEEE Transactions on Biomedical Engineering. 1986; 33(12):1157-65. PMid:3817849. http://dx.doi.org/10.1109/ TBME.1986.325695.
Igarashi MO. Utilização de filtros para remoção de interferência de sinais de eletrocardiograma [dissertation]. São Paulo: Escola de Engenharia, Universidade Presbiteriana Mackenzie; 2007.
Ince T, Kiranyaz S, Gabbouj M. A generic and robust system for automated patient-specific classification of ECG signals. IEEE Transactions on Biomedical Engineering. 2009; 56(5):1415-26. PMid:19203885. http://dx.doi.org/10.1109/ TBME.2009.2013934.
Kim J, Min SD, Lee M. An arrhythmia classification algorithm using a dedicated wavelet adapted to different subjects. Biomedical Engineering Online. 2011; 10(1):56. PMid:21707989.http://dx.doi.org/10.1186/1475-925X-10-56. Llamedo M, Martínez J. Heartbeat classification using feature selection driven by database generalization criteria. IEEE Transactions on Biomedical Engineering. 2011; 58(3):616-25. PMid:20729162. http://dx.doi.org/10.1109/ TBME.2010.2068048.
Madeiro JPV, Cortez PC, Oliveira FI, Siqueira RS. A new approach to QRS segmentation based on wavelet bases and adaptive threshold technique. Medical Engineering & Physics. 2007; 29(1):26-37. PMid:16500133. http://dx.doi. org/10.1016/j.medengphy.2006.01.008.
Marcolino M, Alkmim MB, Palhares D, Ribeiro AL. Prevalence of normal electrocardiograms in primary care patients: a study by a telemedicine service in Brazil. Global Telemedicine and eHealth Updates. Knowledge Resources. 2012; 5:615-8.
Martínez JP, Almeida R, Olmos S, Rocha AP, Laguna P. A wavelet-based ECG delineator: evaluation on standard databases. IEEE Transactions on Biomedical Engineering. 2004; 51(4):570-81. PMid:15072211. http://dx.doi.org/10.1109/ TBME.2003.821031.
Mohamad FN, Megat Ali MSA, Jahidin AH, Saaid MF, Noor MZH. Principal component analysis and arrhythmia recognition using elman neural network. In: IEEE 4th Control and System Graduate Research Colloquium; 2013. USA: IEEE; 2013. p. 141-146. http://dx.doi.org/10.1109/ ICSGRC.2013.6653292.
Pan J, Tompkins WJ. A real-time QRS detection algorithm. IEEE Transactions on Biomedical Engineering. 1985; 32(3):230-6. PMid:3997178. http://dx.doi.org/10.1109/ TBME.1985.325532.
Saad NM, Abdullah AR, Low YF. Detection of heart blocks in ECG signals by spectrum and time-frequency analysis. Ïn: 4th Student Conference on Research and Development; 2006. USA: IEEE; 2006. p. 61-65. http://dx.doi.org/10.1109/ SCORED.2006.4339309.
Smith LI. A tutorial on principal component analysis. Ithaca: Cornell University; 2002. [cited 2014 Feb 01]. Available from: http://www.cs.otago.ac.nz/cosc453/student_tutorials/ principal_components.pdf
Sparenberg A, Fetter G. A public telecardiology network in southern Brazil: results of phase ii (1st year). Global Telemedicine and eHealth Updates. Knowledge Resources. 2012; 5:598-602.
Telessaúde ES. Espírito Santo Telehealth program [internet]. Vitória: Telessaúde ES; 2014. [cited 2014 Jan 15]. Available from: http://www.telessaude.ifes.edu.br/
Zhang Z, Dong J, Luo X, Choi K, Wu X. Heartbeat classification using disease-specific feature selection. Computers in Biology and Medicine. 2014; 46:79-89. PMid:24529208. http://dx.doi.org/10.1016/j. compbiomed.2013.11.019.
Authors
Rodolfo de Figueiredo Dalvi1*, Gabriel Tozatto Zago2, Rodrigo Varejão Andreão1
1 Department of Electrical Engineering, Instituto Federal do Espírito Santo, Rua Ignácio Higino, 993, Praia da Costa, CEP 29101-087, Vila Velha, ES, Brazil.