ISSN 0104-6632 Printed in Brazil
www.abeq.org.br/bjche
Vol. 27, No. 02, pp. 243 - 251, April - June, 2010
*To whom correspondence should be addressed
Brazilian Journal
of Chemical
Engineering
MASS TRANSFER COEFFICIENTS IN PULSED
PERFORATED-PLATE EXTRACTION COLUMNS
M. Torab-Mostaedi
*, J. Safdari and A. Ghaemi
Nuclear Fuel Cycle Research School, Nuclear Science and Technology Research Institute, Phone: (+9821)88221128, Fax: (+9821)82064355, P.O. Box: 11365-8486,
End of North Karegar Av., Tehran, Iran.
E-mail: [email protected] ; [email protected]
(Submitted: October 21, 2009 ; Revised: December 28, 2009 ; Accepted: February 3, 2010)
Abstract - This study examined the mass transfer performance in a pulsed perforated-plate extraction column with diameter of 50 mm using two different liquid systems. Mass transfer coefficients have been interpreted in terms of the axial diffusion model. The effects of pulsation intensity and dispersed and continuous phase velocities on the mass transfer performance have been investigated. Three different operating regimes, namely mixer-settler, transition, and emulsion regimes, were observed when the input energy was changed. Effective diffusivity is substituted for molecular diffusivity in the Gröber equation for prediction of dispersed phase overall mass transfer coefficients. A single correlation is derived in terms of Reynolds number, Eötvös number and dispersed phase holdup for prediction of the enhancement factor in all operating regimes. The prediction of overall mass transfer coefficients from the presented model is in good agreement with experimental results.
Keywords: Pulsed perforated-plate column; Mass transfer coefficient; Axial diffusion model; Effective
diffusivity; Enhancement factor.
INTRODUCTION
Liquid-liquid extraction is now an important chemical engineering operation used in many industrial processes such as refining of crude petroleum, extraction of metals, and processing of nuclear fuels. The efficiency of liquid-liquid contactors is primarily dependent on the degree of turbulence imparted to the system and the interfacial area available for mass transfer. The rate of mass transfer can be enhanced by pulsating motion imparted to the liquids by an external mechanical or electronic device. Van Dijck (1935) was the first to propose that the efficiency of a perforated-plate column could be improved by pulsing the liquid in the column while keeping the plates stationary. Among the range of industrially used extraction columns, the pulsed perforated-plate column appears to be most widely used, apart from the rotating disc contactor. The pulsed columns have a clear
advantage over other mechanical extractors when processing corrosive or radioactive solutions since the pulsing unit can be remote from the column. The absence of moving mechanical parts in such columns obviates repair and servicing. Because of these advantages, this column has found wide application in a number of industries, including the petrochemical, petroleum, metallurgical and nuclear industries (Hussein et al., 1988).
generally obtained from the measured concentration profiles (or end concentrations) and values of operating variables by using an appropriate simulation model. Traditionally, columns were designed based on simple plug flow behavior, which does not incorporate the non-ideal flow effects caused by axial mixing. The presence of axial mixing results in a concentration jump at the inlet of each phase. The concentration driving potential for mass transfer is therefore reduced, and hence, the extraction efficiency is adversely affected. It was reported that more than 70% of an extraction column height was used to cover the reduction in the mass transfer driving force because of axial dispersion. On this basis, the state of the art for the design of extraction columns is to use the diffusion or backflow model, where one parameter accounts for all deviations from ideal plug flow behavior (Bart et al., 2008).
Although the pulsed perforated-plate column has been used effectively for a number of separation processes, there is still a need for a greater understanding of the design of the column, in particular the calculation of the column height. In a very recent paper, Yadav and Patwardhan (2008) tested the available correlations of mass transfer coefficient against a large set of experimental data gathered from the works of different researchers over the past 50 years. According to their observations, the available correlations can not predict the mass transfer coefficient satisfactory and it is recommended to undertake further pilot scale studies to obtain a suitable correlation for prediction of the mass transfer coefficient in this type of extraction column.
This paper describes an investigation of the mass transfer performance of a pulsed perforated-plate column as a function of pulsation intensity and dispersed and continuous phase velocities. The axial diffusion model has been used to calculate overall mass transfer coefficients. An empirical correlation to predict the enhancement factor in the Gröber equation has been developed based on the experimental results. The present results have been designed to increase the reliability in determining the optimal column height for pulsed perforated-plate columns.
PREVIOUS WORK
The dispersed or continuous phase overall mass transfer coefficient is one of the essential parameters in calculation of extraction column height. There are several equations for prediction of the mass transfer coefficient of a single drop system in motion in a
continuous phase. These equations usually have been based on three theoretical models as follows:
Gröber (1925) proposed the following equation for molecular diffusion in stagnant drops.
2
n d
Od n 2
n 1
d 4 D t
K ln 6 B exp
6t d
∞
=
⎡ ⎛ λ ⎞⎤
= − ⎢ ⎜⎜− ⎟⎟⎥
⎢ ⎝ ⎠⎥
⎣
∑
⎦ (1)Kronig and Brink (1950) presented a model for drops in which the mass transfer mechanism involves both molecular diffusion and laminar diffusion with circulation induced by relative motion of drop and continuous phase as follows:
2 n d
Od n 2
n 1
d 3 64 D t
K ln B exp
6t 8 d
∞
=
⎡ ⎛ λ ⎞⎤
= − ⎢ ⎜− ⎟⎥
⎝ ⎠
⎢ ⎥
⎣
∑
⎦ (2)Handlos and Baron (1957) proposed a model for drops with toroidal internal circulation in which mass transfer mechanism is eddy diffusion. Their equation is given below:
2 n t
Od n
n 1
d V t
K ln 6 B exp
6t 128d(1 )
∞
=
⎡ ⎛ λ ⎞⎤
= − ⎢ ⎜− + κ ⎟⎥
⎝ ⎠
⎢ ⎥
⎣
∑
⎦ (3)An alternative approach uses enhanced molecular diffusivity,RD (also referred to as effective d diffusivity) in the equation for diffusion in rigid spheres. The resulting expression for the mass transfer coefficient, given by Johnson and Hamielec (1960), is the following equation.
2
n d
Od n 2
n 1
d 4 RD t
K ln 6 B exp
6t d
∞
=
⎡ ⎛ λ ⎞⎤
= − ⎢ ⎜⎜− ⎟⎟⎥
⎢ ⎝ ⎠⎥
⎣
∑
⎦ (4)Johnson and Hamielec(1960) considered only the first term of the series in Equation (4) and determined R values. Calculated results were compared with Equation (5).
t
d
dV R
2048D (1 )
=
+ κ (5)
This is based on Handlos and Baron’s effective diffusivity, but the agreement with the experimental data was unsatisfactory.
Mass Transfer Coefficients in Pulsed Perforated-Plate Extraction Columns 245
Brazilian Journal of Chemical Engineering Vol. 27, No. 02, pp. 243 - 251, April - June, 2010
2 2
c t c
1 R 0.003( dV / )
1
⎛ ⎞
= ρ μ ⎜ ⎟
+ κ
⎝ ⎠ (6)
Steiner (1986) used Equation (4) reduced to the first term of the summation series and evaluated R values on the basis of data from nine sources. The following correlation was obtained:
0.89 0.43 0.23
d
1 R 1 0.177 Re Sc
1
⎛ ⎞
= + ⎜ + κ⎟
⎝ ⎠ (7)
Steiner (1986) has also correlated the drop mass transfer coefficient data for a spray column in terms of the enhancement factor R in the form:
1.42 5
0.12 2
0.67 32
d
2 Re R 5.56 10
1
g d
Sc (1 )
− ⎛ ⎞
= × ⎜ + κ⎟
⎝ ⎠
⎛ Δρ ⎞ × − ϕ
⎜ ⎟
⎜ σ ⎟
⎝ ⎠
(8)
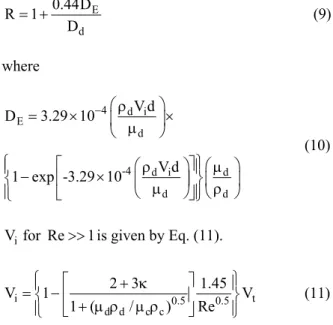
This is then used in Equation (4) to calculate Kod. Temos et al. (1993) presented the relation between eddy diffusivity and molecular diffusivity in a simple way, as shown in Equations (9) and (10).
E
d
0.44D R 1
D
= + (9)
where
4 d i
E
d
-4 d i d
d d
V d D 3.29 10
V d 1 exp -3.29 10
− ⎛ρ ⎞
= × ⎜ ⎟×
μ
⎝ ⎠
⎧ ⎡ ⎛ρ ⎞ ⎛ ⎞⎤⎫ μ
⎪ − × ⎪
⎨ ⎢ ⎜⎝ μ ⎟ ⎜ ⎟⎠ ⎝ ⎠⎥⎬ ρ
⎪ ⎣ ⎦⎪
⎩ ⎭
(10)
i
V for Re>>1is given by Eq. (11).
i 0.5 0.5 t
d d c c
2 3 1.45
V 1 V
1 ( / ) Re
⎧ ⎡ + κ ⎤ ⎫
⎪ ⎪
= −⎨ ⎢ ⎥ ⎬
+ μ ρ μ ρ
⎪ ⎣ ⎦ ⎪
⎩ ⎭ (11)
Bahmanyar et al. (2008) proposed the following equation for prediction of effective diffusivity in pulsed perforated plate extraction columns:
9 eff .
D =4.5151 10 exp(0.0067 Re )× − (12)
However, this equation does not have enough accuracy for column design because they obtained the mass transfer coefficients without correction for axial mixing.
Amanabadi et al. (2009) presented a correlation equation for prediction of effective diffusivity in rotating disc contactor (RDC) as follows:
9 0.65 eff .
D =0.4755 10× − Re (13)
Torab-Mostaedi and Safdari (2009) proposed an empirical correlation for prediction of the enhancement factor in pulsed packed extraction columns as follows:
0.50 0.94 0.80
c
R= −2.57 1326.07 Re+ Sc− (1+ κ)− (14)
EXPERIMENTAL
The main column section consists of a 1.5m long glass tube with 50mm internal diameter, enclosing a stack of sieve plates. Below the plate section was a 150mm expanded glass section enclosing a stainless-steel solvent distributor supported on a piston-type pulsing unit, which imparted a sinusoidal motion to the fluids of the column. In total, 30 SS sieve plates were arranged alternately and spaced 50mm apart in the column. They had a 2mm perforation diameter and 22.7% free area.The inlets and outlets of the column were connected to four tanks, each of 50 liters capacity. The flow rates of the two phases were indicated by two rotameters. The column geometry is listed in Table 1.
Table 1: Geometrical characteristics of the column used
Column height (cm) 150
Column diameter (cm) 5
Compartment height (cm) 5
Hole diameter (mm) 2
Hole pitch (mm) 4
Plate thickness (mm) 1.2
Fractional free area (-) 0.227
liquid systems used in these experiments are listed in Table 2. It should be noted that, under mass transfer conditions, a degree of uncertainty surrounds the estimation of physical properties (particularly interfacial tension), since these vary not only with the inlet solute concentrations, but also along the column. In the present study, the values of physical properties have been assumed to correspond to the mean values of acetone concentration in the continuous and dispersed phases. The mean value of acetone concentration was obtained by averaging the values obtained at the inlet and outlet of the column. Liquid-liquid equilibrium data of the liquid systems were taken from Míšek et al. (1985).
Table 2: Physical properties of liquid systems at 20oC (Míšek et al. (1985))
Physical property Toluene-acetone-water
n-Butyl acetate-acetone-water 3
c(kg / m )
ρ 994.4-995.7 994.3-995.8
3 d(kg / m )
ρ 864.4-865.2 879.6-881.4
c(mPa.s)
μ 1.059-1.075 1.075-1.088
d(mPa.s)
μ 0.574-0.584 0.723-0.738
(mN / m)
σ 27.5-30.1 12.4-13.2
2 c
D (m / s) 1.09-1.14×10⁻⁹ 1.01-1.06×10⁻⁹
2 d
D (m / s) 2.7-2.8×10⁻⁹ 2.16-2.18×10⁻⁹
In starting a given run, the solvent phase and water were mutually saturated, after which solute was added to the aqueous phase to give a concentration of about 3.5%wt of acetone. The amplitude and frequency of pulsation were then adjusted to the desired values and, after filling the column with the aqueous phase, the organic dispersed phase was introduced. The interface position was then maintained at the desired height by using an optical sensor and the system was allowed to reach steady state, which usually necessitated three or four changes of the column volume. Samples of each phase at their exit points were then taken, and the concentration of acetone in each phase was measured by gas chromatography.
In practice, the drops in extraction columns have a range of sizes and the Sauter mean diameter, d32, is normally used as a single measure of the drop size. After reaching steady state, several photographs of the droplets were also taken at different positions along the column by using a Sony DSC-F828 digital camera. Drop dimensions were then determined using AutoCAD software. Approximately 200 drops per photo were analyzed. Finally, the drops were classified into 0.1 mm size intervals, which were used to calculate the Sauter mean drop diameter, d32, as follows:
n 3 i i i 0
32 0
2 i i i 0
n d d
n d
=
=
=
∑
∑
(15)At the end of a run, the inlet and outlet flows were stopped simultaneously and the dispersion was allowed to coalesce at the interface, after which the holdup was obtained by determining the change of interfacial height.
Visual observations of the column in operation with the toluene-acetone-water system showed that three regimes, mixer-settler, transition, and emulsion, occurred depending on the flow rates and the pulsation intensity. The mixer-settler regime was indicated by a stepwise movement of droplets within the column. The transition regime was characterized by a non-uniform drop size distribution and no coalescence of dispersed phase drops. At higher pulsation intensities, a transition to the emulsion regime occurred, as revealed by an even dispersion of solvent drops in the column. For the butyl acetate-acetone-water system, the transition and emulsion regimes were only observed for the operating conditions that were investigated.
MODELING
The mass transfer data for the present column are interpreted in terms of the axial diffusion model as described by Pratt and Stevens (1992).
Based upon the axial diffusion model and mass balance in the column, over the differential elements of the column with total effective height H, the equation set for the steady state process was established as follows, under the constant superficial velocities Vc and Vd at any given pulse amplitude and frequency:
* Oc c
1 x
x N (x x ) 0
Z Pe Z
⎛ ⎞
∂ − ∂ + − =
⎜ ⎟
∂ ⎝ ∂ ⎠ (16)
* c Oc
d d
1 y V
y N (x x ) 0
Z Pe Z V
⎛ ⎞
∂ + ∂ − − =
⎜ ⎟
∂ ⎝ ∂ ⎠ (17)
where Pec =HV / Ec c, Ped=HV / Ed d, Z=h / H. Note that in eqs. (16) and (17) Oc Oc
c
K aH N
V
=
Mass Transfer Coefficients in Pulsed Perforated-Plate Extraction Columns 247
Brazilian Journal of Chemical Engineering Vol. 27, No. 02, pp. 243 - 251, April - June, 2010
In the current study, dispersed phase axial dispersion was assumed to be negligible, with the continuous phase axial mixing coefficient calculated by the following equation given by Kumar and Hartland (1989):
0.37 0.11
c d c c
1 2
c d
0.61 0.36 1.05
c o
1/2
E V
k exp(k )
d h
h
( h) h
−
−
∗ ∗
⎛ ⎞
Δρ= ψ ⎛ μ ⎞ μ
⎜ ⎟
⎜ ⎟
μ ⎝ σ ⎠ ⎝ ⎠μ
⎛ μ ⎞ ⎛ ⎞ ⎛Δρ ⎞
⎜ σΔρ ⎟ ⎜ ⎟⎝ ⎠ ⎜ρ ⎟
⎝ ⎠ ⎝ ⎠
(18)
with k1= 46.15 and k2= 0.80 for Af < 2(Af)m and k2= 0.34 for Af > 2(Af)m.
Where (Af)m is the pulsation intensity at the boundary between the mixer-settler and transition regimes. It is calculated by the following equation:
(
)
0.333 1/4 3/4
m d
(Af ) =9.69 10× − σΔρ ε μ/ (m / s) (19)
and ψ is the agitation group. For Af < 2(Af)m, the agitation group is defined by:
3 2
m m
m m
(Af ) - (Af ) (Af ) - (Af )
(Af ) (Af )
⎡ ⎤ ⎡ ⎤
ψ =⎢ ⎥ ⎢− ⎥
⎣ ⎦ ⎣ ⎦ (20)
whereas for Af > 2(Af)m, it is defined as follows:
[
Af 2(Af )m]
/ (Af )mψ = − (21)
Equation (18) can be used for calculation of the continuous phase axial mixing in the mixer-settler, transition, and emulsion regions of operation. This correlation was derived based on 992 data points with and without mass transfer for 28 liquid-liquid systems from 13 different sources and it is applicable for a wide range of operating conditions.
The three boundary conditions are as follows: At the top of the column (Z=0):
x
dx
Pe (x x) dZ
− = D− (22)
At the bottom of the column (Z=1): dx
0
dZ= (23)
y=yD (24)
On this basis, by using the axial dispersion coefficient, hydrodynamic data (including holdup and d32), and appropriate boundary conditions, overall mass transfer coefficients are calculated from Equations (16) and (17) by using MATLAB software.
RESULTS AND DISCUSSION
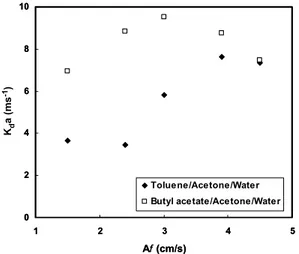
The effect of pulsation intensity on volumetric overall mass transfer coefficients is given in Fig. 1. For toluene-acetone-water, the volumetric overall mass transfer coefficient decreases with increasing pulsation intensity in the mixer-settler regime of operation. The experiments showed that dispersed phase holdup decreases with increasing frequency towards the mixer-settler regime, until a minimum is reached, corresponding to the beginning of the transition regime. The interfacial area decreases with decrease in holdup and, consequently, volumetric coefficients will decrease. Thereafter, the volumetric overall mass transfer coefficient increases with the increase in pulsation intensity. The drop diameter decreases with an increase in the pulsation intensity and holdup increases with an increase in pulsation intensity. The interfacial area increases with both effects and the volumetric overall mass transfer coefficient will increase.
However, in the emulsion regime of operation, the volumetric overall mass transfer coefficient decreases once again with pulsation intensity due to the effect of axial mixing. At high pulsation intensity, axial mixing increases due to the turbulence in the continuous phase, high population density of small drops, and high values of holdup.
interfacial tension), because breakup of the dispersed phase drops into smaller ones is limited for the latter system due to its lower interfacial tension.
The effect of dispersed phase velocity on Kda is shown in Figure 2. As can be seen in this figure, dispersed phase velocity does not have a significant effect on the column performance. Dispersed phase holdup increases with increasing dispersed phase velocity, while drop diameter varies little with dispersed phase velocity. So the interfacial area increases with increase in holdup. Moreover, the results showed that the overall mass transfer coefficient decreases with an increase in dispersed phase velocity. The volumetric overall mass transfer coefficient increases with increasing interfacial area and decreases with decreasing overall mass transfer
coefficient. In this study, it was observed that the former may be compensated by the latter and the column performance varies little with dispersed phase velocity.
The effect of continuous phase velocity on Kda is shown in Fig. 3. The dispersed phase holdup increases with an increase in continuous phase velocity due to the reduction of relative velocity between the drops and continuous phase. The interfacial area increases with increase in dispersed phase holdup when drop size is constant. The overall mass transfer coefficient also increases with an increase in continuous phase velocity. The column performance increases with increases in both the interfacial area and the overall mass transfer coefficients. 0 2 4 6 8 10
1 2 3 4 5
Af (cm /s)
Kd a ( m s -1) Toluene/Acetone/Water Butyl acetate/Acetone/Water 0 2 4 6 8 10
1 2 3 4 5
Af (cm/s)
Kd a (m s -1) 0 2 4 6 8 10
1 2 3 4 5
Af (cm /s)
Kd a ( m s -1) Toluene/Acetone/Water Butyl acetate/Acetone/Water 0 2 4 6 8 10
1 2 3 4 5
0 2 4 6 8 10
1 2 3 4 5
Af (cm/s) Af (cm/s)
Kd
a
(m
s
-1)
Figure 1: Effect of pulsation intensity on volumetric overall mass transfer coefficient.
0 2 4 6 8 10 12 14
0 0.5 1 1.5 2 2.5
Vd (m m /s)
Kd a ( m s -1)
Toluene/Acetone/Water, Af=2.4 cm /s Toluene/Acetone/Water, Af=3.9 cm /s Butyl acetate/Acetone/Water, Af=1.5 cm /s Butyl acetate/Acetone/Water, Af=3 cm /s
0 2 4 6 8 10 12 14
0 0.5 1 1.5 2 2.5
Vd(mm/s)
Kd a ( m s -1) 0 2 4 6 8 10 12 14
0 0.5 1 1.5 2 2.5
Vd (m m /s)
Kd a ( m s -1)
Toluene/Acetone/Water, Af=2.4 cm /s Toluene/Acetone/Water, Af=3.9 cm /s Butyl acetate/Acetone/Water, Af=1.5 cm /s Butyl acetate/Acetone/Water, Af=3 cm /s
0 2 4 6 8 10 12 14
0 0.5 1 1.5 2 2.5
Vd(mm/s)
Kd a ( m s -1) 0 2 4 6 8 10 12 14
0 0.5 1 1.5 2 2.5
0 2 4 6 8 10 12 14
0 0.5 1 1.5 2 2.5
Vd(mm/s)
Vd(mm/s)
Kd a ( m s -1) Kd a ( m s -1) 0 2 4 6 8 10 12 14 16
0 0.5 1 1.5 2 2.5
Vc (m m /s) Kd a ( m s -1)
Toluene/Acetone/Water, Af=2.4 cm /s Toluene/Acetone/Water, Af=3.9 cm /s Butyl acetate/Acetone/Water, Af=1.5 cm /s Butyl acetate/Acetone/Water, Af=3 cm /s
0 2 4 6 8 10 12 14 16
0 0.5 1 1.5 2 2.5
Vc(mm/s)
Kd a ( m s -1) 0 2 4 6 8 10 12 14 16
0 0.5 1 1.5 2 2.5
Vc (m m /s) Kd a ( m s -1)
Toluene/Acetone/Water, Af=2.4 cm /s Toluene/Acetone/Water, Af=3.9 cm /s Butyl acetate/Acetone/Water, Af=1.5 cm /s Butyl acetate/Acetone/Water, Af=3 cm /s
0 2 4 6 8 10 12 14 16
0 0.5 1 1.5 2 2.5
Vc(mm/s)
Kd a ( m s -1) 0 2 4 6 8 10 12 14 16
0 0.5 1 1.5 2 2.5
0 2 4 6 8 10 12 14 16
0 0.5 1 1.5 2 2.5
Vc(mm/s)
Kd a ( m s -1)
Vc(mm/s)
Vc(mm/s)
Kd a ( m s -1) Kd a ( m s -1)
Figure 2: Effect of dispersed phase velocity on volumetric overall mass transfer coefficient.
Mass Transfer Coefficients in Pulsed Perforated-Plate Extraction Columns 249
Brazilian Journal of Chemical Engineering Vol. 27, No. 02, pp. 243 - 251, April - June, 2010
PREDICTIVE CORRELATION FOR THE ENHANCEMENT FACTOR
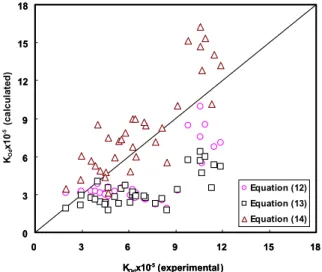
The experimental data of the dispersed phase overall mass transfer coefficient are compared with theoretical models and the models derived for prediction of the enhancement factor in single drop systems and in different types of extraction columns. Figures (4) and (5) show the comparison of experimental data with those calculated by applying the previous equations. As can be seen in Figure (4), the equations obtained for single drop systems show very large deviation from the experimental results because, within an extraction column, drops undergo coalescence and splitting, distortion and erratic motion, all affected by the presence of plates, baffles, packings or agitators. Figure (5) indicates that the equations derived from various mechanical extraction columns give better results, but these models also do not have enough accuracy for prediction of mass transfer coefficients in pulsed perforated-plate extraction column.
For this reason, it is of paramount importance to derive a new correlation for prediction of overall mass transfer coefficient in pulsed perforated-plate extraction columns. Therefore, experimental values of dispersed phase overall mass transfer coefficients were used in Equation (4) to define the enhancement factor (R). This equation was reduced to its first term in determining the R values. After calculating the experimental values of the enhancement factor for the investigated operating conditions, the following equation is derived in terms of Reynolds number, Eötvös number, and dispersed phase holdup by using the least squares method.
0.13 0.92
R 5.33 97.97 Re (1 )Eo 17.24 Re 305.95
−
= − + − φ
< <
(25)
where:
32 slip c
c
d V
Re= ρ
μ (26)
32
g d Eo= Δρ
σ
(27)
in which d32 is the Sauter mean diameter and Vslip is the slip velocity between the two phases through the column. Since the dispersed and continuous phases flow counter-currently through the column, the slip velocity, Vslip , between the phases is obtained as follows: d c slip V V V (1 )
= φ + − φ (28)
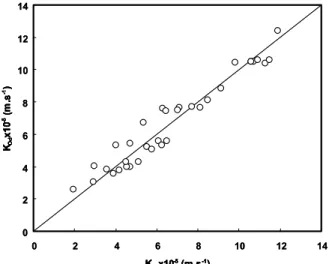
The calculated values of the enhancement factor are then used in Equation (4) to calculate the dispersed phase overall mass transfer coefficients. The comparison of experimental data with those calculated by the present model is shown in Figure 6. This figure shows that the experimental results are in very good agreement with calculated values obtained by applying Equations (4) and (25). The presented equation reproduces experimental results with an average relative deviation of 10.67%.
0 4 8 12 16 20 24
0 4 8 12 16 20 24
KOdx10
-5 (experim ental)
KO
d
x
1
0
-5 (
c a lc u la te d ) Grober Eq. Kronig and Brink Eq. Johnson and Ham ielec Eq. Boyadziev Eq.
Tem os et al. Eq. 0 4 8 12 16 20 24
0 4 8 12 16 20 24
KOdx10
-5(experimental )
KO d x 1 0 -5 (c a lc u la te d ) 0 4 8 12 16 20 24
0 4 8 12 16 20 24
KOdx10
-5 (experim ental)
KO
d
x
1
0
-5 (
c a lc u la te d ) Grober Eq. Kronig and Brink Eq. Johnson and Ham ielec Eq. Boyadziev Eq.
Tem os et al. Eq. 0 4 8 12 16 20 24
0 4 8 12 16 20 24
0 4 8 12 16 20 24
0 4 8 12 16 20 24
KOdx10
-5(experimental )
KOdx10
-5(experimental )
KO d x 1 0 -5 (c a lc u la te d ) 0 3 6 9 12 15 18
0 3 6 9 12 15 18
KOdx10-5 (experim ental)
KO
d
x
1
0
-5 (
c a lc u la te d ) Equation (12) Equation (13) Equation (14) 0 3 6 9 12 15 18
0 3 6 9 12 15 18
KOdx10
-5(experimental )
KO d x 1 0 -5 (c a lc u la te d ) 0 3 6 9 12 15 18
0 3 6 9 12 15 18
KOdx10-5 (experim ental)
KO
d
x
1
0
-5 (
c a lc u la te d ) Equation (12) Equation (13) Equation (14) 0 3 6 9 12 15 18
0 3 6 9 12 15 18
0 3 6 9 12 15 18
0 3 6 9 12 15 18
KOdx10
-5(experimental )
KOdx10
-5(experimental )
KO d x 1 0 -5 (c a lc u la te d )
Figure 4: Comparison of experimental results with previous models in single drop systems
0 2 4 6 8 10 12 14
0 2 4 6 8 10 12 14
KOdx10-5 (m .s-1)
KO
d
x
1
0
-5 (
m
.s
-1)
0 2 4 6 8 10 12 14
0 2 4 6 8 10 12 14
KOdx10
-5(m.s-1)
KO
d
x
1
0
-5
(m
.s
-1)
0 2 4 6 8 10 12 14
0 2 4 6 8 10 12 14
KOdx10-5 (m .s-1)
KO
d
x
1
0
-5 (
m
.s
-1)
0 2 4 6 8 10 12 14
0 2 4 6 8 10 12 14
KOdx10
-5(m.s-1)
KO
d
x
1
0
-5
(m
.s
-1)
0 2 4 6 8 10 12 14
0 2 4 6 8 10 12 14
KOdx10
-5(m.s-1)
KO
d
x
1
0
-5
(m
.s
-1)
KOdx10
-5(m.s-1)
KOdx10
-5(m.s-1)
KO
d
x
1
0
-5
(m
.s
-1)
KO
d
x
1
0
-5
(m
.s
-1)
Figure 6: Comparison of experimental values of the dispersed phase overall mass transfer coefficient with calculated ones by using Equations (4) and (25)
CONCLUSIONS
This paper presented a study of the mass transfer performance for a 50 mm diameter pulsed perforated-plate extraction column. The axial dispersion model was used to interpret the mass transfer performance of the column. The experiments showed that the column performance increased with an increase in both pulsation intensity and continuous phase velocity, while it varied little with dispersed phase velocity. A new correlation was derived for prediction of the enhancement factor in terms of Reynolds number, Eötvös number, and dispersed phase velocity. This equation can be used for design and scale-up purposes of this type of extraction column.
NOMENCLATURE
a interfacial area m2/m3
A pulse amplitude m
Bn nth coefficient in Equations (1-4)
(-) d32 Sauter mean drop diameter m D molecular diffusivity m2/s Deff effective diffusivity m2/s DE eddy diffusivity m2/s do diameter of holes in
perforated plate
m Eö Eötvös number 2
32
(gd Δρ σ/ ) (-) E axial mixing coefficient m2/s
f frequency s-1
g acceleration due to gravity m/s2
h center-to-center plate spacing
m h* standard plate spacing =0.05 m H effective height of the
column
m k1, k2 constants, see Equation (18) (-) K overall mass transfer
coefficient
m/s
m distribution ratio (-)
NOx number of 'true' transfer unit (-)
Pe Peclet number (-)
Q flow rate of the continuous or dispersed phase
m3/s R enhancement factor for mass
transfer
(-)
Re Reynolds number (-)
Scc Schmidt number (-)
t time s
V superficial velocity (-)
Vslip slip velocity m/s
Vt terminal velocity of droplet m/s x mass fraction of acetone in
continuous phase
(-) x* equilibrium mass fraction of
acetone in continuous phase corresponding to dispersed phase
(-)
y mass fraction of acetone in dispersed phase
(-)
Greek Letters
n
λ nth coefficient if Equations (1-4)
Mass Transfer Coefficients in Pulsed Perforated-Plate Extraction Columns 251
Brazilian Journal of Chemical Engineering Vol. 27, No. 02, pp. 243 - 251, April - June, 2010
ρ density kg/m3
*
ρ density of water at 20ºC=998
kg/m3
Δρ density difference between phases
kg/m3
κ viscosity ratio(μ μd/ c) (-)
μ viscosity Pa.s
σ interfacial tension N/m
ϕ holdup of dispersed phase (-)
ψ agitation group, see Equations (20) and (21)
(-)
ε fractional free area (-)
Subscripts
c continuous phase d dispersed phase O overall value x x-phase (continuous phase
in present case)
y y-phase (dispersed phase in present case)
Superscripts
* equilibrium value º inlet to column
REFERENCES
Amanabadi, M., Bahmanyar, H., Zarkeshan, Z. and Mousavian, M. A., Prediction of Effective Diffusion Coefficient in Rotating Disc Columns and Application in Design. Chin. J. Chem. Eng. 17, pp. 366-372 (2009).
Bahmanyar, H., Nazari, L. and Sadr, A., Prediction of Effective Diffusivity and Using of it in Designing Pulsed Sieve Extraction Columns. Chem. Eng. Process. 47, pp. 57-65 (2008).
Bart, H. -J., Drumm, C. and Attarakih, M. M., Process Intensification with Reactive Extraction Columns. Chem. Eng. Process. 47, pp. 745-754 (2008).
Gröber, H., Die Erwärmung and Abkühlung einfacher Geometrischer Körper. Z Var Dtsch
Ing. 69, pp. 705-711 (1925).
Handlos, A. E. and Baron, T., Mass and Heat Transfer from Drops in Liquid-Liquid Extraction. AIChE J. 3, pp. 127-136 (1957).
Hussain, A. A., Liang, T-B. and Slater, M. J., Characteristic Velocity of Drops in a Liquid-Liquid Extraction Pulsed Sieve Plate Column. Chem. Eng. Res. Des. 66, pp. 541-554 (1988). Jahya, A. B., Pratt, H. R. C. and Stevens, G. W., Mass
Transfer Studies for a Pulsed Disc and Doughnut Extraction Column. MINPREX 2000, Melbourne, Vic, 11-13 September, pp. 281-284 (2000).
Johnson, A. I. and Hamielec, A. E., Mass Transfer inside Drops. AIChE J. 6, pp. 145-149 (1960). Kumar, A. and Hartland, S., Prediction of
Continuous-Phase Axial Mixing Coefficients in Pulsed Perforated-Plate Extraction Columns. Ind. Eng. Chem. Res. 28, pp. 1507-1513 (1989). Kumar, A. and Hartland, S., Correlation for
Prediction of Mass Transfer Coefficients in Single Drop System and Liquid-Liquid Extraction Columns. Chem. Eng. Res. Des. 77 (Part A), pp. 372-384 (1999).
Míšek, T., Berger, R. and Schröter, J., Standard Test Systems for Liquid Extraction Studies. EFCE Publ. Ser. 46 (1985).
Pratt, H. R. C. and Stevens, G. W., Axial Dispersion, in Thornton, J.D. (Ed.), Science and Practice in Liquid-Liquid Extraction. Oxford University Press, pp. 461-492 (1992).
Steiner, L., Mass Transfer Rates from Single Drops and Drop Swarms. Chem. Eng. Sci, 41, pp. 1979-1986 (1979-1986).
Temos, J., Pratt, H. R. C. and Stevens, G. W., Comparison of Tracer and Bulk Mass Transfer Coefficients for Droplets. In Proceedings of International Solvent Extraction Conference Elsevier, Amsterdam, 93, pp. 1770-1777 (1993). Torab-Mostaedi, M. and J. Safdari, Prediction of
Mass Transfer Coefficients in a Pulsed Packed Extraction Column Using Effective Diffusivity. Braz. J. Chem. Eng. 26, pp. 685-694 (2009). Yadav, R. L. and A. W. Patwardlan, Design Aspects