ISSN 0104-6632 Printed in Brazil
www.abeq.org.br/bjche
Vol. 25, No. 03, pp. 473 - 481, July - September, 2008
Brazilian Journal
of Chemical
Engineering
MASS TRANSFER COEFFICIENTS IN A HANSON
MIXER-SETTLER EXTRACTION COLUMN
M. Torab-Mostaedi
1,2*, S. J. Safdari
2, M. A. Moosavian
1and M. Ghannadi Maragheh
21
School of Chemical Engineering, College of Engineering, University of Tehran, Phone: (+9821) 22832637, Fax: (+9821) 44216659, 16 Azar Avenue,
P.O. Box: 11365-4563, Tehran, Iran. E-mail: [email protected] 2
Nuclear Science Research School, Nuclear Science and Technology Research Institute, Tehran, Iran.
(Received: August 12, 2007 ; Accepted: January 14, 2008)
Abstract - The volumetric overall mass transfer coefficients in a pilot plant Hanson mixer-settler extraction
column of seven stages have been measured using toluene-acetone-water system. The effects of agitation speed and dispersed and continuous phases flow rates on volumetric overall mass transfer coefficients have been investigated. The results show that the volumetric overall mass transfer coefficient increases with increase in agitation speed and reaches a maximum. After having reached its maximum, it falls with further increase in agitation speed. It was found that the volumetric overall mass transfer coefficient increases with
increase in dispersed phase flow rate, while it decreases with increase in continuous phase flow rate.By using
interfacial area, the overall mass transfer coefficients for continuous and dispersed phases are determined from volumetric coefficients. An empirical correlation for prediction of the continuous phase overall mass transfer coefficient is proposed in terms of Sherwood and Reynolds numbers. Also the experimental data of the column investigated are compared with data for various extraction columns. Comparison between theoretical models and experimental results for the dispersed phase mass transfer coefficient shows that these models do not have enough accuracy for column design. Using effective diffusivity in the Gröber equation results in more accurate prediction of overall mass transfer coefficient. The prediction of overall mass transfer coefficients from the presented equations is in good agreement with experimental results.
Keywords:Overall Mass Transfer Coefficient; Hanson Mixer-Settler; Axial Mixing; Holdup; Effective Diffusivity.
INTRODUCTION
Liquid-liquid extraction processes are widely used in different industries especially in rare earth metal separation and hydrometallurgical processes. From industrial point of view, an extraction column of high performance which achieves large throughput and a high mass transfer rate is desirable. Mechanical agitation can promote the mass transfer rate and extractor efficiency because it increases interfacial area between the two immiscible liquids and new surfaces and high turbulence which increase mass transfer coefficients (Takahashi et al., 1993a; Horvoth and Hartland, 1985).Varieties of stirring extractors are known such as MIXCO, Kühni, RDC, ARD, QVF and mixer-settlers. As drop size
decreases with agitation speed, however, the relative velocity between the dispersed phase and continuous phase decreases, which makes the throughput small (Kirou et al., 1988). Moreover, axial mixing, which lowers the stage efficiency, becomes significant at high agitation speed. Reduction or even elimination of the axial mixing is the key to higher stage efficiency and is therefore of interest in column design (Horvoth and Hartland, 1985).
columns, the dispersed phase is coalesced more completely and high stage efficiency can be achieved because of back-mixing. According to the manner of putting the mixer and the settler side by side and how to separate the two phases in the settler, many types of mixer-setter extraction columns have been reported. Scheibel (1948) set up the mixing part and the packing part alternately to promote drop coalescence in the packing part. For the same purpose, Steiner et al. (1984) used a three dimensional lattice as a partition of the mixing stages. Horvath and Hartland (1985) achieved high stage efficiency with a mixer-settler extraction column in which the interstage mixing was extremely small, while the throughput of the column was also small. Takahashi et al. proposed a mixer-settler extraction column (MS column) in which a mixer and a settler were in vertical arrangement in each stage, and showed that both the throughput (Takahashi et al., 1993b) and stage efficiency (Takahashi et al., 1993a) increased with agitation speed. Wirz (1968) proposed a column with a mixer at the center of the column and a large settling space around the mixer. Mixer-settler extraction columns have a lot of advantages such as high efficiency, low load room, good contacting, low axial mixing and ability to handle a large number of stages.
An important step in the design of liquid-liquid extraction column is to determine the column height in the case of differential extractors such as spray and packed columns or the number of stages in stage-wise extractors such as Kühni and mixer-settler extraction columns. Therefore, to design an extraction column, the mass transfer characteristics should be known and it is usually not possible to design extraction equipment accurately without some experimental information about mass transfer conditions. In a usual extraction column, the diameter of dispersed drops and the dispersed phase holdup depend on vertical position of the column (Sarker and Phillips, 1985; Nii et al., 1997; Kirou et al., 1988) and accurate estimation of these variables is difficult (Tsouris et al., 1994). This makes it difficult to determine the mass transfer coefficients in an extraction column. Moreover, very little is known about the effect of agitation, superimposed on the flow of the two phases in an extraction column, on the enhancement of mass transfer coefficients (Kumar and Hartland, 1999).
In the present work, the volumetric overall mass transfer coefficients of a pilot plant Hanson mixer-settler extraction column have been measured and the overall mass transfer coefficients are determined by use of the interfacial area. The effects of agitation speed and dispersed and continuous phases flow rates on volumetric overall mass transfer coefficients
are investigated and an empirical expression for prediction of continuous phase overall mass transfer
coefficients is proposed. Also, by using an
enhancement factor in the Gröber equation, dispersed phase overall mass transfer coefficients are predicted accurately.
THEORETICAL MODELS
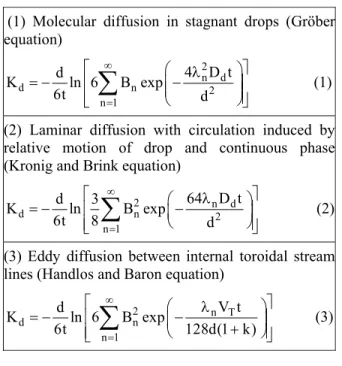
Several equations have been presented in past studies for calculation of the overall mass transfer coefficient of dispersed phase. However, results have usually been considered in the light of three mechanisms of mass transfer inside drops. The three mechanisms commonly considered to determine the mass transfer rate of solute in a drop are molecular diffusion in a stagnant spherical drop (Gröber (1925)), laminar diffusion with circulation induced by relative motion of drop and continuous phase (Kronig and Brink (1950)) and eddy diffusion between internal toroidal stream lines (Handlos and Baron (1957)). Governing equations are summarized in Table 1. Although small drops tend to be subject to molecular diffusion rate control and large drops may exhibit Handlos-Baron behavior, criteria of transition between mechanisms of behavior based on Reynolds or Weber numbers or other factors do not appear to be reliable.
Table 1: Three proposed mechanisms of dispersed phase overall mass transfer coefficient
(1) Molecular diffusion in stagnant drops (Gröber equation)
2 n d
d n 2
n 1
4 D t
d
K ln 6 B exp
6t d
∞
=
λ
= − −
∑
(1)(2) Laminar diffusion with circulation induced by relative motion of drop and continuous phase (Kronig and Brink equation)
2 n d
d n 2
n 1
64 D t
d 3
K ln B exp
6t 8 d
∞
=
λ
= − −
∑
(2)(3) Eddy diffusion between internal toroidal stream lines (Handlos and Baron equation)
2 n T
d n
n 1
V t d
K ln 6 B exp
6t 128d(1 k)
∞
=
λ
= − − +
∑
(3)diffusivity) in the equation for diffusion in rigid spheres. The resulting expression for the mass transfer coefficient is given by (Calderbank and Korchinski, 1956):
2 n d
d n 2
n 1
4 RD t
d
K ln 6 B exp
6t d
∞
=
λ
= − −
∑
(4)Effective diffusivity contains the effect of all known and unknown parameters which play an important role in calculating the exact value of mass transfer coefficients.
EXPERIMENTAL
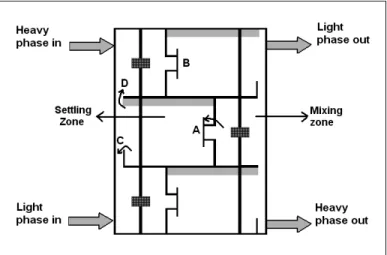
A pilot scale rectangular Hanson mixer-settler extraction column (Schweitzer, 1997) with horizontal arrangement of the mixer and settler in each stage was used in these experiments. Two sides of the column were made of stainless steel and the other sides were made of Plexiglas. The column consisted of seven stages with 12 cm height; a schematic diagram of three stages is given in Figure 1. Dispersion of the organic phase in each stage was achieved by means of a 6.5 cm diameter 6-bladed turbine agitator.
In each stage, the light and heavy phases were mixed in the mixing zone for providing initial contact. After that the unstable emulsion was transferred to a settler zone through the port ‘A’.
This port was located in the middle of a dividing wall and, in front of it, a vertical plate ‘B’ was placed to decrease the effect of centrifugal rotation in the settler so that the drop coalescence was improved. In the settler zone, the phases were separated, so the heavy phase was led to the previous stage mixer through a weir ‘C’ and the light phase was led to the next stage mixer through a port ‘D’. The column geometry is listed in Table 2.
The liquid system studied was toluene-acetone-water. This system has been recommended by the European Federation of Chemical Engineering as an official test system for extraction investigations (Míšek et al., 1978).In all experiments, dilute solutions have been investigated with approximately 3.5 wt% acetone in the aqueous phase: distilled water was used as continuous phase. The range of each physical property of the liquid–liquid system used in these experiments is listed in Table 3. It should be noted that, under mass transfer conditions, a degree of uncertainty surrounds the estimation of physical properties, since these vary not only with the inlet solute concentrations but also along the column. In the present work, the values of physical properties have been assumed to correspond to the mean values of acetone concentration in the continuous and dispersed phases. The mean value of acetone concentration which was obtained by averaging the values obtained at the inlet and outlet of the column. Liquid-liquid equilibrium data of the toluene-water-acetone system were taken from Míšek et al. (1978).
Table 2: Geometrical characteristics of the column used
Column Components Dimensions(cm)
Mixer dimensions(length×width) 13×13
Settler dimensions 26
×
13Stage height 12
Column height 172
No. of stages 7
Column active volume 55.36(L)
Agitator diameter 6.5
Blade height 1.3
Inner port dimension 13
×
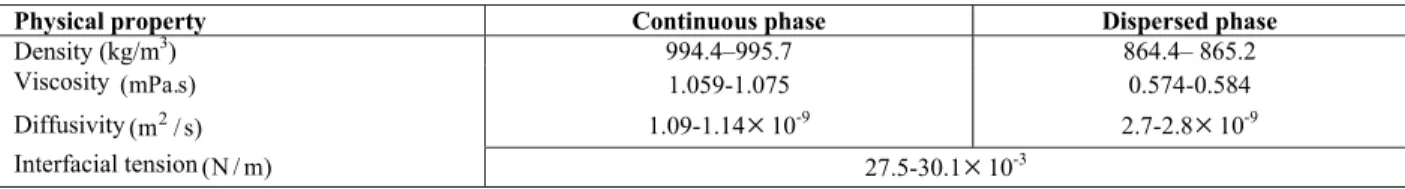
4Table 3: Physical properties of the liquid system at 20°C (Míšek et al., 1978)
Physical property Continuous phase Dispersed phase
Density (kg/m3) 994.4–995.7 864.4– 865.2
Viscosity (mPa.s) 1.059-1.075 0.574-0.584
Diffusivity 2
(m / s) 1.09-1.14
×
10-9 2.7-2.8×
10-9Interfacial tension (N / m) 27.5-30.1×10⁻³
Conditions became steady after 80 to 100 minutes running time depending on the flow rates of the two phases. The liquid level at the top of the column was automatically controlled by an optical sensor. A solenoid valve (a normally closed type) was provided at the outlet stream of the light phase. This valve received electronic signals from the optical sensor. When the interface location was going to change, the optical sensor sent a signal to the solenoid valve and the aqueous phase was allowed to leave the column by opening the diaphragm of the solenoid valve and the organic phase was allowed to leave the column via an overflow. The samples were collected at the inlet and outlet of the first, fourth and seventh stages and acetone concentration was
measured by gas chromatography (GC). A MXT®-1
(popular non-polar phase) column was used in these experiments. The column (Scientific Buck (910) model) had a 0.53mm internal diameter and was 30m in length. Methanol was used as internal standard and the values of retention time were 3.1, 3.6 and 4.9min for methanol, acetone and toluene, respectively. The column temperature was increased linearly during 7.5 minutes from 50 to 200oC. The photographs of the droplets were taken during steady state conditions and used to determine Sauter mean droplet size. The holdup of dispersed phase was measured by rapid withdrawal of 100ml sample from mixers. In all experiments, two phases were mutually saturated before the experiments by repeated circulation through the column. Agitation speed was varied between 200 and 440rpm because, for this column design and high interfacial tension system, agitator speeds lower than 200rpm were not found to be of practical significance and, for speeds higher than 440rpm, the column operated unstable.
RESULTS AND DISCUSSION
It is assumed that extraction of acetone proceeded only within the mixer and the concentrations of dispersed and continuous phases leaving the mixer are both equal to those within the mixer (i.e., complete mixing). The volumetric overall mass transfer coefficient,K a , based on the continuous phase c concentration, is obtained by the following equation:
*
c out out M c in out
K a(x −x )V =Q (x −x ) (5)
wherexinandxout are the mass fractions of acetone in the input and output of the continuous phase for each stage, respectively,V is the volume of the mixer, and M
c
Q is the flow rate of the continuous phase. Also *
out out
x ( y= / m)is the aqueous phase concentration in equilibrium with the organic phase. It is worthy to note that the assumption of complete mixing does not mean a uniform concentration of dispersed phase, but the average concentration of dispersed drops leaving the mixer is equal to that within the mixer. The average value of the volumetric overall mass transfer coefficient for each stage is obtained by averaging the values obtained in the first, fourth and seventh stages.
decrease of mass transfer rates for small drops, behaving as rigid spheres, present in the mixer. This phenomenon causes molecular diffusion to govern the system and therefore the mass transfer coefficients decrease. Also, the volumetric overall mass transfer coefficients might be affected by axial mixing between stages. Although settlers are used in the present column to decrease axial mixing, when the rotor speed is more than 400 rpm, the centrifugal rotation in the settler become significant and a large number of the dispersed drops passes through the settler without coalescing. The circulatory flow of continuous phase in the direction of drop motion (backmixing in the continuous phase) and also the entrainment of dispersed drops in the continuous phase cause a decrease in volumetric overall mass transfer coefficient.
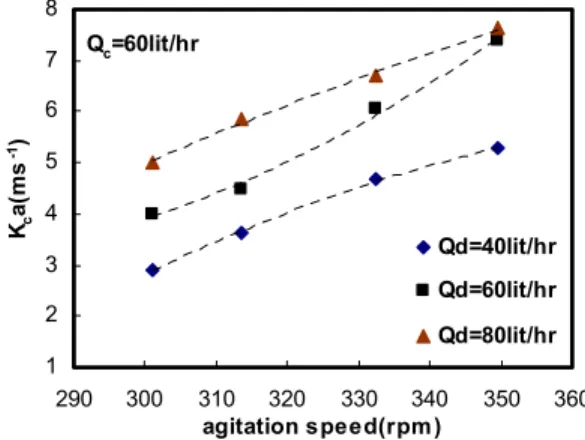
The values of K a are shown in Figure 3 for c constant flow rate of the continuous phase. According to this figure, the volumetric overall mass transfer coefficient increases with an increase inQ . d The holdup of dispersed phase and mean drop size increase with increase in dispersed phase flow rate,
but it is observed that the effect of holdup on interfacial area is larger than that of drop size, i.e., interfacial area increases by increasing dispersed phase flow rate and consequently the mass transfer rate will increase.
The effect of continuous phase flow rate on K a c is given in Figure 4. As shown in this figure, the volumetric overall mass transfer coefficient decreases with an increase in Q . The dispersed c phase holdup decreases with the increase in continuous phase flow rate. Moreover, the residence time of the dispersed phase decreases with increase in Q , and the size of dispersed drops c increases with decrease in residence time. The interfacial area decreases with decrease in holdup and the increase in drop size and, consequently, the mass transfer coefficient will decrease. Comparing Figures 3 and 4, it can be seen that the effect of dispersed phase flow rate on K a is larger than that c of continuous phase flow rate. It should be noted that the dotted lines in Figures 3 and 4 are only a guide to the eyes.
Qc=60lit/hr Qd=60lit/hr
0 1 2 3 4 5 6 7 8
150 200 250 300 350 400 450 500
agitation speed(rpm )
Kc
a
(m
s
-1)
Qc=60lit/hr
1 2 3 4 5 6 7 8
290 300 310 320 330 340 350 360
agitation speed(rpm )
Kc
a
(m
s
-1)
Qd=40lit/hr
Qd=60lit/hr
Qd=80lit/hr
Figure 2: Effect of agitation speed on volumetric overall mass transfer coefficient
Figure 3: Effect of dispersed phase flow rate on volumetric overall mass transfer coefficient
Qd=60lit/hr
2 3 4 5 6 7 8
290 300 310 320 330 340 350 360
agitation speed(rpm )
Kc
a
(m
s
-1)
Qc=40lit/hr
Qc=60lit/hr
Qc=80lit/hr
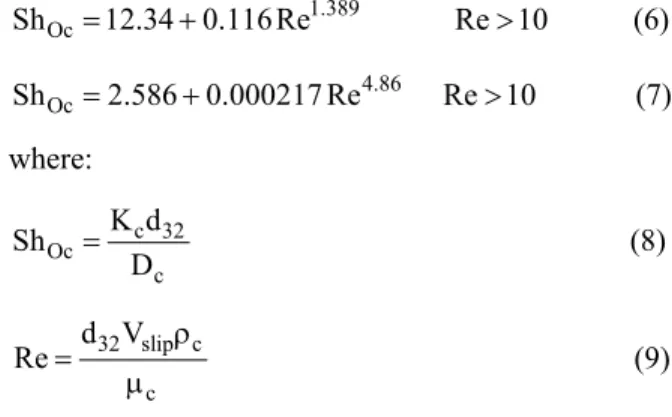
The overall mass transfer coefficient K can be c obtained by dividing the volumetric coefficient by the interfacial area(a= φ6 / d )32 . The experimental data are correlated in terms of dimensionless numbers ShOcand Re by using the least squares method, as follows:
1.389 Oc
Sh =12.34+0.116 Re Re 10> (6)
4.86 Oc
Sh =2.586+0.000217 Re Re 10> (7)
where:
c 32 Oc
c K d Sh
D
= (8)
32 slip c
c d V
Re= ρ
µ (9)
in which d32is the Sauter mean diameter and Vslipis the slip velocity between two phases in the mixer. Since the dispersed and continuous phases flow concurrently through the mixer, the slip velocity,Vslip between the phases is obtained as follows (Thornton et al., 1956):
d c
slip
Q Q
V
A A(1 )
= φ− − φ (10)
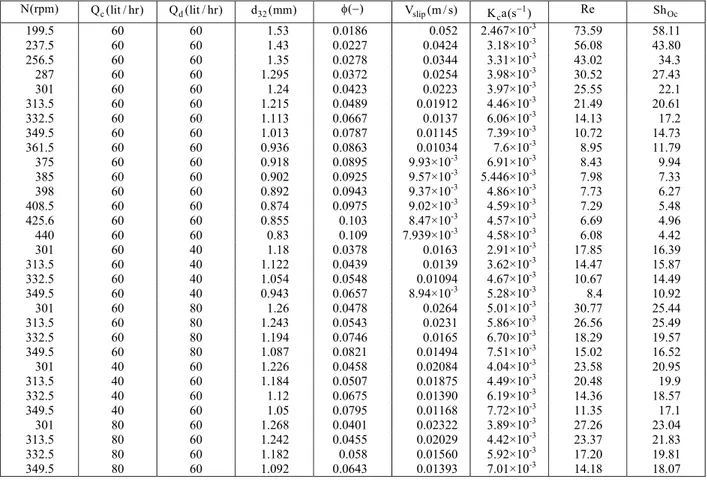
The value of ARD (average relative deviation) in the predicted values of ShOc(orK ) by using c correlations (6) and (7) derived from experimental data is 4.64%. Figure 5 shows the agreement between experimental and predicted data, using correlations (6) and (7). The values used in equations 6-10 are given in the Appendix.
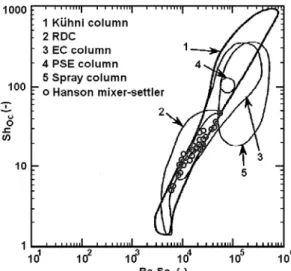
The overall mass transfer coefficient results obtained in different extraction columns have been presented by Kumar and Hartland (1988). According
to Kumar and Hartland, correlations for several extraction columns, i.e., a Kühni column, a rotating disc column (RDC), an enhanced coalescing column (EC) and a pulsed sieve extraction column (PSE) are almost the same. As shown in Figure 6, the experimental results for the mass transfer coefficient obtained in the Hanson mixer-settler are also similar to those obtained in the above columns. So it can be
concluded that the correlations for K in the c
literature, which can be applied for a Kühni column, a RDC, an EC column and a PSE, can be also applied to a Hanson mixer-settler extraction column.
The experimental results for the dispersed phase overall mass transfer coefficient are compared with theoretical models. The average residence time in each mixer θ =d( VMφ/ Q )d is used as t in equations (1) to (3). The values of ARD in the predicted values of dispersed phase overall mass transfer coefficient obtained by applying equations (1), (2) and (3) to the experimental results are 15.2%, 64.7% and 636%, respectively. The values of ARD show that equations (2) and (3) (Kronig and Brink and Handlos and Baron Equations) are not suitable for calculating the overall mass transfer coefficient. The Gröber equation may give satisfactory results, but it does not have enough accuracy for design. This error can be reduced by using equation (4) with the dimensionless enhancement factor, R=1.25. This equation reproduces the experimental data with an average relative deviation of 4.96%. Although the experimental results show that, when the effect of axial mixing on mass transfer becomes significant, this equation (and also the other models) can not be used for prediction of the overall mass transfer coefficient. The comparison of experimental results (Re>10) with those predicted by equation (4) is shown in Figure7. Figures (5) and (7) indicate that the suggested equations can estimate overall mass transfer coefficients with high accuracy and both methods can be used for prediction of the overall mass transfer coefficient.
0 10 20 30 40 50 60
0 10 20 30 40 50 60
ShOc(cal.)
Sh
O
c
(e
x
p
.)
Figure 6: Relationship between ShOc and Re.Sc : comparison of mass transfer in different extractors.
10 20 30 40 50 60 70
10 20 30 40 50 60 70
Kd (µm .s-1)(cal.)
Kd
(µ
m
.s
-1)(
e
x
p
.)
Figure 7:Comparison of experimental overall mass transfer coefficient with those calculated from Equation (4)
CONCLUSIONS
The volumetric overall mass transfer coefficient of the investigated mixer-settler column depends mainly on agitation speed, reaching a maximum value at about 360 (rpm). At high agitation speed, however, the volumetric overall mass transfer coefficient significantly reduces because of back-mixing. The volumetric overall mass transfer coefficient increases with an increase inQ , while it d decreases with an increase inQ and the effect of c dispersed phase flow rate on K a is larger than that c of continuous phase flow rate. Comparison between the column investigated and some other types of extractors shows that the correlations for K in the c literature, which can be applied to a Kühni column, a RDC, an EC column and a PSE, can be also applied to the Hanson mixer-settler extraction column. An
empirical correlation is developed in terms of overall Sherwood and Reynolds numbers for prediction of the continuous phase overall mass transfer coefficient. According to the results, the theoretical models are not suitable for prediction of dispersed phase overall mass transfer coefficients. Using
d
RD instead of D reduces the percent error and d gives more desirable results.
NOMENCLATURE
A cross sectional area of the
mixer
2 m
a interfacial area 2 3
m / m
n
B nth coefficient in equation (1-4)
(-)
32
d Sauter mean drop diameter m
K overall mass transfer
coefficient
m/s
m distribution ratio of acetone
between water and toluene
(-)
Q flow rate of the continuous
or dispersed phase
3 m / s
R enhancement factor for mass
transfer
(-)
Re Reynolds number (-)
c
Sc Schmidt number,µ ρc/ cDc, (-)
Oc
Sh Sherwood number based on
continuous phase overall mass transfer coefficient,
c 32 c
K d / D ,
(-)
t time s
M
V volume of mixer part 3
m
slip
V slip velocity of dispersed
drops to continuous phase in mixer part
m/s
x mass fraction of acetone in
continuous phase
(-)
*
x equilibrium mass fraction of
acetone in continuous phase corresponding to dispersed phase
(-)
y mass fraction of acetone in
dispersed phase
(-)
Greek Letters
n
λ nth coefficient in equations (1-4)
(-)
µ viscosity Pa.s
d
θ average residence time of
dispersed drops
s
ρ density 3
kg / m
φ holdup of dispersed phase (-)
Subscripts
c continuous phase (-)
d dispersed phase (-)
in at inlet to stage (-)
out at exit from stage (-)
Superscripts
* equilibrium value (-)
REFERENCES
Calderbank, P. H. and Korchinsky, I. J. O., "Circulation in Liquid Drops: A Heat Transfer Study," Chem. Eng. Sci. 6, 65 (1956).
Gröber, H., "Die Erwärmung and Abkühlung Einfacher Geometrischer Körper," Z Var Dtsch Ing. 69, 705-711 (1925).
Handlos, A.E. and T. Baron, "Mass and Heat Transfer from Drops in Liquid-Liquid Extraction," AIChE J. 3, 127-136 (1957).
Horvoth, M. and S. Hartland, "Mixer-Settler Extraction Column: Mass Transfer Efficiency and Entraiment, " Ind. Eng. Chem. Process Des. Dev. 24, 1220-1225 (1985).
Kirou, V. J., L. L. Tavlarides, J. C. Bonnet and C. Tsouris, "Flooding, Holdup and Drop Size Measurements in a Multistage Column Extractor," AIChE J. 34, 283- 292 (1988).
Kronig, R. and J. C. Brink, "On the Theory of Extraction from Falling Drops," Appl. Sci. Res. A2, 142-154 (1950).
Kumar, A. and S. Hartland, "Mass Transfer in a Kuhni Column," Ind. Eng. Chem. Res. 27, 1198-1203 (1988).
Kumar, A. and S. Hartland, "Correlation for Prediction of Mass Transfer Coefficients in Single Drop System and Liquid-Liquid Extraction Columns," Trans IChemE 77, Part A, 272-284 (1999). Míšek, T., R. Berger and J. Schroter, "Recommended
Systems for Liquid Extraction Studies, European Federation of Chemical Engineering, Institution of Chemical Engineers, Rugby (1978).
Nii, S., J. Suzuki, K. Tani and K. Takahashi, "Mass Transfer Coefficients in Mixer-Settler Extraction Column," J. Chem. Eng. Japan 30, 1083-1089 (1997).
Sarker, S. and C. R. Phillips, "Characterization of Hydrodynamic Parameters in Rotating Disc and Oldshue-Rushton Columns. Hydrodynamic Modeling, Drop Size, Holdup and Flooding," Can. J. Chem. Eng. 63, 701- 709 (1985).
Scheibel, E.G.,"Fractional Liquid Extraction", Chem. Eng. Progr. 44, 681 (1948).
Schweitzer, P. A., "Hanson Mixer-Settler," Handbook of Separation Techniques for Chemical Engineering, 3rd ed., pp. 461-469, McGraw-Hill, New York (1997).
Takahashi, K., S. Nii, K. Nakanishi and H. Takeuchi, "Stage Efficiency of Mixer-Settler Extraction Column," J. Chem. Eng. Japan 26, 715-719 (1993a).
Takahashi, K., K. Nakanishi, S. Nii and H. Takeuchi, "Maximum Throughput in Multistage Mixer-Settler Extraction Column," Kagaku Kogaku Ronbunshu 19, 440-445 (1993b).
Thornton, J. D., "Spray Liquid-Liquid Extraction Columns: Prediction of Limiting Holdup and Flooding Rates," Chem. Eng. Sci. 5, 201 (1956). Tsouris, C., V.I. Kirou and L.L. Tavlarides, "Drop
Size Distribution and Holdup Profiles in a Multistage Extraction Column," AIChE J. 40, 407-418 (1994).
Wirz, W., German Patent 1918225 (1968).
APPENDIX
The experimental values used in equations 6-10 are listed in Table A-1.
Table A-1: The values used in equations 6-10.
N(rpm) Q (lit / hr)c Q (lit / hr)d d (mm)32 φ −( ) Vslip(m / s) 1 c
K a(s )− Re ShOc
199.5 60 60 1.53 0.0186 0.052 2.467×10⁻³ 73.59 58.11
237.5 60 60 1.43 0.0227 0.0424 3.18×10⁻³ 56.08 43.80
256.5 60 60 1.35 0.0278 0.0344 3.31×10⁻³ 43.02 34.3
287 60 60 1.295 0.0372 0.0254 3.98×10⁻³ 30.52 27.43
301 60 60 1.24 0.0423 0.0223 3.97×10⁻³ 25.55 22.1
313.5 60 60 1.215 0.0489 0.01912 4.46×10⁻³ 21.49 20.61
332.5 60 60 1.113 0.0667 0.0137 6.06×10⁻³ 14.13 17.2
349.5 60 60 1.013 0.0787 0.01145 7.39×10⁻³ 10.72 14.73
361.5 60 60 0.936 0.0863 0.01034 7.6×10⁻³ 8.95 11.79
375 60 60 0.918 0.0895 9.93×10⁻³ 6.91×10⁻³ 8.43 9.94
385 60 60 0.902 0.0925 9.57×10⁻³ 5.446×10⁻³ 7.98 7.33
398 60 60 0.892 0.0943 9.37×10⁻³ 4.86×10⁻³ 7.73 6.27
408.5 60 60 0.874 0.0975 9.02×10⁻³ 4.59×10⁻³ 7.29 5.48
425.6 60 60 0.855 0.103 8.47×10⁻³ 4.57×10⁻³ 6.69 4.96
440 60 60 0.83 0.109 7.939×10⁻³ 4.58×10⁻³ 6.08 4.42
301 60 40 1.18 0.0378 0.0163 2.91×10⁻³ 17.85 16.39
313.5 60 40 1.122 0.0439 0.0139 3.62×10⁻³ 14.47 15.87
332.5 60 40 1.054 0.0548 0.01094 4.67×10⁻³ 10.67 14.49
349.5 60 40 0.943 0.0657 8.94×10⁻³ 5.28×10⁻³ 8.4 10.92
301 60 80 1.26 0.0478 0.0264 5.01×10⁻³ 30.77 25.44
313.5 60 80 1.243 0.0543 0.0231 5.86×10⁻³ 26.56 25.49
332.5 60 80 1.194 0.0746 0.0165 6.70×10⁻³ 18.29 19.57
349.5 60 80 1.087 0.0821 0.01494 7.51×10⁻³ 15.02 16.52
301 40 60 1.226 0.0458 0.02084 4.04×10⁻³ 23.58 20.95
313.5 40 60 1.184 0.0507 0.01875 4.49×10⁻³ 20.48 19.9
332.5 40 60 1.12 0.0675 0.01390 6.19×10⁻³ 14.36 18.57
349.5 40 60 1.05 0.0795 0.01168 7.72×10⁻³ 11.35 17.1
301 80 60 1.268 0.0401 0.02322 3.89×10⁻³ 27.26 23.04
313.5 80 60 1.242 0.0455 0.02029 4.42×10⁻³ 23.37 21.83
332.5 80 60 1.182 0.058 0.01560 5.92×10⁻³ 17.20 19.81