Scientiic/Technical Article
http://dx.doi.org/10.1590/2318-0331.011716026
Overland low generation mechanisms in the Concórdia River basin,
in southern Brazil
Mecanismos de geração de escoamento superficial na bacia do ribeirão Concórdia, Santa Catarina, sul do Brasil
André Ricardo Loewen1 and Adilson Pinheiro1
1Fundação Universidade Regional de Blumenau, Blumenau, SC, Brasil
E-mails: andré[email protected] (ARL), [email protected] (AP)
Received: February 12, 2016 - Revised: September 07, 2016 - Accepted: October 17, 2016
ABSTRACT
Overland low in watersheds is responsible for the occurrence of various environmental problems, including lood formation, erosion
and the transportation of sediment, and the addition of pollutants to the soil. Additionally, understanding this hydrological process is fundamental to improving knowledge regarding individual interest factors in a region, since it interferes with agricultural productivity and water supply for both the population and industry, among other contributions. Two principal theorists have described the overland
low generation processes: Horton (1933) and Dunne (1978). The TOPMODEL (a topography-based hydrological model) approach represents the overland low by variable contribution areas, which develop along the watercourses following the concept of Dunne’s overland low. Thus, this study aimed to evaluate the mechanisms of overland low generated in the Concórdia River basin based on the application of the TOPMODEL, using measured hydrological data obtained from a high frequency installed monitoring network. Discharge data series were performed for three sub-basins: SF3 (29.74 km2), SF2 (5.81 km2), and SF1 (2.36 km2). In these sub-basins, the lood hydrograph were separated and its response conditions were veriied in the TOPMODEL. Rainfall, discharge, and potential evapotranspiration data were used in an hourly scale for the three sub-basins. In general, the model showed adequate eficiency for the SF3 sub-basin; however, the SF2 and SF1 sub-basins showed distortion in its parameters, thereby delaying the simulated hydrograph in terms of time. Accordingly, the results corroborate the more frequent appearance of Dunnian overland low in the SF3 sub-basin,
where the topography is smoother and features large areas with a low slope, which serve as variable saturation areas. The SF2 and SF1
sub-basins present characteristics that strongly relect Hortonian overland low, with slopes in the topography that do not allow the frequent formation of variable contribution areas.
Keywords: Hydrological processes in watersheds; Variable contribution area; Hydrologic model of physical based.
RESUMO
Em uma bacia hidrográica o escoamento supericial é responsável pela ocorrência de diversos problemas ambientais, como formação de ondas de cheias, erosão e transporte de sedimentos e de poluentes nas vertentes. Além disto, entender este processo hidrológico é de fundamental importância para aprimorar o conhecimento sobre fatores de interesse próprios de determinada região, pois interfere na produtividade agrícola e abastecimento de água para população e indústria, entre outras contribuições. Dois conceitos têm sido utilizados para descrever os processos de geração de escoamento supericial: (i) Horton (1933); e (ii) Dunne (1978). O modelo TOPMODEL representa o escoamento supericial pelas áreas de contribuição variável, que se desenvolvem ao longo dos cursos de água, seguindo o conceito de escoamento supericial de Dunne. Assim, este trabalho visou à avaliação dos mecanismos de geração de escoamento supericial da bacia do ribeirão Concórdia a partir da aplicação do modelo hidrológico TOPMODEL, utilizando-se dados hidrológicos medidos com rede de monitoramento de alta frequência instalada. Foram analisadas séries de dados de escoamentos luviais para três sub-bacias: SF3 (29,74 km2), SF2 (5,81 km2) e SF1 (2,36 km2). Nestas, foram separados os hidrogramas de cheias e veriicadas as condições de resposta do modelo hidrológico TOPMODEL. Foram utilizados dados de precipitação, vazão e evapotranspiração potencial, em escala horária, para as três sub-bacias. Em geral, o modelo mostrou adequada eiciência para a sub-bacia SF3, contudo, as sub-bacias
INTRODUCTION
Hydrological processes involve a number of phenomena
associated with the natural circulation of water. Among these phenomena is the separation of precipitated water into either
iniltration into the soil or the generation of runoff.
In a watershed, runoff is responsible for the occurrence of
many environmental problems, including the formation of lood
waves, erosion and the transportation of sediment, and the entry of pollutants into the soil. Thus, identifying the mechanism that
promotes the generation of runoff could help to minimize the
resultant environmental damage.
Several concepts have been used to describe the generation of runoff. Horton (1933) established that runoff occurs when
the intensity of precipitation exceeds the water iniltration rate
of the soil. Hewlett and Hibbert (1967) improved this idea by
including the soil moisture as a variable because Hortonian low
does not take into account the water content of the soil prior to the precipitation. This new understanding of runoff is known as
Hewlettian low. Dunne (1978) reined the concept of Hewlettian low generation, thereby establishing the Dunnian surface low,
which is generated due to the saturation of the topsoil. This often occurs in areas close to streams, which evolve over time.
Additionally, runoff can be studied by contrasting two
of the mechanisms, namely Hortonian low and Dunnian low
(GIESEN et al., 2011).
An important relationship can be seen in the interaction
between the Hortonian and Dunnian lows when compared in terms
of land use. Pérez et al. (2011) determined that for the Lerma River basin in Spain, the change in land use to agriculture with irrigation
that took place between 2006 and 2009 generated an increase in the Dunnian low over the Hortonian low due to changing their interaction with the aquifer. This means that the land use can interfere
in the interaction between surface water and groundwater. Further, if the relationship between the surface runoff mechanisms and the predominant land use is established, that relationship can also be
used to deine the appropriate land uses in the basin.
Hydrological modelling has been used to understand
the different hydrological processes. When simulating different events in different basins, it is possible to understand some of the
hydrological phenomena that inluence the results. According to
Grayson and Blöschl (2001), understanding a particular process is of fundamental importance to the statement of a model.
However, the process may not be fully understood without irst
being modelled in some way, since modelling always complements the understanding of a process.
Modelling is therefore an important tool for understanding
hydrological processes. It assists in the extrapolation of hydrological
phenomena from the junction of all available data and knowledge.
This extrapolation in both space and time fulills the need to
improve limited knowledge about a phenomenon, including being able to predict the future impacts of a possible change in some of those hydrological phenomena (BEVEN, 2012).
In terms of the runoff process, hydrologic models are
designed to represent their generation based on both the Hortonian and Dunnian concepts. Most models consider the concept posited by Horton. The TOPMODEL (a topography-based hydrological
model) approach represents runoff by variable contribution areas that develop along a river.
In this way, over time, TOPMODEL has been used to
achieve a better understanding of the hydrological processes involved in watersheds.
It has shown results consistent with the reality of the basin; however, it strongly points to more eficient Nash-Sutcliff rates in basins that generate Dunnian surface runoff.
Hollanda et al. (2015) conducted a study in a conservationist watershed near to the municipality of Alegre, Espírito Santo, which
aimed to evaluate the use of the TOPMODEL in estimating
runoff in a sloping watershed with deep soils. They observed that although the model presented promising results, it underestimated the surface runoff.
Nourani, Roughani and Gebremichael (2011) used the
TOPMODEL in the Ammameh watershed in Iran, which is characterized by very shallow soils that convert up to 60% of all
rainfall into runoff. They concluded that the model is very good at simulating the peaks of the hydrograph and hence produces very
satisfactory results. Given that the model generates the Dunnian
runoff hypothesis, this directly depends on the amount of saturated area in the basin, which varies according to the simulation interval.
Gumindoga, Rwasoka and Murwira (2011) used the TOPMODEL to simulate the low in a basin in Zimbabwe. They concluded that
the model infers a direct relationship between the topographic index
and the generation of lows. Thus, the distributed topographic index is important when separating the low and, hence, it can be used to
improve the results generated by the model.
Therefore, TOPMODEL can be used to deine the
generation method of the runoff in a watershed. It responds
in a particular manner in latter river basins and shallow soils, where the Dunnian surface low is dominant, while responding
differently in river basins with higher average slopes and deeper
soils, where the Hortonian surface low prevails.
The present study aims to implement the TOPMODEL in the Concórdia River basin, which is located in the municipality of
Lontras, in order to better understand the mechanisms of runoff
generation in a small watershed characterized by predominantly
rural use.
com o aparecimento mais frequente do escoamento dunniano na sub-bacia SF3, onde a topograia é mais suave e apresenta grandes
áreas com baixa declividade, passíveis de contribuição em forma de área de saturação variável. As sub-bacias SF2 e SF1 apresentam
características que reletem fortemente o escoamento supericial hortoniano, onde a topograia é declivosa e não permite de maneira frequente a formação de áreas de contribuição variável.
METHODOLOGY Study area
The study area is the Concórdia River basin, which is located in the city of Lontras in the state of Santa Catarina, southern Brazil. It has 30.93 km2 of drainage area. Its physiographic is variable,
featuring steep slopes in sections upstream and smaller slopes
downstream, with altitudes ranging from 340-891 m.
The basin of the Concórdia River is one of seven basins
monitored by the Environmental Recovery Project and Support
for Small Rural Producers (PRAPEM/MICROBASINS) program developed by the Ministry of Agriculture and Rural Development
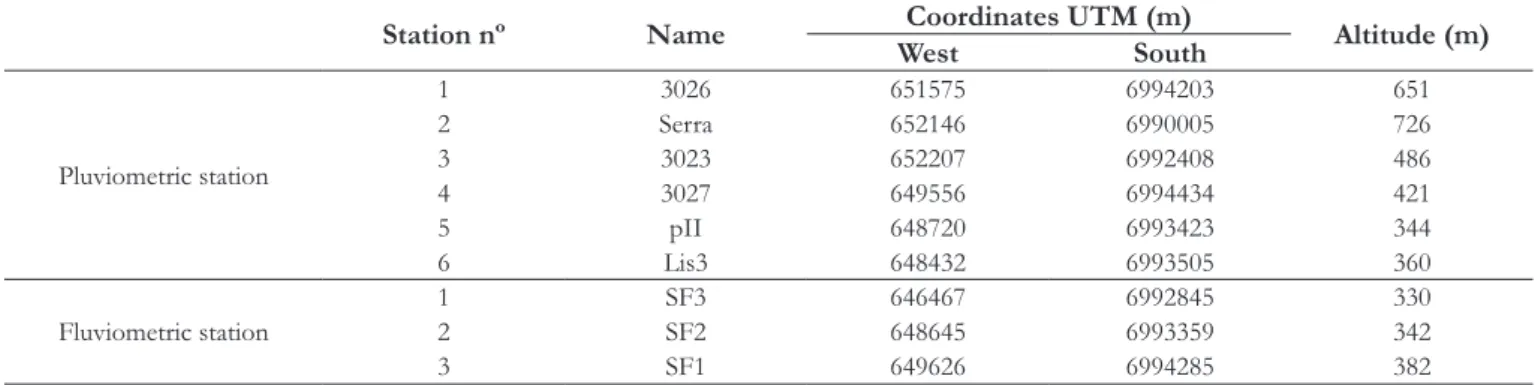
of Santa Catarina (PINHEIRO et al. 2013). The basin has a monitoring network, which was introduced in 2006, wherein eight
pluviometric stations, four luviometric stations, and an automatic weather station have been installed. In this work, three luviometric
sections were used for studies in the basin, with those stations
being considers the exits from the SF3, SF2, and SF1 sub-basins,
as shown in Table 1.
The data for the study were collected from six Waterlog
rainfall stations (Waterlog Series H-340, Model 2-SDI-08) and three level sensor Thalimedes stations (OTT Hidromet) with a
linimetric strip that records information every 5 min, as shown in Table 2. These data were superimposed in order to generate a single series of rainfall data, where the overlap criterion was the priority of the stations with the highest amount of data to those stations with more limited data. In this way, the resulting time series was used as the input for the three simulated sub-basins.
Figure 1 shows the characteristics of land use and occupation,
as well as the slopes map, for the Concórdia River basin. From the historical series obtained from the Concórdia
River basin stations, hydrological data for the period April 21,
2010, to July 28, 2012, were used on an hourly scale. This collection
of continuous data presented the highest number of working pluviographs and, throughout almost the entire period of rainfall, it presented working data from all six pluviographs, which calculated the precipitation compensation in heavy rain.
Events were selected from the hydrographs, wherein there
was a historical series of 1008 consecutive days on an hourly scale for the three luviometric stations. The selected hydrographs were those that exceeded the low in 0.25 m3.s-1 for the SF1 luviometric
section and 0.5 m3.s-1 for the SF2 luviometric section, having obtained 38 hydrographs suitable for potential use in the model. From this, the hydrographs that exhibited well-deined peaks during the loods were selected in order to reduce the errors in the estimates of the total runoff for each event. 26 well-deined
hydrograms were obtained for use in the model.
The hydrographs derived from the luviometric data were separated so as to quantitatively express both the surface and subterranean lows. Using a low separation tool, namely Hydraccess software version 4.6, a line is drawn between the
starting points of the rise and the end of the recession of the hydrographs for each event and, considering the hydrograph above the surface runoff, the remainder of the volume is considered to
be subterranean low (TUCCI, 1997). For the application of these
data in the simulation of the TOPMODEL, the input hydrogram
was set as the sum of those hydrograms that comprise the runoff,
Table 1. Physical characteristics of the three studied sub-basins.
Section SF3 SF2 SF1
Drainage area (km2) 29.74 5.81 2.36
Length of the main river (km) 13.53 5.48 3.05
Mean slope of the main river (m.km-1) 1.30 3.92 10.77
Mean slope of the basin (m.km-1) 14.07 13.74 13.46
Drainage network length (km) 172.05 31.35 12.25
Form factor 0.47 0.53 0.43
Drainage index 0.57 0.53 0.51
Altitude variation (m) Minimum 340 350 390
Maximum 891 821 821
Table 2. Pluviometric and luviometric gauge stations.
Station nº Name WestCoordinates UTM (m)South Altitude (m)
Pluviometric station
1 3026 651575 6994203 651
2 Serra 652146 6990005 726
3 3023 652207 6992408 486
4 3027 649556 6994434 421
5 pII 648720 6993423 344
6 Lis3 648432 6993505 360
Fluviometric station
1 SF3 646467 6992845 330
2 SF2 648645 6993359 342
plus 24 hourly time intervals prior to the beginning of runoff and 24 hourly time intervals after the end of runoff.
The potential evapotranspiration was calculated using the
FAO-modiied Penman-Monteith equation (ALLEN et al., 1998).
In the application of this potential evapotranspiration equation,
data from the Lontras meteorological station, which is located at an
altitude of 560 m and maintained by EPAGRI/FURB, were used.
The daily evapotranspiration was distributed at hourly intervals using the radiation data measured at the Salto Pilão
plant’s meteorological station. Hourly radiation values were
used throughout the day in relation to the evapotranspiration distribution, with higher evapotranspiration values being seen at higher radiation times.
The topographic index map was generated using ArcGIS
software (ArcMap extension) version 10.1. The ile used in the ArcGIS software was the numerical terrain model (NTM), which was generated by the Secretariat of Sustainable Development of the State of Santa Catarina (SDS-SC) through an aerial photogrammetric
survey. The data presented the radiometric adjustment, levels of
contrast and tone, homogenization of images, color balance, orthorectiication, and mosaic. These data were made available by Lontras City Hall.
TOPMODEL application
For the application of the TOPMODEL, some input information is required, which must be conigured every time
the model is executed.
TOPMODEL version 97.01 was used, as elaborated by the
University of Lancaster (BEVEN, 1997). In this case, the model
depends on ive parameters that should be calibrated as the average values of the watershed, in addition to data concerning the ixed
topographic indexes distributed in the basin and data regarding
the precipitation, potential evapotranspiration, and observed low. The parameters required for the model are:
• m: a function of the exponential transmissivity and recession curve, which describes the decay in the hydraulic
conductivity varying with soil depth (m);
• ln(T0): the effective transmissivity of the saturated soil
proile (m h2. −1);
• SRmax: the maximum capacity of the available water in
the root zone (m);
• SRinit: the initial storage deicit in the root zone proportional to the SRmax (m) and;
• ChVel: the velocity of the surface proportion, assuming
linear propagation (m h. −1).
The calibration was performed separately for each event, generating different parameter values each time. For the calibration of the parameters, the approximation of the simulated hydrograms
with the measured hydrograms was sought. The quality of this
process was measured using the Nash-Sutcliff index generated by the model.
The calibration of the parameters of the hydrological
TOPMODEL was a complex process due to the lack of a single
optimal set of values.
The Monte Carlo method was used, which randomly simulates all ive parameters a large number of times and also provides the eficiency response of the model. Each parameter
had its own range of maximum and minimum values established manually, which guaranteed the physical integrity of the results.
However, the resultant values do not necessarily represent the
physics of the watershed.
For each event, the Monte Carlo simulation was run at least 90,000 times. The number of simulations reached 240,000
when the model was very sensitive to the parameters.
RESULTS AND DISCUSSIONS
Following the application of the TOPMODEL, an analysis
of the results generated using both the observed and simulated hydrograms was performed. For the analysis of the parameters simulated by the model, only the events that corresponded
best in terms of eficiency (equal to or greater than 0.75) were selected. This eficiency is given as the model’s own answer and
it represents the E index of Nash and Sutcliffe (NS). According to Santos and Celeste (2014), indexes where E = 0 indicate that the predictions are as accurate as the mean of the observed data, while indexes where E < 0 indicate that the observed mean is a better indicator than the model.
When calibrating the parameters of the model in the SF3 luviometric section, the NS indexes exhibited good eficiency. However, for the SF2 and SF1 sections, while the simulated hydrograms adequately represented the observed hydrograms, the NS eficiency of the model was low. This was due to the delay in
the simulated hydrograms, since the model cannot anticipate the
simulated low rate. This problem was solved by advancing the
precipitations over time. As the hydrological data inserted in the model feature an hourly time scale, postponing the rainfall in one time interval means that the information arriving at the model is that the rain occurred 1 hour before it actually did. In this way, the simulated hydrogram could be anticipated, thereby increasing
its eficiency.
For the SF2 and SF1 luviometric sections, the precipitation
was anticipated on average in three to four time intervals.
Surface low analysis
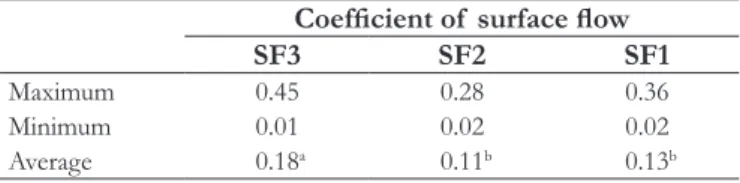
The analysis of the SF3, SF2, and SF1 luviometric stations
is detailed in Table 3. For the SF3 sub-basin, the low coeficients presented higher amplitudes and a higher average saturation index due to their higher average saturation area. The SF2 and SF1 sub-basins, with their smaller drainage areas, exhibited lower
average runoff coeficients. The analysis of variance showed that the SF2 and SF1 stations did not present a signiicant difference (p < 0.06) between their means. However, when comparing the coeficients of these smaller basins with those of SF3, a statistically signiicant difference was observed. This difference may be associated with the topographic index, since the SF3 sub-basin
presents a larger area with higher topographic indexes and less sloping regions.
Sensitivity of the model to the parameters
The sensitivity of the model to the different parameters
varied between the three luviometric sections studied, which inluenced both the results and the eficiency of the model in the
simulation of the exit hydrograms.
The SF3 section was the section featuring less events with high eficiencies. We selected 11 events from this section that had an eficiency equal to or greater than 0.75. For the SF2
section, 19 events were selected. The SF1 section presented similar eficiency results to those of the SF2 section, and 18 events with an eficiency equal to or greater than 0.75 were selected.
In relation to the m parameter, the results veriied that it
generated the greatest sensitivity to the model, thereby strongly
inluencing its results. The simulations in the SF3 section showed that
for the reality of that sub-basin, the values of m should preferably remain between 0.006 and 0.015. Events with an m parameter
calibrated with values less than 0.006 presented dificulties in terms
of simulating the hydrograph recession due to accentuating the
reduction of the recession lows to beneit the model’s eficiency; however, they did not adequately represent the physical reality
of the hydrograph. This is because the m parameter represents the decay of the water storage in the soil and therefore acts as a
controller of the effective depth of the soil proile. The lower the
value of m, the lower the layer and the shallower the soil, which
contributes to the sub-supericial low regime. Yet, the deeper the soil, the slower the low generation process and the smoother the
recession curve (SCHULER et al., 2000).
Nourani, Roughani and Gebremichael (2011) performed
a study using the TOPMODEL and obtained a similar result to those found in the SF3 luviometric section in relation to the m parameter. As in the SF3 luviometric section, their study also
indicated the greater sensitivity of the model to the m parameter, which, according to the authors, is directly related to the peak of the simulated hydrogram. They noted that as the value of the m parameter decreases, the peak of the hydrograph increases and, as a result, the m parameter becomes an indicator of the total
low volume in the exit of the basin.
For the SF2 and SF1 luviometric sections, the values of m
do not present preferred values, instead exhibiting high variations. Although the simulations have shown that the values for these
two sections are lower than those found in the SF3section, the
model also exhibited high sensitivity to this parameter.
The model presented low sensitivity to the ln(T0) parameter
in all three luviometric sections. The lateral subsurface low
is directly correlated with T0, meaning that a low value of m associated with a high T0 value could generate an abrupt recession in the hydrograms. The explanation for the low sensitivity of the model to this parameter may therefore be associated with the high
sensitivity of the model to the m parameter, which signiicantly
alters the recession, leaving little room for the T0 to modify it. The SRinit parameter exhibited a direct relation with the m parameter. By adopting a very low SRinit value, the hydrograph tended to ascend immediately following the precipitation,
thus presenting a well-deined ascent. Interactively with the m
parameter, we can hence represent the rise, recession, and peak
of the hydrograph. However, the calibration of only these two parameters is generally insuficient to adjust the rise, recession,
and peak of the hydrograph altogether.
The SRinit represents the conditions of soil saturation in the basin at the beginning of the event. Its maximum value is
controlled by the SRmax. However, once the SRmax is established, this value easily controls the start of the hydrograph’s rise. The SRinit parameter tended to more strongly inluence the hydrograph in the SF2 and SF1 sections, meaning that it showed greater inluence
in smaller basins.
Table 3. Coeficients of the maximum, minimum, and average surface low for the three studied sections.
Coeficient of surface low
SF3 SF2 SF1
Maximum 0.45 0.28 0.36
Minimum 0.01 0.02 0.02
Average 0.18a 0.11b 0.13b
Note: Equal letters indicate statistical similarity according to the analysis of
The SRmax parameter displayed an interaction with the
SRinit parameter, since if the SRmax was calibrated irst, it was
possible to calibrate the SRinit more accurately. Similar to the SRinit, the model presented greater sensitivity in the SF2 and SF1 sections for the SRmax parameter. It is possible to notice an inversion in the sensitivity of the model between the m parameter and the SRinit and SRmax parameters. The SRinit and SRmax
tend to have a greater inluence in smaller basins, while the m parameter loses inluence in such conditions.
The SRmax is the available water capacity in the root zone,
so the higher its value, the greater the amount of rain needed to
completely ill it. This reservoir is emptied by evapotranspiration.
When an event occurs following a long period of drought,
rain must irst completely ill the reservoir before beginning to contribute to the river low. Conversely, when an event occurs
after a few days of rainfall and the soil presents a high moisture content, the reservoir is already close to its maximum value, and the hydrograph can thus ascend immediately after precipitation begins. At the start of the event, this value is given by the SRinit.
The ChVel parameter presented a moderate inluence on the eficiency of the model. In the SF3 section, the mean value was 2,234 m.h–1; however, it had little inluence on the eficiency
of the model in the SF2 and SF1 sections, where its mean values
were 4,658 and 5,143 m.h–1, respectively. This parameter showed the ability to slightly delay or advance the hydrograph’s peak by
respectively decreasing or increasing its value.
It is important to emphasize that the TOPMODEL considers
the spatial distribution of the topographic index, although the other parameters are adopted as a concentrated type. This implies that the spatial variability of the soil is not represented by parameters
with unique values for the simulated contributory sub-basin.
This leads to the obtained values exhibiting high variation among the events and contradictory physical representativeness between the sub-basins, even if they are located one inside the other.
Mechanism of generation of surface runoff
The objective of this work was to evaluate the mechanisms
of surface low generation of the Concórdia River basin based on the application of the TOPMODEL. From the present study,
it was possible to arrive at some considerations regarding the use
of the TOPMODEL for this purpose.
The evaluation of the various factors that inluence the hydrodynamics in the Concórdia River basin involved three selected sub-basins: SF3, SF2, and SF1. In general, as seen in the analysis of the results of the parameters, the SF3 luviometric station
behaved differently to the other two stations. This indicates a physical difference between the sub-basins, whether it be related to the drainage area, length of the main river, or the mean slope of the main river. The mean slopes of the contributing basins, the shape factors, and the drainage rates were similar (Table 1). The use and occupation of the soil, while highly variable, presents high homogeneity among the contributing basins. It was therefore
dificult to associate the model’s operation with the type of soil use, as veriied by Pérez et al. (2011).
First, the delay in the hydrographs of the SF2 and SF1 sub-basins occurred due to the inability of the parameters to
adequately represent the physical mechanisms that occur inside
the basin. Among these parameters, the SRinit parameter is principally responsible for the delay in the hydrographs, which was calibrated in order to reproduce the observed hydrographs. Ferreira (2004) obtained similar results and concluded that the delay in the hydrograms had a strong correlation with the values of the SRinit parameter. The mean values of the SRinit for the
SF2 and SF1 sub-basins were 53 mm and 66 mm, respectively,
which can be considered high when compared to the mean value
of 5 mm that was determined for the SF3 sub-basin. These high SRinit values demonstrate a high storage deicit in the root zone, which must be completely illed by rainfall before contributing to the subsurface and supericial lows, therefore delaying the
hydrograph in terms of time.
The high SRinit values ended up maintaining the average
saturation of the basin at a very low level, which is around 2%
of the average saturation during the events for the SF2 and SF1
sub-basins, unlike the 6% found for the SF3 sub-basin. In this sense, the model estimates that the Dunnian surface runoff is
almost non-existent for the SF2 and SF1 sub-basins, while it
becomes signiicant in the SF3 sub-basin.
The maximum saturation of the basin exhibits a good
correlation with the coeficient of runoff in the SF3 sub-basin,
reaching an R2 correlation of approximately 52%. Hence, the
maximum saturation index generated by the model corresponds to
the values found for the coeficient of the surface low. The events
that present higher saturation indexes for the basin also present
higher surface runoff coeficients.
In the SF2 sub-basin, this correlation does not exist.
This luviometric section presents variable maximum saturation values when compared to the surface low coeficients, which
implies poor simulation of the saturated regions for this sub-basin. In the SF1 sub-basin, the correlation results between the
maximum basin saturation and the runoff coeficients were similar
to those found for the SF2 sub-basin.
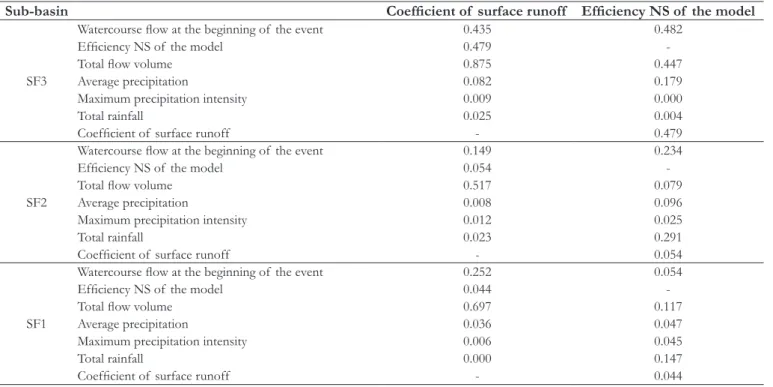
Table 4 displays the coeficients of determination R2 obtained from the relations between the coeficients of surface low and different variables. Likewise, the coeficients of determination are presented in relation to the values of the coeficient of eficiency
NS of the model, as obtained for each event. A higher correlation
between the runoff coeficient and the total low volumes of the three sections under analysis can be seen. For the SF3 luvial station, the total low volume of the event explains 87.5% of the variance of the coeficient of surface runoff. Although lower in the SF2 and SF1 luviometric stations, these correlations can also be considered signiicant, reaching values of 51.7% and 69.7%, respectively. These values demonstrate the improved accuracy of the runoff coeficients as the contribution area of the luviometric sections increases. This is due to the fact that the
rainfall is considered to be the same over the whole basin, while the sections with the lowest correlations are located in a region with different characteristics to the others, namely higher slopes of the main river and higher elevations.
The watercourse low rate at the beginning of the event and the NS eficiency of the model presented mean correlation values with the surface low coeficient for the SF3 luviometric section of 43.5% and 47.9%, respectively (Table 4). This correlation value
between the watercourse low rate at the beginning of the event and the runoff coeficient shows the importance of the initial
Figure 2 shows the saturation maps for the SF3, SF2, and SF1 sub-basins. These saturation maps indicate the variable
contribution areas, which contribute to the generation of Dunnian surface low. The tendency of the model to generate saturated cells
in regions with a higher topographic index can be observed where the terrains show less slope. Beven and Kirkby (1979) used this
index in the TOPMODEL to enable the simulation of the variable
contribution areas, concluding that this saturation mainly occurs in areas near the drainage channel. This is because the variable contribution areas depend on the depth of the water table, which in the vicinity of the drainage channel is close to the surface.
Rennó and Soares (2003) conducted a study on the use of the topographic index as an estimator of the water table depth. They found higher topographic index values in regions associated with the drainage network, thereby obtaining good estimates of the depth of the water table in naturally saturated regions.
In Figure 2, the SF3 sub-basin features a larger contribution area, unlike the SF2 and SF1 sub-basins, which only present saturated areas in the convergence regions of the terrain directly
associated with the watercourse. In the SF3 basin, the areas close
to the watercourse, especially in regions with a low slope near the
basin exit, also present areas of afluence, which contribute to the generation of Dunnian surface runoff. This higher occurrence of saturated areas in the SF3 basin occurs for two main reasons: (i) less sloping land and a higher topographic index; and (ii) the
lower value of the SRinit parameter, which is associated with a
water deicit in the root zone.
Thus, it is suggested that the TOPMODEL cannot adequately simulate the hydrographs for the SF2 and SF1 luviometric sections,
which both have characteristics that make it impossible to simulate
the Dunnian surface low. Therefore, it is understood that low
of this type does not prevail in these sub-basins.
Table 4. Table of correlations R2 between the runoff coeficient and the Nash-Sutcliff eficiency of the model versus other parameters
from each event.
Sub-basin Coeficient of surface runoff Eficiency NS of the model
SF3
Watercourse low at the beginning of the event 0.435 0.482
Eficiency NS of the model 0.479
-Total low volume 0.875 0.447
Average precipitation 0.082 0.179
Maximum precipitation intensity 0.009 0.000
Total rainfall 0.025 0.004
Coeficient of surface runoff - 0.479
SF2
Watercourse low at the beginning of the event 0.149 0.234
Eficiency NS of the model 0.054
-Total low volume 0.517 0.079
Average precipitation 0.008 0.096
Maximum precipitation intensity 0.012 0.025
Total rainfall 0.023 0.291
Coeficient of surface runoff - 0.054
SF1
Watercourse low at the beginning of the event 0.252 0.054
Eficiency NS of the model 0.044
-Total low volume 0.697 0.117
Average precipitation 0.036 0.047
Maximum precipitation intensity 0.006 0.045
Total rainfall 0.000 0.147
Coeficient of surface runoff - 0.044
In relation to the SF3 sub-basin, due to its less sloping
topography, it is understood that the model shows positive results,
which point to a signiicant and present variable contribution area. This implies the most frequent generation of Dunnian surface low.
CONCLUSION
The results obtained using the TOPMODEL corroborate the more frequent appearance of Dunnian low in the SF3 sub-basin,
where the topography is smoother and features only a low slope,
which can contribute in the form of an afluence area.
The SF2 and SF1 sub-basins feature characteristics that
strongly relect the Hortonian surface low, where the topography is sloping and does not frequently allow for the formation of areas of afluence.
In general, the eficiencies obtained in the SF3 luviometric
section can be considered good, which validates the use of the
TOPMODEL in this sub-basin. Its results are consistent with
reality, since it presented both medium and strong correlations between its parameters.
However, the SF2 and SF1 luviometric sections presented
a distortion in their parameters, which generates a hydrograph delay in terms of time. The only parameter that seems to behave appropriately is the m parameter, which displays strong correlations
with the total low volume in the basin exit at the end of the
event. Therefore, in order to better understand the behavior of
the surface lows of these two sub-basins, it is necessary to adopt another technique, in addition to perfecting the scales adopted
for the data obtained from such small sub-basins.
ACKNOWLEDGEMENTS
We thank CNPq for funding the research (process 403739/2013-6), the research productivity grant (process 303472/2014-6) and the master’s degree grant (process 131930/2014-1).
REFERENCES
ALLEN, R. G.; PEREIRA, L. S.; RAES, D.; SMITH, M. Crop
evapotranspiration: guidelines for computing crop requirements.
Irrigation and Drainage Paper, n. 56, p. 15, 1998.
BEVEN, K. J. TOPMODEL user manual: Windows Version 97.01.
Lancaster: University of Lancaster, 1997.
BEVEN, K. J. Rainfall-runoff modeling: the primer. 2nd ed. New
York: John Wiley & Sons, 2012. 379 p.
BEVEN, K. J.; KIRKBY, M. J. A physically based, variable contributing
area model of basin hydrology. Hydrological Sciences Bulletin, v. 24, n.
1, p. 43-69, 1979. http://dx.doi.org/10.1080/02626667909491834.
DUNNE, T. Field studies of hillslope flow processes. In: KIRKBY,
M. J. (Ed.). Hillslope hydrology. London: Wiley, 1978. chap. 7, p.
227-293.
FERREIRA, L. Simulação hidrológica utilizando o modelo TOPMODEL embacias rurais, estudo de caso na bacia do Ribeirão dos Marins: seção
Monjolinho – SP. 2004. 205 f. Tese (Doutorado em Engenharia Agrícola) - Faculdade de Engenharia Agrícola, Campinas, 2004.
GIESEN, N. V.; STOMPH, T. J.; AJAYI, A. E.; BAGAYOKO, F.
Scale effects in Hortonian surface runoff on agricultural slopes
in West Africa: Field data and models. Agriculture, Ecosystems & Environment, v. 142, n. 1-2, p. 95-101, 2011. http://dx.doi.
org/10.1016/j.agee.2010.06.006.
GRAYSON, R.; BLÖSCHL, G. Spatial patterns in catchment hydrology.
Cambridge: Cambridge University Press, 2001. 408 p.
GUMINDOGA, W.; RWASOKA, D. T.; MURWIRA, A.
Simulation of streamflow using TOPMODEL in the Upper Save River catchment of Zimbabwe. Physics and Chemistry of the Earth,
v. 36, n. 14-15, p. 806-813, 2011. http://dx.doi.org/10.1016/j.
pce.2011.07.054.
HEWLETT, J. D.; HIBBERT, A. R. Factors affecting the response of small watersheds to precipitation in humid areas. In: SOPPER,
W. E.; LULL, H. W. (Eds.). International Symposium on Forest Hydrology.
Oxford: Pergamon Press, 1967. p. 275-290.
HOLLANDA, M. P.; CECÍLIO, R. A.; CAMPANHARO, W. A.;
ZANETTI, S. S.; ANDRADE, L. N.; GARCIA, G. O. Avaliação
do TOPMODEL na estimativa do escoamento superficial em
microbacia hidrográfica em diferentes usos. Revista Brasileira de Engenharia Agrícola e Ambiental, v. 19, n. 5, p. 489-496, 2015. http://
dx.doi.org/10.1590/1807-1929/agriambi.v19n5p489-496.
HORTON, R. E. The role of infiltration in the hydrologic cycle. Eos, Transactions, American Geophysical Union, v. 14, n. 1, p. 446-460,
1933. [AGU] http://dx.doi.org/10.1029/TR014i001p00446.
NOURANI, V.; ROUGHANI, A.; GEBREMICHAEL, M.
TOPMODEL capability for rainfall-runoff modeling of the
Ammameh Watershed at different time scales using different terrain algorithms. Journal of Urban and Environmental Engineering, v. 5, n. 1, p. 1-14, 2011. http://dx.doi.org/10.4090/juee.2011.v5n1.001014.
PÉREZ, A.; ABRAHAO, R.; CAUSAPÉ, J.; CIRPKA, O.; BÜRGER, C. Simulating the transition of a semi-arid rainfed catchment towards irrigation agriculture. Journal of Hydrology (Amsterdam),
v. 409, n. 3-4, p. 663-681, 2011. http://dx.doi.org/10.1016/j. jhydrol.2011.08.061.
PINHEIRO, A.; KAUFMANN, V.; SCHNEIDERS, D.; OLIVEIRA,
D. A.; ALBANO, R. M. R. Concentrações e cargas de nitrato
e fosfato na Bacia do Ribeirão Concórdia, Lontras, SC. Revista Brasileira de Engenharia Agrícola e Ambiental, v. 17, n. 1, p. 86-93,
2013. http://dx.doi.org/10.1590/S1415-43662013000100012.
RENNÓ, C. D.; SOARES, J. V. Uso do índice topográfico como
estimador da profundidade do lençol freático. In: SIMPÓSIO BRASILEIRO DE SENSORIAMENTO REMOTO, 2003, Belo Horizonte. Anais... Belo Horizonte: INPE, 2003. p. 2579-2588.
SANTOS, J. R. S.; CELESTE, A. B. Avaliação de estratégias
de modelagem guiada por dados para previsão de vazão em rio
SCHULER, A. E.; MORAES, J. M. M.; MILDE, L. C.; GROPPO,
J. D.; MARTINELLI, L. A.; VICTORIA, R. L. Análise da
representatividade física dos parâmetros do TOPMODEL em uma bacia de meso escala localizada nas cabeceiras do rio Corumbataí,
São Paulo. Revista Brasileira de Recursos Hídricos, v. 5, n. 2, p. 5-25, 2000. http://dx.doi.org/10.21168/rbrh.v5n2.p5-25.
TUCCI, C. E. M. Hidrologia: ciência e aplicação. 2. ed. Porto Alegre:
Editora da UFRGS, 1997. 943 p.
Authors contributions
André Ricardo Loewen: Paper conception, definition and implementation of the methodology, bibliographical research, analysis and conclusions from the results, writing and preparation
of igures and tables.